Article Text

Abstract
Background Evaluation of flow diversion treatment of intracranial aneurysms is difficult owing to lack of knowledge of the target hemodynamic environment.
Objective To identify hemodynamic conditions created after flow diversion that induce fast aneurysm occlusion.
Methods Two groups of aneurysms treated with flow diverters alone were selected: (a) aneurysms completely occluded at 3 months (fast occlusion), and (b) aneurysms patent or incompletely occluded at 6 months (slow occlusion). A total of 23 aneurysms were included in the study. Patient-specific computational fluid dynamics models were constructed and used to characterize the hemodynamic environment immediately before and after treatment. Average post-treatment hemodynamic conditions between the fast and slow occlusion groups were statistically compared.
Results Aneurysms in the fast occlusion group had significantly lower post-treatment mean velocity (fast=1.13cm/s, slow=3.11cm/s, p=0.02), inflow rate (fast=0.47mL/s, slow=1.89mL/s, p=0.004) and shear rate (fast=20.52 1/s, slow=32.37 1/s, p=0.02) than aneurysms in the slow occlusion group. Receiver operating characteristics analysis showed that mean post-treatment velocity, inflow rate, and shear rate below a certain threshold could discriminate between aneurysms of the fast and slow occlusion groups with good accuracy (84%, 77%, and 76%, respectively).
Conclusions The occlusion time of cerebral aneurysms treated with flow diverters can be predicted by the hemodynamic conditions created immediately after device implantation. Specifically, low post-implantation flow velocity, inflow rate, and shear rate are associated with fast occlusion times.
- Aneurysm
- Flow Diverter
- Stent
Statistics from Altmetric.com
Introduction
Flow diversion (FD) treatment has increasingly been considered for many complex intracranial aneurysms, and has become a reasonable option for difficult aneurysms that were previously considered untreatable.1–4 Despite many successfully treated aneurysms, unpredictable adverse events such as late bleeds have been reported, which raise concerns about this treatment modality.4 ,5 Because the aneurysms are not immediately excluded from the circulation it is important to understand the effects of flow diverters and to predict the long-term outcomes of these procedures. Previous studies have proposed different strategies to connect observations and quantities obtained immediately after treatment and the long-term outcome. For example, the ‘sign of the eclipse’ and other angiographic characteristics have been seen in aneurysms that subsequently thrombosed.1 ,6 Likewise, quantities related to washout times estimated from dynamic angiograms have been investigated.7 Recently, angiography-based estimations of mean aneurysm velocity changes after FD have been proposed.8 Computational fluid dynamics (CFD) studies have proposed that the success of FD treatments depends on the alterations produced by the flow diverters on the aneurysm hemodynamics.9 ,10 Studies using animal models have suggested that in addition to hemodynamics, endothelialization may have an important role in the processes leading to aneurysm occlusion.11 ,12
Despite these advances, the target hemodynamic environment, created by flow diverters necessary to induce a quick and organized intra-saccular thrombosis that leads to a complete and stable aneurysm occlusion, is still largely unknown. Thus, this study focuses on identifying the post-implantation hemodynamic conditions that induce fast aneurysm occlusion.
Methods
Clinical data
Cerebral aneurysms from our database meeting the following selection criteria were selected: (a) aneurysms treated with flow diverters only; (b) available pretreatment 3D rotational angiography images; (c) aneurysms followed with angiography for at least 1 year after treatment; and (d) aneurysms either completely occluded at 3 months (group 1) or still partially permeable after 6 months (group 2). A total of 23 aneurysms meeting these criteria were studied. Fifteen were included in the ‘fast occlusion’ group and eight in the ‘slow occlusion’ group. All aneurysms were treated with Pipeline Embolization Devices (PED, eV3 Endovascular, Plymouth, Minnesota, USA). The aneurysm, parent artery, and device characteristics are listed in table 1. This table also lists the time in months that the aneurysms remained open (denoted ‘remnant’) for the slow occlusion group, and the time when the aneurysms were seen to be completely occluded (if known).
Aneurysm, parent artery, and flow diverter characteristics
Hemodynamics
Image-based CFD models were constructed using patient-specific geometries extracted from the pretreatment 3D rotational angiography images.13 Unstructured grids were generated with a minimum resolution of 0.2 mm. Mesh sizes ranged from 1 to 6 million elements. Models of the FD devices were created and virtually deployed inside the anatomical models, taking into account oversizing effects.14 ,15 Stent models consisted of 48 wires braided with an angle of 150°. For each aneurysm, a second grid was created by adaptively refining elements crossed by the device wires. These refined grids contained between 10 and 120 million elements.
Unsteady 3D blood flow simulations were carried out by solving the incompressible Navier–Stokes equations assuming Newtonian rheology and rigid walls.16 Pulsatile flows derived from phase-contrast magnetic resonance measurements in normal subjects17 and scaled according to the vessel area18 were prescribed at the inlet. Traction-free boundary conditions were prescribed at the outlets, except in small branches were outflow rates were imposed satisfying a principle of minimum work19 corresponding to a uniform wall shear stress (WSS) of 15 dyne/cm2. Two flow calculations were performed for each aneurysm: (1) pretreatment, using the original mesh; and (2) post-treatment, using the refined mesh and an immersed method to model the implanted devices.20 The same boundary conditions were used for both simulations.
Analysis
First, the aneurysm neck was manually delineated on the vascular reconstruction and used to subdivide the model into parent artery and aneurysm regions.21 Then, geometric and hemodynamic quantities were calculated over the aneurysm region. Geometric quantities included (a) aneurysm volume; (b) aneurysm size (SIZE); (c) neck size (NECK); and (d) aspect ratio (AR=aneurysm depth over neck size). Hemodynamic variables included (a) mean aneurysm inflow rate (INFLOW); (b) mean aneurysm velocity (VEL); (c) mean aneurysm shear rate (SHR); (d) mean aneurysm wall shear stress (WSS); (e) mean aneurysm vortex coreline length (CORELEN)—a measure of flow complexity22; and (f) mean aneurysm transit time (MATT=VOL/neck_area/VEL). Additionally, pore density (number of pores per unit area), pore size (average size of pores), and porosity (percentage of the area not occluded by wires) of the device or combination of devices used in each case were calculated.
Descriptive statistics were calculated for each variable over the fast and slow occlusion groups. The mean values were compared using the non-parametric Wilcoxon test. For hemodynamic variables that were found to be significantly different (p<0.05 or 95% confidence) between the two groups, receiver operating characteristics analysis was carried out to investigate whether these variables could discriminate between aneurysms in the fast and slow occlusion groups. The researchers in charge of creating the computational models from the 3D images, running the CFD simulations, delineating the necks, and quantifying the aneurysm geometry and hemodynamics (FM and MR) were blinded to the outcomes of the procedures. Then, aneurysms were grouped into fast and slow occlusion groups and, to avoid possible bias, the subsequent statistical analysis was performed automatically using the Python SciPy package.
Results
Post-treatment hemodynamics favorable for fast occlusion
The mean and SDs of post-implantation hemodynamic variables of the fast and slow occlusion groups are presented in table 2. Ratios of the mean values of group 1 (fast occlusion) over the mean values of group 2 (slow occlusion) are presented in figure 1 (left). On average, aneurysms that occluded fast had significantly smaller inflows, smaller velocities and smaller shear rates. Additionally, their WSS tended to be higher, coreline lengths smaller (ie, simpler flows), and mean aneurysm transit times larger. However, these trends did not reach statistical significance.
Descriptive statistics of pre- and post-implantation hemodynamics, aneurysm geometry, and stent characteristics for the fast (1) and slow (2) occlusion groups
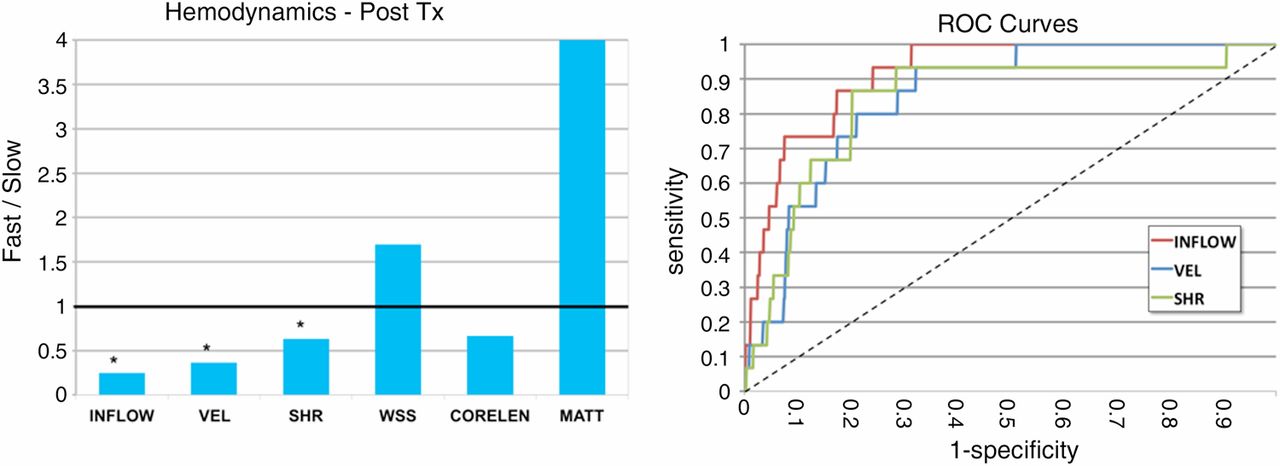
Left: ratios of mean post-implantation hemodynamic variables of the fast occlusion group over the slow occlusion group. *Indicates statistically significant differences (p<0.05). Right: receiver operating characteristic (ROC) curves for post-implantation variables that were statistically different between the fast and slow occlusion groups. CORELEN, mean aneurysm vortex coreline length; INFLOW, mean aneurysm inflow rate; MATT, mean aneurysm transit time; SHR, mean aneurysm shear rate; VEL, mean aneurysm velocity; WSS, mean aneurysm wall shear stress.
The receiver operating characteristics curves for post-treatment variables that were significantly different between the two groups (INFLOW, VEL, SHR) are presented in figure 1 (right). The corresponding area under the curve (AUC) and optimal threshold (OT) identified by finding the point with highest sensitivity and specificity were: INFLOW: AUC=0.766, OT=0.37 mL/s; VEL: AUC=0.841, OT=1.31 cm/s; SHR: AUC=0.758, OT=16.35 1/s.
These results indicate that the post-implantation mean aneurysm velocity discriminated well (84% accuracy) between aneurysms belonging to the fast or the slow occlusion groups. Similarly, post-implantation inflow rates and shear rates were considered good predictors of occlusion time, with an accuracy of by 77% and 76% respectively.
Pretreatment hemodynamics, anatomy, and device characteristics that facilitate fast occlusions
The mean and SDs of pre-implantation hemodynamic variables together with aneurysm geometry and stent characteristics computed over the fast and slow occlusion groups are presented in table 2. Ratios of the mean values of group 1 to the mean values of group 2 are presented in figure 2. The pretreatment inflow rate was significantly lower in the fast occlusion group. The aneurysm pretreatment velocity and vortex coreline length were smaller in the fast occlusion group while the mean aneurysm transit time was larger. However, these trends did not reach statistical significance. Likewise, aneurysms that occluded faster tended to have smaller neck sizes and the devices used in these cases tended to have higher pore densities and smaller pore sizes. But these trends also did not reach statistical significance.

Left: ratio of mean pre-implantation hemodynamic variables of fast over slow occlusion groups. Right: ratio of aneurysm geometric (red) and stent characteristics (green) of fast over slow occlusion groups. *Indicates statistically significant differences (p<0.05); †indicates marginally significant differences (p<0.10).
Discussion
FD has become an alternative to coil embolization, especially for large and complex aneurysms.23 However, after deployment of FD devices, it is difficult to assess whether the aneurysm will completely occlude and/or how long complete occlusion will take. The main reason is that the relationship between the hemodynamic environment created after treatment and the subsequent occlusion time is largely unknown. The goal of this study was to identify possible associations between post-implantation flow conditions (ie, the target hemodynamic environment of FD interventions) and aneurysm occlusion times. So, we selected two well-defined non-overlapping groups of aneurysms, one with aneurysms completely occluded before 3 months and another with aneurysms still permeable 6 months after treatment. This allowed us to compare unambiguously the hemodynamic conditions in these two groups, and select thresholds to discriminate between these two groups.
We found that the mean aneurysm velocity after treatment was significantly smaller in aneurysms that occluded before 3 months and a threshold of 1.3 cm/s could predict whether the aneurysms were in the fast or slow occlusion groups with very good accuracy (84%). Similarly, the post-treatment inflow and mean shear rate were significantly lower in the fast occlusion group, and corresponding thresholds of 0.37 mL/s and 16.3 s−1 could predict if the aneurysms belonged to the fast or slow occlusion group with an accuracy of 76% and 75%, respectively. Thus, hemodynamic conditions created immediately after deployment of the FD devices seem to determine the occlusion time of the aneurysm.
Our study also showed that certain aneurysm characteristics may facilitate achieving the appropriate post-implantation hemodynamic environment that induces a fast aneurysm occlusion. Specifically, flows in aneurysms with lower pretreatment inflow rate and mean velocity, and smaller necks are easier to deflect. In aneurysms with larger inflows, velocities and neck sizes, it seems advantageous to use devices or combinations that produce larger pore densities and smaller pore sizes.
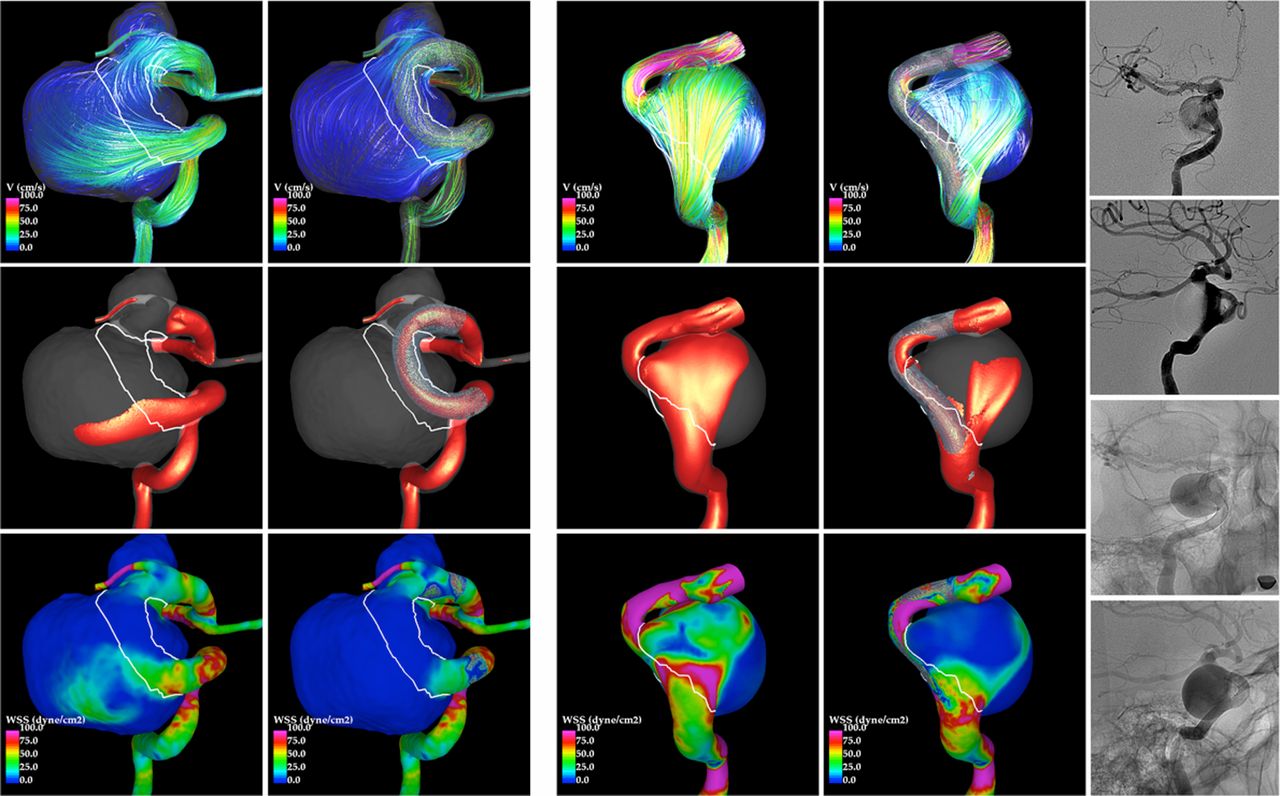
Slow occlusions might also be related to incomplete blocking or redirection of the flow due to gaps between the flow diverters and the parent artery, especially in tortuous vessels. Figure 3 shows an example of an aneurysm that occluded before 3 months (left panel) and another that remained permeable for at least 6 months (right panel), both large, with wide necks and located in the cavernous internal carotid artery. Before treatment both have high speed jets in the proximal part of the neck, impacting on the body of the aneurysm and dispersing into complex flow patterns before exiting through the distal neck. After treatment, the flow in the first aneurysm (fast occlusion) has largely been deflected away from the aneurysm. In contrast, in the second aneurysm (slow occlusion) a strong inflow jet and larger aneurysmal velocities remain after treatment. The persistence of this strong inflow seems to have occurred because the FD was not making perfect contact with the proximal parent artery, creating a sort of ‘endo leak’ that feeds the aneurysm. This observation can be confirmed in post-implantation angiography images (figure 3, right). Thus, in addition to appropriate selection of pore size and density, it seems crucial to ensure good device positioning against the proximal parent artery wall. If this cannot be achieved, perhaps telescopic stenting, balloon remodeling, or coiling should be considered.

Left: example of an aneurysm completely occluded at 3 months. Right: example of a second aneurysm still permeable at 6 months. Visualizations of flow streamlines (top), isovelocity surfaces (middle), and wall shear stress (bottom) are presented before (left column of each panel) and after (right column of each panel) treatment. The furthest right column shows selected frames of a post-implantation angiogram, demonstrating the persistent inflow into the second aneurysm.
The most important limitations of this study include (a) small sample size, which requires confirmation of the results with larger series; (b) lack of patient-specific flows, which can affect the exact values of the proposed thresholds; and (c) somewhat idealized virtual stent deployment that may not exactly reproduce the in vivo device geometries. In addition, the assumption that a fast occlusion avoids complications and leads to a successful outcome may be arguable and should be further investigated. Despite these limitations, interesting associations and trends were identified. If confirmed in larger studies, this could lead to objective and quantitative predictors of aneurysm occlusion time after FD treatment.
Conclusions
The occlusion time of cerebral aneurysms treated with flow diverters can be predicted by hemodynamic conditions created immediately after treatment. Specifically, low post-implantation velocities, inflow rates and shear rates are associated with fast occlusion times. The change in hemodynamic quantities from pre- to post-treatment may be useful for comparing the performance of different devices, but not for evaluating the treatment of a particular aneurysm. It is the final hemodynamic state after FD that determines the subsequent occlusion time.
References
Footnotes
-
Contributors FM and JRC: conceived the work; modeled, analyzed, and interpreted the results, and drafted the manuscript. MR: created the image-based models. CB and JC: collected the data. RC: selected the cases and edited the manuscript. ES and PL: conceived the work, collected the data, analyzed and interpreted the results.
-
Funding This work was partially supported by Philips Healthcare and FAPESP processo 2012/23383-0.
-
Competing interests None.
-
Provenance and peer review Not commissioned; externally peer reviewed.
-
Data sharing statement De-identified data may be available upon request.