Article Text

Abstract
Background Postinterventional cerebral hyperdensities (PCHDs) are a common finding after endovascular stroke treatment. There is uncertainty about the extent to which PCHDs correspond to hemorrhage or contrast staining. Our aim was to evaluate the use of PCHD density on immediate postinterventional CT, and PCHD evolution on follow-up CT for differentiating contrast staining from hemorrhage after endovascular treatment.
Methods We retrospectively reviewed the imaging data of 84 patients who underwent endovascular treatment for acute arterial ischemic stroke in the anterior circulation and who received an immediate postinterventional CT, a follow-up CT within 36 h, and a follow-up MRI within 10 days.
Results PCHDs were seen in 62 of 84 patients in a total of 130 Alberta Stroke Program Early CT Score (ASPECTS) areas. A specificity of 100% to predict hemorrhage was only seen for PCHDs with densities <40 HU (for ruling hemorrhage out) and ≥140 HU (for ruling hemorrhage in), at the cost of a low sensitivity of 1.1% and 2.4%, respectively. Persisting PCHDs correlated with hemorrhage with a specificity of 93.3% and a sensitivity of 62.5%. When follow-up CT was performed at least 19 h after the first CT, persisting PCHDs correlated with hemorrhage with a specificity of 100% and a sensitivity of 62.5%.
Conclusions There are no density thresholds for PCHDs that allow predicting the absence or presence of hemorrhage with 100% specificity and acceptable sensitivity. A CT scan performed at least 19–24 h after endovascular therapy is the only reliable method to differentiate contrast staining from hemorrhage.
- Stroke
Statistics from Altmetric.com
Introduction
Endovascular thrombectomy has become a common treatment option for acute ischemic stroke caused by occlusion of large cerebral arteries.1 Hyperdense cerebral areas, also known as postinterventional cerebral hyperdensities (PCHDs), are a common finding on non-contrast enhanced CT performed shortly after endovascular stroke treatment and appear in up to 86% of cases.2 PCHDs are thought to represent various degrees of ischemic damage to the blood–brain barrier (BBB).2–18 Normally, the BBB is hardly permeable for iodinated contrast agents or red blood cells. However, ischemic damage and, to some extent, local toxicity of tissue plasminogen activator may compromise the integrity of the BBB. As a consequence, contrast agent and/or red blood cells can ooze into the parenchyma in affected areas.19–23 When ischemic injury is limited to the endothelial cell layer, PCHDs are thought to represent contrast staining. When ischemic injury degrades the basal lamina, however, PCHDs may also be associated with hemorrhage. As the main purpose of a postinterventional CT is to rule out hemorrhage, the presence of PCHD creates a diagnostic conundrum that can interfere with further patient treatment, such as the rapid introduction of antiplatelet treatment or the administration of anticoagulants.24 ,25
It has been shown that it is possible to distinguish contrast staining from hemorrhage via MRI or dual-energy CT.2–5 The availability of dual-energy CT is limited, however. Conventional CT, on the other hand, poses problems when it comes to distinguishing contrast staining from hemorrhage because of the similar densities of iodine and hemorrhage. Some authors have suggested differentiating hemorrhage from contrast based on whether or not PCHDs persist after 24 h, or have proposed certain density thresholds to predict (>90 HU) or to rule out (<50 HU) underlying hemorrhage.10 ,11 ,13 ,14 ,17 However, consistent and systematic MRI data to validate these CT criteria are lacking.10 ,11 ,13 ,14 ,17 The aim of this study was therefore to evaluate the applicability of density measurements in PCHDs on immediate postinterventional conventional CT and the evolution of PCHDs on follow-up CT for the distinction between hemorrhage and contrast staining.
Methods
Patients
This was a retrospective study performed in two university hospitals with a stroke unit and extensive experience in endovascular stroke treatment. Patients were included who underwent endovascular stroke treatment for an acute arterial ischemic stroke in the anterior circulation and who received (a) a first post-interventional CT within 4.5 h after the procedure, (b) a second follow-up CT within 36 h of the procedure, and (c) an MRI within 10 days of the procedure. Between January 2011 and September 2015, 84 patients fulfilled all the inclusion criteria.
Image acquisition and analysis
In center A, immediate postinterventional CT was performed on a helical 32-slice CT scanner (Aquilion 32, Toshiba) or a helical 256-slice dual-energy CT scanner (Somatom Definition Flash, Siemens Healthcare, Erlangen, Germany). Only five patients received dual-energy CT examinations, whereas the rest of the patients received conventional CT examinations. Mixed images that were treated as conventional monochromatic CT images were used for analysis of the five cases with dual-energy CT scans. The follow-up CT was always performed on a helical 32-slice CT scanner (Aquilion 32). Postinterventional MRI was performed on one of two 1.5T systems (Avanto, Siemens Healthcare; Magnetom Symphony, Siemens Healthcare) or on a 3T system (Magnetom Trio, Siemens Healthcare). In center B, immediate and follow-up CT scans were performed on a 20-slice CT scanner (Somatom Definition AS, Siemens; Straton MX P, Siemens. Postinterventional MRI was performed on a 1.5T scanner (Intera, Philips Healthcare, Best, Netherlands) or a 3T scanner (Magnetom Prisma, Siemens).
PCHDs were assessed using the standardized binary Alberta Stroke Program Early CT Score (ASPECTS) evaluation form that divides the brain parenchyma into 12 distinct areas.26 The association between PCHD and hemorrhage was analyzed per patient and per ASPECTS area. The density of PCHD was measured within a circular region-of-interest in the densest appearing area of the PCHD. When PCHDs were persisting on follow-up CT, the density of the persisting PCHD was measured in the same region-of-interest. Mean HU was used for statistical analysis.
T2-weighted fluid-attenuated inversion recovery (T2-FLAIR), T1-weighted SE, T2-weighted TSE, and diffusion weighted images (DWI) with apparent diffusion coefficient maps were acquired in all patients. Hemorrhage was assessed using gradient echo T2*-weighted (GE-T2*) images that were available in 62/84 patients. When GE-T2*-weighted images were not available we used low-b images from DWI sequences, which have been shown to be effective in determining hemorrhage.27
Clinical and imaging data were evaluated retrospectively after obtaining consent of the respective ethics committees. Radiological data were analyzed blinded to all clinical data in randomized order on standard PACS workstations by one experienced neuroradiologist and two radiologists-in-training (center A) or by two experienced neuroradiologists (center B). A reference standard for statistical analysis was established in a consensus reading.
Imaging definitions
Postinterventional cerebral hyperdensities (PCHDs)
We have adopted the term introduced by Nikoubashman et al who defined PCHDs as non-solid visually distinctive parenchymal hyperdense areas diagnosed within 4.5 h after recanalization on the first postinterventional CT, with a surface of at least 0.1 cm3, an increased density of at least 5 HU compared with the unaffected contralateral side, without space-occupying effect, and conforming to the grey-white matter boundaries of normal anatomic structures.14
Transient PCHDs
Transient PCHDs are PCHDs that become iso- or hypodense to the unaffected contralateral hemisphere on follow-up CT (see above for timing).
Persisting PCHDs
Persisting PCHDs are PCHDs that are visible on follow-up CT. Persisting PCHDs which had increased in volume and no longer respected the boundaries of normal grey-white matter structures and/or demonstrated space-occupying effect that could not be attributed to progressive ischemic edema were considered parenchymal hematomas (PH) (see definition below).
Hemorrhagic transformation
Hemorrhagic transformation (HT) was categorized according to the European Cooperative Acute Stroke Study (ECASS-1) classification.28
Hemorrhagic infarction (HI): petechial hemorrhage without space-occupying effect, non-solid and respecting borders of grey and white matter; further subdivided into HI1 (small petechiae) and HI2 (more confluent petechiae).
Parenchymal hematoma (PH): coagulum with mass effect; further subdivided into PH1 (<30% of the infarcted area with mild space-occupying effect) and PH2 (>30% of the infarcted area with significant space-occupying effect).
Statistical analysis
Continuous variables are presented as mean±SD, ordinal variables as median, and categorical variables as frequencies. Fisher' exact tests were used whenever χ2 tests were not applicable. Student' t tests and Mann–Whitney U tests were used when applicable after testing for data distribution with a Shapiro Wilk test. Results with p values with an α level ≤0.05 were defined as significant. Statistical analyses were performed using SPSS V.22 software (IBM, San Jose, California, USA).
Results
Patients, clinical findings, and outcome
The mean age of the patients was 61.7 years (range 11–90 years). Forty-six (55%) patients were female. Initial median National Institute of Health Stroke Scale (NIHSS) and modified Rankin Scale (mRS) scores at admission were 15 and 4, respectively. The median mRS score at 3 months was 2. Details on general clinical characteristics, treatment, imaging acquisition, and clinical outcome of all patients and patients with and without PCHD are summarized in online supplementary table S1. Baseline clinical variables, occluded arteries, endovascular recanalization methods, and clinical outcome did not differ between patients with and without PCHD. However, the time interval between the end of endovascular treatment and the immediate postinterventional CT was significantly shorter in patients with PCHD than in those without PCHD (p=0.024). The frequency of HI was significantly higher in patients with PCHD (p=0.017). The occurrence of PH on follow-up imaging, however, did not differ between the two groups (p=0.542).
Supplementary table
General imaging findings
PCHDs were seen on immediate postinterventional CT in 62 of 84 (73.8%) patients in a total of 130 ASPECTS areas. PCHDs were located in the lenticulostriate territory and in the cortex in 79/130 (60.8%) and 51/130 (39.2%) ASPECTS areas, respectively. PCHDs had a mean density of 63.4±17.0 HU (range 39–140 HU).
On follow-up CT, 36/62 (58%) patients had transient PCHDs, 8/62 (13%) patients had persisting PCHDs, and 18/62 (29%) patients had a combination of persisting and transient PCHDs. Transient and persisting PCHDs were seen in a total of 98/130 (75.4%) and 30/130 (23.1%) ASPECTS areas, respectively. PCHDs in the lenticulostriate area of two patients had evolved to a PH1 on follow-up CT (2/130 ASPECTS areas; 1.5%). The majority of persisting PCHDs were located in the lenticulostriate area (21/30; 70%). Persisting PCHDs had a mean density of 48.3±9.7 HU (range 32–71 HU). Compared with the immediate postinterventional CT, a mean decrease in density of 27.0±19.8 HU (range 1–98 HU) was observed.
On follow-up MRI, HT was observed in 37 of 84 (44.0%) patients in a total of 52 ASPECTS areas. HT was seen in an area that was hyperdense on the immediate postinterventional CT in 41/52 (78.8%) ASPECTS areas. There was HI1 in 24 patients in a total of 27 ASPECTS areas, HI2 in 20 patients in a total of 23 ASPECTS areas, and PH1 in two patients in a total of 2 ASPECTS areas. There were no cases of PH2. The frequency of HT on MRI performed within 36 h of the procedure and on MRI performed between 36 h and 10 days did not differ significantly (total patient group p>0.999, patients with PCHD p=0.703, patients without PCHD p=0.411) (figure 1).
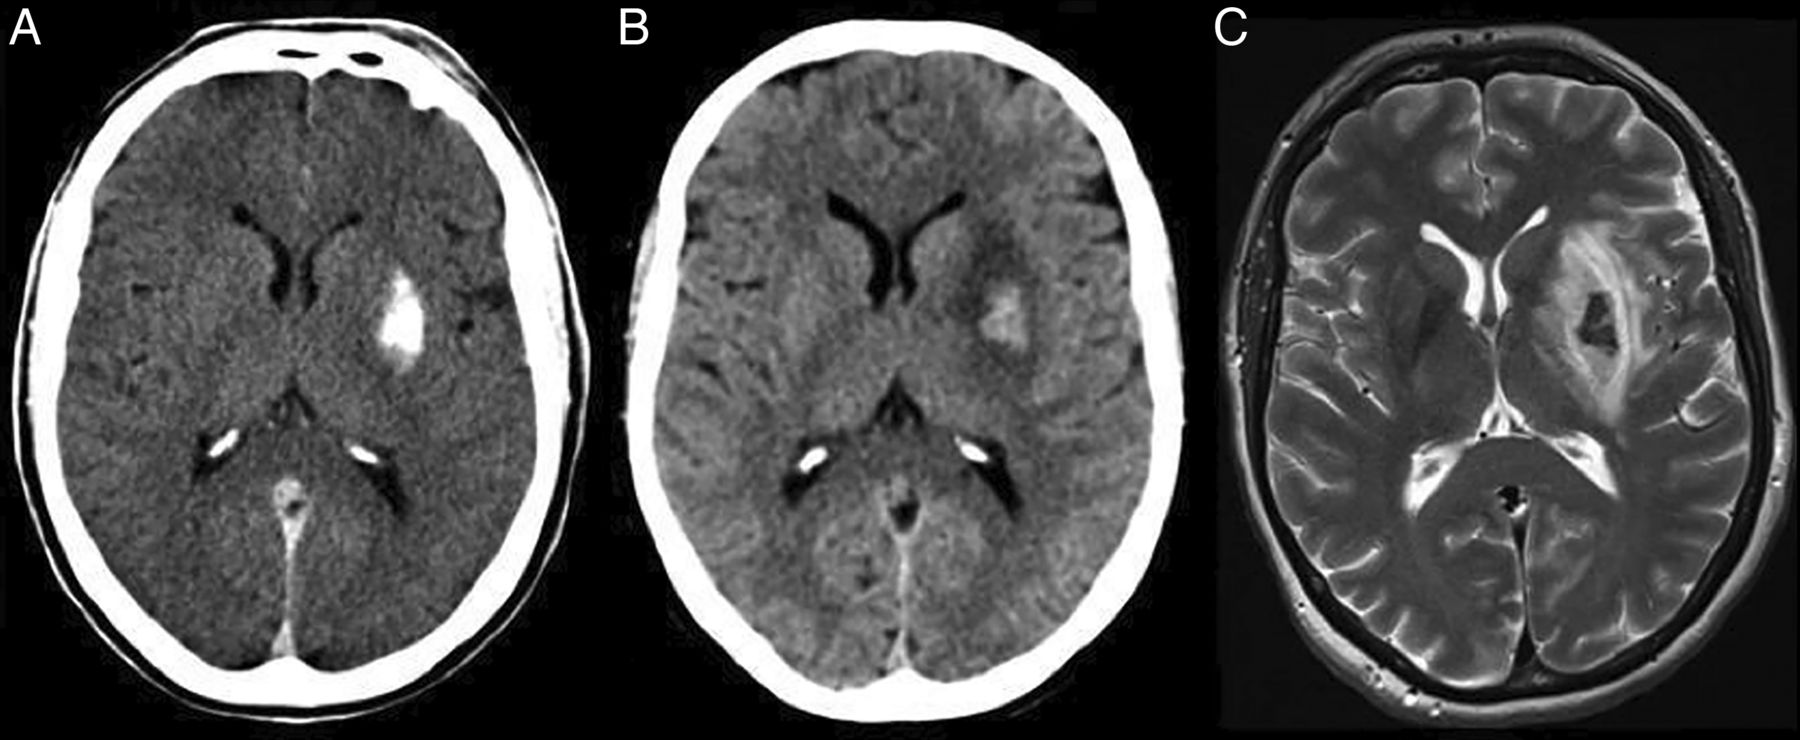
Persisting postinterventional cerebral hyperdensity (PCHD) with hemorrhagic infarction (HI) type 2. PCHD in the left lentiform nucleus (A) faded away but is still present on follow-up CT 22 h later (B). MRI shows confluent petechiae, corresponding to HI type 2 (C).
Association between PCHD density and HT
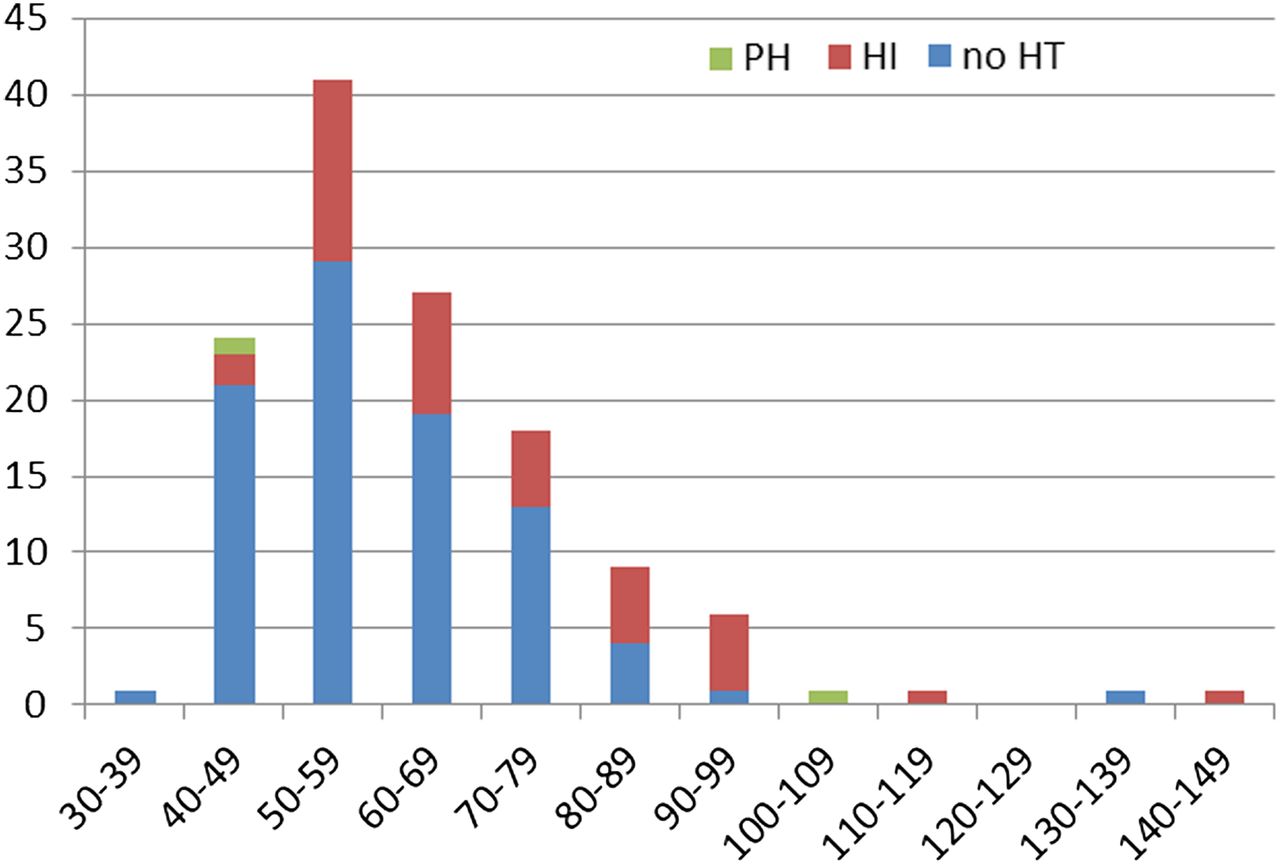
In total, 1008 ASPECTS areas were evaluated in 84 patients. In the group without HT, the mean PCHD density was 59.6±14.1 HU (range 39–136 HU). In the group with HT, the mean PCHD density was 71.6±20.0 HU (range 49–140 HU) for all forms of HT combined (HI+PH), 71.3±19.4 HU (range 49–140 HU) for HI, and 77.0±40.0 HU (range 49–105 HU) for PH. The mean HU value of PCHD with HT compared with PCHD without HT was significantly higher (p<0.001). Figure 2 illustrates the distribution of PCHD densities for ASPECTS areas with and without HT on MRI. HU values ≥90 had a sensitivity of 19.5%, a specificity of 97.8%, a positive predictive value (PPV) of 80.0%, and a negative predictive value (NPV) of 72.5% for all forms of HT combined (table 1). These values were similar when only considering HI. When only PH was considered, specificity was similar but PPV was extremely low (10%). HU values <50 had a sensitivity of 24.7%, a specificity of 92.9%, a PPV of 88%, and a NPV of 36.8% to predict the absence of HT. A specificity of 100% to predict HT could be achieved only for PCHD densities <40 HU (for ruling out HT) and ≥140 HU (for detecting HT), each time at the cost of a low sensitivity of 1.1% and 2.4% respectively.
Predictive value of PCHD with densities ≥90 HU on immediate postinterventional CT for the final HT diagnosis on MRI
Graph correlating the density of postinterventional cerebral hyperdensity (PCHD) on immediate postinterventional CT with the presence or absence of hemorrhagic transformation (HT) on MRI. x axis shows distribution of densities of PCHD in HU units on immediate postinterventional CT; y axis shows number of Alberta Stroke Program Early CT Score (ASPECTS) areas. HI, hemorrhagic infarction; PH, parenchymal hemorrhage.
Association between PCHD evolution and HT
Table 2 correlates the evolution of PCHD on follow-up CT with the presence or absence of HT on MRI. As no new cases of PH had developed between follow-up CT and MRI, this is a correlation between PCHD evolution and the presence or absence of HI on MRI. HI was more frequent in persisting than in transient PCHDs (p<0.001). Only a minority of transient PCHDs showed HI on MRI (15/98; 15.3%) with HI1 in 13/15 and HI2 in 2/15 cases. Persisting PCHDs correlated with HI in the majority of cases (24/30; 80%) with HI1 in 6/24 and HI2 in 18/24 cases. Persisting PCHDs correlated with HI with a sensitivity of 62.5%, a specificity of 93.3%, a PPV of 80.6%, and a NPV of 85.0%. The mean density of persisting PCHDs was 47.9±9.9 HU in the group with HI and 50.2±9.0 HU in the group without HI (p=0.612). Mean time between postinterventional CT and follow-up CT was significantly longer in patients with persisting PCHDs and HI than in patients with persisting PCHD without HI (18:21±6:45 h vs 11:34±6:10 h; p=0.003). When follow-up CT was performed at least 19 h after the first CT, persisting PCHDs correlated with HI with a specificity of 100% and a sensitivity of 62.5% (see online supplementary figure S1; online supplementary table S2). No statistically significant difference was observed for the time between the two CTs between transient PCHDs with HI and transient PCHDs without HI (p=0.38).
Association between the evolution of PCHD on follow-up CT (rows) and the presence of HT on MRI (columns)
Discussion
When PCHDs are encountered after endovascular stroke treatment, the main concern is the presence of underlying hemorrhage. Some authors have advocated the use of density thresholds to differentiate contrast staining from hemorrhage on postinterventional CT. Payabvash et al, for instance, reported that an average attenuation <50 HU (of the most hyperattenuating component of the PCHD) can safely and effectively be used to exclude hemorrhage with a specificity of 100% and a sensitivity of 56%. However, hemorrhage diagnosis was solely based on follow-up CT findings in their series.17 In our study we relied on MRI verification instead of follow-up CT for the diagnosis of hemorrhage and found that PCHDs with HU values <50 HU on immediate postinterventional CT ruled out hemorrhage with a good specificity of 97.8% at the cost of a low sensitivity of 27%. A specificity of 100% for ruling out hemorrhage was only achieved with HU values <40 HU, which in turn came with the cost of an extremely low sensitivity of 1.1%, rendering this cut-off useless in daily clinical practice.
The same problem applies for HU thresholds to detect hemorrhage. PCHDs with densities ≥140 HU correlated with HT with a specificity of 100% but were associated with a low sensitivity of 2.4%. In a frequently cited landmark study by Yoon et al10 the authors described an association of 100% between PCHDs with densities exceeding 90 HU, which persisted on follow-up CT and HT. However, the authors based their HT diagnosis on CT without verifying their results with MRI. In our series, PCHDs with HU values ≥90 correlated with HT with a high specificity (97.8%) but a low sensitivity (19.5%). Our findings are in accordance with the results of Kim et al who systematically correlated their CT findings with MRI and who reported that HU values >90 poorly predicted HT with a sensitivity of 22% and a specificity of 97%.12
Thus, we could not identify density thresholds for PCHDs that allowed predicting the presence or absence of HT with a specificity of 100% and an acceptable sensitivity.
Many authors have advocated or employed a 24 h cut-off for the distinction between extravasated contrast agent and hemorrhage,7 ,9 ,10 ,13 ,14 based on the assumption that hemorrhage is likely to remain in the extravascular space and thus appear hyperdense even after 24 h while contrast agent is likely to be resorbed within 24 h.7 ,9 ,10 Systematic MRI correlation to validate this ‘24 h-wash-out’ heuristic is lacking, however.9 ,10 ,13–18
In our study, persisting PCHDs were associated with HI with a specificity of 93.2% and a sensitivity of 62.5%. False-positive persisting PCHDs—not associated with HI on MRI—were only seen when follow-up CT was performed within 19 h after the first CT. When follow-up CT was performed at least 19 h after the first CT, persisting PCHDs were associated with HI with a specificity of 100% and sensitivity of 62.5%.
Transient PCHDs, on the other hand, ruled out HI with a NPV of 80.6%. False negative transient PCHDs—transient PCHDs associated with HI on MRI—could not be avoided regardless of the timing of imaging, however. Although this implies that transient PCHDs can never rule out HI with 100% certainty, it should be noted that the majority of HI seen in transient PCHDs corresponded with small petechial hemorrhages (HI1) on MRI that could not have been expected to be seen on follow-up CT.
In the end it should be stressed that the type of hemorrhage encountered in persisting PCHDs is not parenchymal hemorrhage (which—opposed to PCHD—is space-occupying by definition) but HI, which has a rather benign natural history. Whereas parenchymal hemorrhage corresponds to an actual space-occupying hematoma, HI corresponds to petechial oozing, which is assumed to be a secondary ischemic phenomenon, a result of ischemic damage to the microvasculature possibly related to reperfusion.29 Prognostically, only the PH2 type is found to be a significant predictor of neurological deterioration and mortality at 3 months whereas HI1, HI2 and PH1 are not associated with increased morbidity and mortality.28 Hence, HI that might be encountered in PCHDs may have rather minor clinical implications in daily clinical care.
Study limitations
Major limitations of our study are the retrospective approach and the delay between follow-up CT and MRI. Due to the delay between follow-up CT and MRI, we cannot rule out the possibility that some of the HT observed on MRI reflects delayed HT that developed between these imaging studies. Nevertheless, our findings correlate well with those of Kim et al12 who examined 38 patients with PCHD and who performed MRI within 24 h after the intervention. Furthermore, no increased frequency of HT was observed in patients who received MRI within 36 h of the intervention compared with those who received MRI between 36 h and 10 days. This is why we feel confident that our findings prove valid despite this limitation.
Conclusions
PCHDs are a frequent occurrence after interventional stroke treatment. No density thresholds exist that allow a reliable differentiation between hemorrhage and contrast staining on immediate postinterventional CT. A follow-up CT performed 19–24 h after endovascular treatment is the only reliable method to differentiate between the two. In those patients for whom a more rapid differentiation is required, alternative imaging methods such as dual-energy CT or MRI should be considered.
References
Footnotes
SD and ON contributed equally.
Contributors All authors were involved in conception and design of the study, acquisition of data, analysis and interpretation of data, drafting the article, and critically revising the article.
Competing interests MW has the following disclosures: grants: Stryker Neurovascular, Siemens Healthcare; personal fees: Stryker Neurovascular, Silkroad Medical, Siemens Healthcare, Bracco; non-financial support: Codman Neurovascular, Covidien, Abbott, St Jude Medical, Phenox, Penumbra, Microvention/Terumo, B. Braun, Bayer, Acandis, ab medica.
Ethics approval Ethics approval was obtained from the ethics committee of UZ Gent and UK Aachen.
Provenance and peer review Not commissioned; externally peer reviewed.