Article Text

Abstract
Objectives: Previous studies have shown that upper cervical cord atrophy (UCCA) occurs in multiple sclerosis (MS), particularly in those disabled and with primary or secondary progressive disease. It is less clear how early it can be detected in relapsing-remitting (RR) MS, and whether early cord atrophy relates to the concurrent or future clinical course.
Methods: Twenty seven RR MS patients (median disease duration 1.7 years, in all cases <3 years from onset) were recruited along with 20 controls. They were followed for up to 3 years with a yearly assessment of UCCA and clinical function measured by the Expanded Disability Status Scale (EDSS) and MS Functional Composite Score (MSFC). Clinical and MRI correlations were investigated. Statistical models adjusted for covariates including total intracranial volume.
Results: Longitudinal analysis showed a significant decrease in UCCA in patients both within the patient cohort (p<0.001) and in comparison with controls (p = 0.001). There was a significant increase in EDSS (p = 0.008) but no significant change in MSFC. The rate of UCCA loss did not correlate with clinical change or with change in brain volume.
Conclusions: In summary, serial UCCA measurement detects the development of spinal cord atrophy in clinically early RR MS.
- β-IFN, beta-interferon
- BPF, brain parenchymal fraction
- 95% CI, 95% confidence interval
- CIS, clinically isolated syndromes
- EDSS, Expanded Disability Status Scale
- FOV, field of view
- FSPGR, fast spoiled gradient echo
- Gd, gadolinium-DTPA
- MS, multiple sclerosis
- MSFC, MS Functional Composite Score
- PD, proton density
- RR, relapsing-remitting
- TE, echo time
- TI, inversion time
- TICV, total intracranial volume
- TR, repetition time
- UCCA, upper cervical cord atrophy
- atrophy
- cord area
- early disease
- MRI
- multiple sclerosis
Statistics from Altmetric.com
- β-IFN, beta-interferon
- BPF, brain parenchymal fraction
- 95% CI, 95% confidence interval
- CIS, clinically isolated syndromes
- EDSS, Expanded Disability Status Scale
- FOV, field of view
- FSPGR, fast spoiled gradient echo
- Gd, gadolinium-DTPA
- MS, multiple sclerosis
- MSFC, MS Functional Composite Score
- PD, proton density
- RR, relapsing-remitting
- TE, echo time
- TI, inversion time
- TICV, total intracranial volume
- TR, repetition time
- UCCA, upper cervical cord atrophy
The spinal cord is frequently affected, both pathologically and clinically, in multiple sclerosis (MS).1–4 Extensive axonal loss in the cord has recently been documented in postmortem studies5–9 and is likely to make an important contribution to the locomotor disabilities and sphincter disturbances that are experienced by many patients.2,10,11
Axonal loss and demyelination will cause loss of tissue. It might therefore be anticipated that when imaging measures of tissue loss are acquired in a clinically eloquent location such as the spinal cord, an association between atrophy and clinical dysfunction would emerge. Indeed, quantitative MRI based measurements of the upper cervical cord area have shown that atrophy is most apparent in MS patients with primary or secondary progressive disease and is correlated with clinical disability.11–18
Most studies investigating relapsing-remitting (RR) cohorts have shown no significant cross sectional loss of area when compared to healthy controls.11,12,16,17 However, two studies have reported evidence of an increased rate of atrophy longitudinally in patients with well established RR MS over 1 year14 and 4 years.19 A further study investigating patients with clinically isolated syndromes (CIS) suggestive of MS has reported atrophy in those subjects with abnormal scans at baseline but no progressive loss over 1 year.20
In developing objective quantitative MRI measures of disease progression for studies of prognosis and disease modifying treatment, it is relevant to delineate the first stages of evolution of a detectable abnormality. It is not evident from previous studies how early in the disease course that an increasing loss of cord tissue can be detected. The present study reports a 3 year serial study of upper cervical cord atrophy (UCCA) measures in clinically early RR MS patients (median disease duration at entry 1.7 years and all <3 years from onset) and healthy volunteers to determine (i) the comparative changes in UCCA within the two groups and whether there is a significant difference between them and (ii) whether change in UCCA at this early stage is related to clinical and other MR measures of the disease.
METHODS
Subjects
The RR MS cohort consisted of patients who at baseline were within 3 years of first symptom onset and who were scanned up to four times at approximately yearly intervals over 3 years; all those included had a minimum of two scans within the 3 year study period. At baseline there were 27 patients with clinically definite21 RR22 MS (19 female, 8 male; mean age 37.3 (range 26.9–55.6) years; median disease duration 1.7 (range 0.5–3) years; median Expanded Disability Status Scale (EDSS)23 1.0 (range 0–3)) and 20 healthy volunteers (10 female, 10 male; mean age 35.3 (range 23.3–52.7) years). After 1 year, 25 patients and 20 controls were imaged. After 2 years, 25 patients and 17 controls were scanned, and at 3 years 24 patients and 12 controls were studied. Median length of time from study start to completion was 1089 days in patients and 1088 days in controls.
None of the subjects at baseline had experienced a clinical relapse or received a course of corticosteroids within the month prior to imaging. No patients were on beta-interferon (β-IFN) at recruitment; however, during the study follow up period, 12 of the 27 original MS patients received this treatment. The EDSS and MS Functional Composite Score (MSFC)24 were assessed in each patient at all time points. Informed consent was obtained from all subjects and the study had approval of the Joint Medical Ethics Committee of the Institute of Neurology and National Hospital for Neurology and Neurosurgery, Queen Square, London.
MRI protocol
At all time points, scans were performed on a GE Signa 1.5 T scanner (General Electric Medical Systems, Milwaukee, WI, USA). All subjects had a volume acquired inversion prepared fast spoiled gradient echo (FSPGR) of the spinal cord (repetition time (TR) 13.2 ms; echo time (TE) 4.2 ms; inversion time (TI) 450 ms; matrix 256×256; field of view (FOV) 250×250) forming 60×1 mm sagittal slices covering the whole of the cervical cord. From this, five contiguous 3 mm pseudoaxial slices were reformatted using the centre of the C2/C3 intravertebral disc as a caudal landmark, with the slices perpendicular to the spinal cord. Scanning time for this sequence was approximately 20 min.
In the same scanning session, dual echo proton density (PD) and T2 weighted images of the brain were acquired using a fast spin echo sequence (28×5 mm axial slices; TE 19/95 ms; TR 2000 ms; matrix 256×256; FOV 240×180). Further, T1 weighted images were acquired of the brain using a conventional spin echo sequence (28×5 mm axial slices; TE 20 ms; TR 540 ms; matrix 256×256; FOV 240×240). In addition, a three dimensional inversion prepared fast spoiled gradient recall (3D FSPGR) sequence (TR 13.3ms; TE 4.2 ms; TI 450 ms; matrix 256×160; FOV 300×225 mm (interpolated during reconstruction to a final in-plane resolution of 1.2×1.2 mm)) providing 124×1.5 mm slices covering the whole cranium was also obtained during a separate scanning sessions (median 5 days (baseline); 7 days (1 year); 8 days (2 years); and 7 days (3 years) from the cord imaging). From these images, total intracranial volume (TICV) and brain volumes were measured (i) because of the reported association between TICV and UCCA16,25 (thus the former could be used as a covariate in analysing UCCA change) and (ii) in order to compare the early progressive brain volume loss that occurs in MS26,27 with changes in UCCA.
In addition to this protocol, post-contrast (triple dose gadolinium-DTPA (Gd), 0.3 mmol/kg) T1 weighted images of the brain (using the same acquisition method as described above) and cord spin echo T1 weighted images (13×3 mm sagittal slices; TR 500 ms; TE 20 ms; matrix 512×512; FOV 480×240) were acquired at baseline and after 6 months in all patients and also at 1, 2, and 3 months post baseline (with 25 out of 27 patients undertaking at least two of these monthly scans) in order to provide an indication of the extent of early inflammatory lesions in the brain and cord. The contrast enhanced scans were acquired in the same scanning session as the cord FSPGR images, but the Gd was administered after the FSPGR sequence.
Image analysis
Images were transferred to a Sun workstation (Sun Microsystems, Mountain View, CA, USA) and uniformity corrected. Using an automated program, the mean area of the slices was calculated from the five pseudoaxial cervical cord images using a technique described by Losseff et al which previously has been shown to have good reproducibility with an intra-observer coefficient of variation (scan-rescan) of 0.8%.12 The observer (WR) was blinded to clinical status and time point of the scan. Gd enhancing lesions of the brain and cord were identified from the post-contrast images of the cord by an experienced observer (DHM). T1 (hypointense and Gd enhancing) and T2 weighted lesions (the latter measured from the PD weighted images) were outlined on the images using the Dispimage display software package (Plummer, Department of Physics, University College Hospitals NHS Trust, London, UK)28 and segmented using a semiautomated contouring technique.29
The TICV of each subject was calculated from the 3D FSPGR cranial images using statistical parametric mapping (SPM99, Wellcome Department of Cognitive Neurology, Institute of Neurology, London, UK) with a technique previously described.30 A recent study investigating brain volume in 21 of the patients taking part in this study showed progressive grey matter tissue loss over 2 years in comparison to controls.27 This data was used along with the segmented brain tissue volumes from the remaining six patients in this study not included in the original brain volume cohort (calculated using identical methodology30) to investigate any association between brain volume (as measured by the brain parenchymal fraction, BPF) and UCCA tissue loss.
Statistics
For the comparison between patients and controls, values of UCCA over the four time points were modelled using random intercepts regression31 with random subject-specific intercepts and common linear slope on time from study baseline; MS indicator and MS×time interaction terms were used to estimate patient versus control differences. Potential confounding by age, gender, weight, and TICV was examined by adding those terms singly as covariates, but the first three variables did not contribute at the 10% level nor materially affect the coefficients of interest, and only TICV was kept in the final model. The linear trajectories estimated from the longitudinal model were also used to estimate baseline, 1, 2, and 3 year cross sectional patient versus control differences, in subjects with TICV equal to their whole group mean (patient or control) TICV at baseline. In patients only, a similar random intercepts model was used with β-IFN treatment indicator and interaction with time to compare effect of treatment in patients, with disease duration as an additional covariate to be examined; again, only TICV contributed in this patient-only model. These analyses were implemented in Stata 8.2 (Stata Corporation, College Station, TX, USA).
Multiple linear regression models of change in UCCA over the study period on corresponding change in (i) MSFC, (ii) lesion volumes (pre-contrast T1 and T2), and (iii) brain tissue volume were used to examine associations between these covariates and UCCA atrophy in patients only. Two tailed Spearman rank correlations were used to assess correlations between change in UCCA and (i) the mean number of Gd lesions per patient in the first 6 months of the study (to evaluate whether early inflammation related to the subsequent evolution of UCCA change over 3 years), (ii) change in the EDSS, and (iii) the functional scores contained within the EDSS that may be more specific to cord pathology (pyramidal, brainstem, bowel, or bladder symptoms and sensory) over the study period. Paired t tests were used to compare changes within a single parametric variable over the study course, whilst Wilcoxon signed rank test was used for non-parametric variables. These analyses were implemented in SPSS 11.0 (SPSS, Chicago, IL, USA). A p value of <0.05 was considered significant.
RESULTS
Table 1 shows the demographic details, lesion volumes, UCCA, and TICV of controls and patients at all time points. The only potential covariate found to be significantly associated with UCCA was the TICV (p = 0.002). The gender, weight, age, and disease duration of subjects was not found to significantly confound UCCA values.
Demographic, clinical, and MRI parameters in patients (MS) and controls (NC) over the study course
In the patient cohort over the whole study course, significant increases in EDSS (p = 0.008), brainstem (p = 0.008), pyramidal (p = 0.016), and bowel and bladder (p = 0.013) symptom functional scores were observed; however, clinically no patient appeared to have entered the secondary progressive stage of MS. The MSFC was not noted to change significantly during the study. Both the T2 weighted (p = 0.001) and T1 weighted lesion volumes (p<0.001) had significantly increased by the end of the study.
Assessment of UCCA
Figure 1 illustrates UCCA values at each time point in both patient and control cohorts.
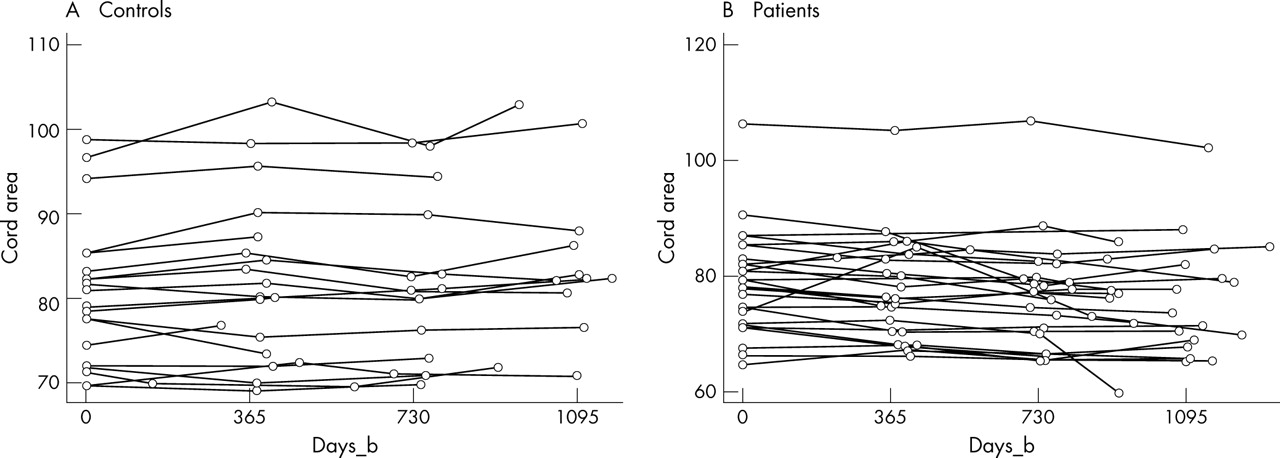
Graphs showing measured upper cervical cord area values over time (days from baseline: days_b) for (A) control and (B) patient cohorts.
Cross sectional UCCA comparisons: patients versus controls
At baseline, in models adjusting for TICV, no significant difference was found in UCCA between patients and controls (p = 0.748). At 3 years, cross sectional comparison of patients versus controls showed borderline evidence that patients have smaller UCCAs (mean difference patients−controls: −4.239 mm2; p = 0.074; 95% confidence interval (95% CI): −8.887 to 0.408) after adjusting for TICV. At 2 years, no significant difference was seen between patient and control cord UCCAs; however, the size of the mean difference between the two cohorts is consistent with the 3 year analysis (that is, approximately two thirds of the mean difference at 3 years) (mean difference patients−controls: −2.902 mm2; p = 0.211; 95% CI: −7.452 to 1.647) after adjusting for TICV.
Longitudinal UCCA analysis
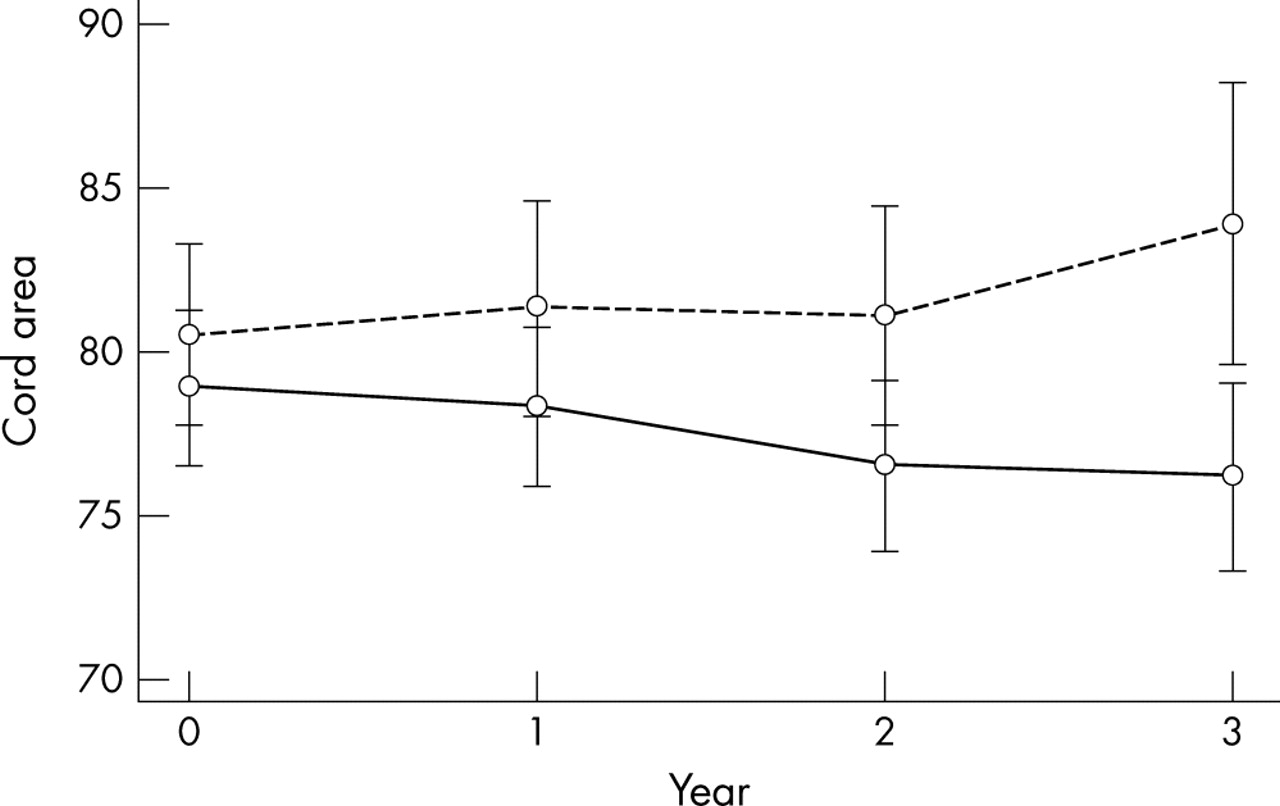
Over the whole 3 year study period, there was a significant difference in the rates of decrease in UCCA between patients and controls (mean patient−control difference per year: −1.161 mm2; p = 0.001; 95% CI: −1.843 to −0.478) with significant UCCA atrophy noted in patients only (mean annual rate: −0.812 mm2; p<0.001; 95% CI: −1.215 to −0.409) but not in controls (p = 0.215) (see fig 2). Over the course of the study, 21/27 (78%) patients exhibited a decrease in their UCCA.

Graph showing total cross sectional mean of patient (solid line) and control (dashed line) cohorts at each time point with contracted confidence intervals. The confidence intervals are contracted so that bars overlap only if the difference is not statistically significant at the 5% level, by multiplying the factor: tN√(S12+S12)/(t1S1+t2S2), where tN, t1, and t2 are the appropriate t values for the whole sample, controls, and patients, respectively, and S1 and S2 are the standard errors in controls and patients.
Because of differences in the control cohort size, gender, and TICV distribution between the 2 and 3 year time points, longitudinal analysis between baseline and 2 years was also performed to confirm results. At this time point, again adjusting for TICV, there was a significant difference in the rates of decrease in UCCA between patients and controls (mean patient−control difference per year: −1.069 mm2; p = 0.026; 95% CI: −2.008 to −0.130) with significant UCCA atrophy noted in patients only (mean annual rate: −0.890 mm2; p = 0.003; 95% CI: −1.497 to −0.303) but not in controls (p = 0.647).
Clinical and MRI correlations with UCCA
Evidence of a correlation was seen between the T1 weighted brain lesion volume and change in UCCA over 3 years with increased T1 hypointense lesion volume noted in patients with relatively less UCCA atrophy (p = 0.020; r = 0.515). No correlation was seen between mean Gd enhancement in the first 6 months (defined as the mean number of Gd enhancing lesions from all post-contrast T1 weighted scans in the first 6 months) and UCCA change over 2 or 3 years and no association was seen between changes in T2 weighted lesion volume and UCCA over 3 years. No significant relationships were noted between changes in UCCA and clinical measures (EDSS and MSFC) over the study duration.
From the analysis of BPF, controls had a significantly greater brain volume than patients at baseline (mean BPF: controls 0.835, patients 0.812; p = 0.012). Over the course of the first 2 years of the study there was a significant decrease in BPF in the patient cohort (p = 0.011) but not in the control cohort (p = 0.123). No correlation was seen between changes in brain tissue volume and UCCA over the 2 years.
No difference was seen when comparing the rate of UCCA loss in those 12 subjects who had started β-IFN during the study and those who had not (p = 0.135).
DISCUSSION
The results of this study showed decreasing UCCA in a cohort of patients with early RR MS; the rate of loss of UCCA did not relate to changes in disability. No previous study has longitudinally investigated RR MS patients as early and for as long a period of time and in comparison with healthy controls. A previous longitudinal study investigating UCCA did demonstrate atrophy in a combined cohort of both secondary progressive and well established RR MS subjects (mean disease duration 5.5 years) over 4 years, but the control population was imaged at baseline only.19 A further 12 month study showed UCCA atrophy in RR MS in comparison to controls, but the cohort had a longer disease duration (mean 5.6 years) and only six such patients were studied.14
From both the 2 and 3 year longitudinal analyses in this study, it is evident that an increased rate of cervical cord tissue loss does occur at this early stage of RR MS, even though there was no significant cross sectional difference in comparison to controls. The negative latter finding likely reflects the large normal inter-individual variation in UCCA, which makes it difficult to detect a subtle degree of atrophy in a single time point study. Although a gender imbalance did exist between the patient and control cohorts, particularly at the final time point, the relative similarities between the results at 2 and 3 years suggests that our longitudinal observations are consistent along the different time points. Furthermore, several potential covariates, including gender, were included in the statistical modelling for the analysis and the only one found to influence UCCA was the TICV which was accounted for in the final analysis.
The apparent absence of correlation between the cervical cord atrophy and disability in early RR MS may be due to a number of factors. Firstly, the pathological processes of inflammation, oedema, and neuroaxonal degeneration which are likely to be causing clinical dysfunction at this stage of the condition, may be having competing effects on UCCA, possibly masking a relationship between disability and atrophy. Secondly, given the minimal levels of clinical dysfunction found in this cohort, an increase in EDSS partly reflects an increase in clinical signs only, rather than significant dysfunction. Thirdly, disability in early RR MS results mainly from incomplete recovery from relapses that result from individual demyelinating lesions, some of which will not be located in nor affect the size of the upper cervical cord. Additionally, the loss of cord tissue is relatively small at about 1% per annum and per se would not seem likely to affect disability (particularly if most of the long tract fibres are still intact). The correlations of UCCA with disability noted in some previous studies were mainly seen in patients with progressive MS, greater disability, and more severe atrophy.11–18 No patient in this cohort had clinically entered the secondary progressive phase by the study end and all still had relatively low levels of disability. Finally, a possible explanation of an apparent absence of correlation between UCCA and MSFC change over the study course may be due to a training effect causing an initial improvement in patient MSFC values32 independent of longitudinal clinical change.
The absence of a correlation of UCCA change in the MS cohort with T2 weighted brain lesion volume, the extent of early Gd enhancement, and also progressive brain tissue atrophy suggest that UCCA may be complementary to these existing MR measures as a marker of the evolution of MS. The dissociation between cord and brain atrophy noted in this study is supported by observations from previous studies in primary progressive33 and benign and disabling MS.34 The association between preservation of UCCA and increasing T1 weighted brain lesion volume is unexpected, and not readily explained, since T1 hypointense lesions have been associated with greater axonal loss.35 The association is only moderate and we do not exclude the possibility that this is a chance finding.
Probably the mechanisms of UCCA are complex and likely to be related to factors other than global measures of brain lesion load. Lesion location may be relevant and in particular the severity of axonal loss and Wallerian degeneration arising from lesions that occur in the spinal cord or in white matter tracts that traverse the upper cord is likely to relevant.7,8,36,37 Previous studies, investigating patients with longer disease durations, have suggested that the effects of demyelination, axonal loss (particularly small fibre loss in the cord), and Wallerian degeneration all contribute to cord atrophy.7,8,38 In the early RR MS patients we studied, inflammation and oedema may be present in the cord (previous studies of patients with CIS suggestive of MS and RR cohorts of early disease duration have reported 42–87.5% to have areas of abnormal cord MRI signal4,39,40) and might have masked subtle tissue loss. The relative extent of these processes may be important in determining cross sectional cord area size. Further longitudinal follow up of this cohort, particularly as some patients start to enter the progressive stage of the disease, will clarify the long term evolution of cord atrophy and its relationship to prognosis. Nevertheless, the early loss of tissue in the studied cohort may imply an important component of longer term pathological progression.
The study did not observe a significant difference between the rate of UCCA loss in patients on or off β-IFN therapy. However, it would be imprudent to draw conclusions from small subgroups studied in a post hoc, non-randomised, and retrospective manner. A recent study of patients with CIS reported that the rate of brain atrophy is slowed by 30% over 2 years in patients receiving this therapy.41
Because the degree of UCCA atrophy in patients with progressive forms of MS is substantial and is also correlated with the extent of disability,11–19 the present finding that cord area loss is already emerging in a cohort of patients with early RR disease and minimal clinical dysfunction raises the question whether early cord atrophy may predict the later development of disability due to myelopathy. More prolonged follow up studies should investigate this possibility. The apparent absence of correlation between UCCA and clinical measures suggests that axonal damage may escape identification by purely clinical measures.
Acknowledgments
The authors thank M Tiberio for performing some of the brain tissue volume analysis in these patients, D MacManus, C Benton, and the Multiple Sclerosis Society of Great Britain and Northern Ireland for their continuing support of the NMR Research Unit, and all the people who kindly agreed to take part in this study.
REFERENCES
Footnotes
-
DTC was partially supported by a grant from Schering AG administered by the Institute of Neurology, London. The Multiple Sclerosis Society of Great Britain and Northern Ireland funded WR and GRD during the course of this study
-
Competing interests: none declared