Article Text

Abstract
OBJECTIVE Magnetisation transfer imaging (MTI) provides information about brain damage with increased pathological specificity over conventional MRI and detects subtle abnormalities in the normal appearing brain tissue, which go undetected with conventional scanning. Brain MRI and MTI findings were compared in patients with multiple sclerosis (MS) and systemic immune mediated diseases (SIDs) affecting the CNS to investigate their roles in understanding the nature of brain damage in these diseases.
METHODS Brain dual echo, T1 weighted and MTI scans were obtained in patients affected by systemic lupus erithematosus (SLE) with (NSLE, n=9) and without clinical CNS involvement (n=15), Behçet's disease (BD) (n=5), Wegener's granulomatosis (WG) (n=9), and antiphospholipid antibody syndrome (APLAS) (n=6). Ten patients with clinically definite MS and 15 healthy controls also underwent the same scanning protocol. Brain MRI and MT ratio (MTR) images of the same subject were coregistered and postprocessed to obtain MTR histograms of the whole brain and of the NABT.
RESULTS Brain hyperintense lesions were found in all patients with MS and with NSLE and in 5/15 patients with SLE, 5/9 with WG, 1/5 with BD, and 3/6 with APLAS. The lesion burden in the brain was significantly higher in patients with MS compared with all the other disease groups. All MTR histogram parameters were significantly different among patient subgroups. Patients with MS had significantly lower average MTR than all except patients with NSLE and significantly lower peak height and location than patients with SLE. patients with NSLE had significantly lower average MTR than patients with SLE.
CONCLUSIONS Microscopic brain tissue damage is relevant in patients with MS, but, apart from patients with NSLE, it seems to be absent in systemic immune mediated diseases, even in the presence of macroscopic MRI lesions or clinical evidence of CNS involvement.
- magnetic resonance imaging
- magnetisation transfer imaging
- systemic immune-mediated diseases
Statistics from Altmetric.com
Systemic immune mediated diseases (SIDs) can often affect theCNS.1 2 Although usually there are evident features leading to a correct diagnosis, in some cases of SIDs CNS disturbances are seen in isolation and their course can be relapsing and remitting, thus requiring multiple sclerosis (MS) to be considered as the main differential diagnosis.
Previous studies reported that conventional T2 weighted brain MRI is sensitive for detecting CNS lesions in patients with various categories of SIDs.2-8 A wide range of MRI abnormalities has been described in these patients,2 3 including large arterial infarctions, dural sinus thrombosis, brain atrophy, and diffuse meningeal thickening. However, multiple white matter lesions mimicking those due to MS can often be the only MRI abnormalities visible in patients with SIDs.3 9 10 Miller et al 3 found that about 70% of these patients have multiple T2 weighted abnormalities on brain MRI. In patients with systemic lupus erythematosus (SLE) and clinical evidence of CNS involvement, the frequency of brain MRI abnormalities can be even higher,11 although the correlations between extent of brain lesions and severity of cognitive disturbances is only modest.12 About 30% of patients with Behçet's disease (BD) and CNS involvement may present with a typical pattern of MRI lesions located in the brainstem.4 13 Only 10% of patients with Wegener's granulomatosis (WG) show some degree of brain MRI abnormalities,6 although the prevalence of clinical CNS involvement is higher.2 Involvement of the CNS is often reported in patients with primary antiphospholipid antibody syndrome (APLAS)14; focal infarcts are the commonest MRI abnormalities described in this disease, although brain atrophy and diffuse white matter hyperintense lesions can also be found in a high percentage of cases.8 15 16 Moreover, recent reports found that up to 20% of patients with MS with brain MRI findings highly suggestive for this disease16 17 can be consistently positive for antiphospholipid antibodies, thus suggesting a concomitant diagnosis of MS and APLAS.
Conventional T2 weighted MRI is highly sensitive for detecting brain abnormalities in MS and other SIDs; however, its diagnostic accuracy is hampered by the limited pathological specificity of the abnormalities detected.18 Magnetic resonance spectroscopy (MRS) and magnetisation transfer imaging (MTI) allow the obtaining of information about tissue damage with increased pathological specificity18 19 over T2 weighted sequences. Controversial results have been achieved by MRS studies of patients with SLE and CNS involvement.20-22 Some studies22 suggested that MRS might provide reliable markers of the burden and evolution of this disease, whereas other authors20 failed to show significant correlations between MRS derived measures and presence or severity of neuropsychiatric symptoms. Good correlations between MTI parameters and pathological or clinical findings have been found in patients with MS.23In detail, measures obtained from the MT ratio (MTR) whole brain histogram analysis,24 which provides a global estimation of the macroscopic and microscopic24 disease burden, were found to be highly correlated with patients' clinical disability23 and neuropsychological impairment.25 26 Using MTI, it has also been shown that, in patients with MS, subtle tissue damage can be detected in the normal appearing white matter.27 The pathology of normal appearing white matter might be a relevant contributor to the neurological impairment in patients with more disabling MS clinical phenotypes.23 A study comparing MTI findings from patients with MS and SLE showed that MTR values of visible T2 lesions and normal appearing white matter in the brain were significantly lower for patients with MS than for patients with SLE.28 In the same study, MTR values from the normal appearing white matter of patients with SLE were similar to those of healthy controls.
In this study, we evaluated and compared conventional MRI and MTI findings in the brain of patients with MS and SID. Aims of the study were: (a) to investigate brain MTR changes within and outside T2 visible lesions from patients with SIDs, with the ultimate goal of improving our understanding of the extent of brain damage in these diseases, and (b) to evaluate the relative contributions of MRI and MTI to a differential diagnosis between MS and SID based on neuroimaging techniques.
Materials and methods
PATIENTS
All patients were recruited over an 8 month period at the Departments of Medicine and Neurology, Ospedale San Raffaele, and the Department of Neurology, Spedali Civili of Brescia. Two physicians visited the patients within 2 days of the MRI scanning procedure (see later) and collected their medical history. Patients had to have a definite diagnosis of SLE, BD, WG, or primary APLAS, based on previously published guidelines.29-32 Exclusion criteria were history of drug or alcohol misuse, head injury, or cerebral diseases not related to SIDs, and concomitant medications (other than corticosteroids or immunosuppressive drugs) that could cause an organic mental syndrome. Patients must not have had clinical manifestations of neurological disease for at least 3 months before study entry and at the time of the study. Based on the same classification criteria used in previous studies,33 patients with SLE with a positive medical history for any CNS involvement were considered as a separate subgroup for data analysis (neurological SLE-NSLE). A positive medical history for migraine in isolation was not considered sufficient to classify patients with SIDs as having neurological involvement.
Two control groups were also studied. The first consisted of 15 age matched healthy controls (nine women and six men; mean age 36.0 years, range 26–56 years). The second consisted of 10 patients with clinically definite MS34 (four women and six men; mean age 40.5 years, range 29–53 years), who were selected from the cohort followed up in our centre to match the patients with SIDs for age and disease duration. To be included patients with MS had to have been free from relapses and steroid or immunomodulating/immunosuppressive treatments for at least 3 months before study entry and at the time of the study. Six were classified as having relapsing-remitting and four as having secondary progressive MS35 and the median disease duration was 7.0 years (range 4–15 years); their median expanded disability status scale (EDSS)36 score was 4.0 (range 0.0–6.0).
The study design was approved by the ethics committees of the participating centres. Written informed consent was obtained from all the patients and controls before study initiation.
IMAGE ACQUISITION
Using a 1.5 Tesla scanner (Vision, Siemens, Erlangen, Germany), we obtained, from all patients and controls, dual echo turbo spin echo (TSE) (TR=3300, TE=16/98, echo train length (ETL)=5, number of acquisitions=1) and postcontrast (gadolinium-DTPA (Gd), 0.1 mmol/kg, postinjection imaging delay=5 min) T1 weighted (TR=768, TE=14, number of acquisitions=2) scans of the brain. Before contrast administration, we also performed brain MTI by obtaining 2D gradient echo (GE) images (TR=640, TE=12, α=20°) with and without a saturation pulse. This was an off resonance radiofrequency pulse centred 1.5 kHz below the water frequency, with a gaussian envelope of duration of 7.68 ms and α=500°. Twenty four (20 for MTI) axial, 5 mm thick contiguous interleaved slices were obtained for brain imaging, with 250 mm square field of view and 256×256 image matrix, thus resulting in an roughly 1×1 mm in plane resolution. The set of slices for MTI was positioned to obtain the same central 20 slices as for the other scans. Patients and controls were positioned in the scanner using published guidelines for MS studies.37
CONVENTIONAL MRI ANALYSIS
Two experienced observers, without knowing to whom the scans belonged, consensually reviewed the MRI hard copies to identify any brain abnormality. Previously published guidelines were followed for the identification of MS-like hyperintense lesions on proton density (PD) weighted images and hypointense and Gd enhancing lesions on postcontrast T1 weighted scans.38
On PD weighted TSE images, brain parenchymal lesions were marked on the MRI hard copies and total lesion volumes were then measured by a single observer, who was unaware of the patients' clinical characteristics. A local thresholding technique was used for lesion segmentation on computer displayed images, keeping the marked hard copies as a reference. Lesions were delineated as regions of interest (ROIs) and total lesion volume was simply calculated by multiplying the total ROI area for the slice thickness. Further details about this image analysis method are extensively reported elsewhere.39
MTI POSTPROCESSING AND ANALYSIS
From the two sets of images without (Mo) and with (Ms) the saturation pulse, MTR images were derived pixel by pixel, according to the following equation:
MTR=(Mo−Ms)/Mo x 100
in which Mo is the mean signal intensity for a given pixel without the saturation pulse and Ms is the mean signal intensity for the same pixel when the saturation pulse is applied. Pixel signal intensities in the resulting MTR images represent the MTR values.
MTR histograms were derived from the whole brain and from the normal appearing brain tissue—that is, the tissue not involved by macroscopic lesions visible on the dual echo scans. Firstly, we removed the skull and other extracranial tissues from the PD weighted and the GE images without and with the MT pulse, with the same local thresholding technique used for lesion segmentation.39 Secondly, the scalp stripped GE images were coregistered and MTR maps obtained. Then, the MTR maps were coregistered with the corresponding scalp stripped PD weighted images. Coregistration of images was performed using a surface matching technique which fits the contours corresponding to the CSF-dura interface of the two MR images. This technique estimates the spatial transformation needed to remap images from different MRI studies into the same spatial reference system, thus enabling a pixel by pixel correspondence between different MRI studies and ensuring the correct positioning of the ROI across multiple images.40 41 The optimal transformation is inferred from the minimisation of the distance between the discrete surfaces. Validation studies have shown that the accuracy of realignment was of the order of the image pixel size.41 To reduce any further image noise, we excluded from the analysis all the pixels with intensities lower than 10%. This enables most of the pixels belonging to CSF and other hypointense normal anatomical structures (for example, blood vessels) to be excluded. To create MTR histograms of the normal appearing brain tissue, when applicable, the macroscopic lesions segmented on PD weighted images were superimposed automatically onto the coregistered MTR maps, and the areas corresponding to the segmented lesions were nulled out. Although lesions were not present in all the subjects studied, for comparability of the results between the different groups, this procedure was performed for all the scans obtained. For both whole brain and normal appearing brain tissue histograms, the following variables were measured: the peak height (the proportion of pixels at the most common MTR value), the peak position (the commonest MTR value), the average brain MTR, and the MTR25, MTR50, and MTR75, which indicate the MTR at which the integral of the histogram is 25%, 50%, and 75% of the total area under the curve, respectively.
On MTR maps, after coregistration with the corresponding scalp stripped PD weighted images (see earlier), we measured the areas and the MTR values for the ROI corresponding to hyperintense PD weighted lesions. Average MTR of the PD weighted hyperintense lesions in the whole brain was calculated for each patient according to the following formula:

where N is the number of lesions in that patient, Ai is the area of lesioni, and MTRi is the value of MTR in lesion i.
STATISTICAL ANALYSIS
Differences in MRI and MTI derived metrics between controls and patients were assessed with a one way analysis of variance (ANOVA). Significance was tested using the F test and p<0.05 was considered to be statistically significant. For post hoc analysis, the two tailed Student's t test for non-paired data was used with the Bonferroni correction for multiple comparisons.
A multivariable analysis was also performed to evaluate the variables that allowed a more accurate distinction between (a) patients with MS and patients with SID and (b) patients with MS and patients with NSLE. A logistic model was used (backward selection, removal criterion p=0.10, likelihood ratio test), with PD weighted total lesion volumes, average brain and lesion MTR, histogram peak height, and location entered as independent variables.
Results
Forty four patients with SIDs (33 women and 11 men; mean age 40.0 years, range 20–66 years) entered the study. Fifteen patients were affected by SLE, nine by NSLE, five by BD, nine by WG, and six by APLAS. At the time of the study, none of these patients had an overt infection or a significant renal failure; 26 patients (11 SLE, eight NSLE, one BD, two WG, three APLAS) were being treated with steroids and eight (two SLE, three BD, three WG) with steroids plus immunosuppressive drugs. Twenty one patients had a positive medical history for CNS involvement; these included nine patients with NSLE and 12 patients with other SIDs (NSIDs) (four WG, two BD, six APLAS). Clinical manifestations of CNS involvement were brain stroke in four patients with NSLE and three patients with WG, transient ischaemic attacks or amaurosis in six patients with APLAS, seizures in five patients with NSLE and one patient with WG, organic brain syndrome in one patient with NSLE and one with WG, and meningoencephalitis in two patients with BD. The main demographic and clinical characteristics of the patient groups are summarised in table 1.
Demographic and clinical characteristics of 44 patients with different types of SID
CONVENTIONAL MRI
No abnormalities were found on the brain MRI from healthy controls.
On brain dual echo scans, all patients with MS showed a typical pattern of multiple, diffuse white matter lesions, mainly located in the periventricular regions. Dual echo MRI abnormalities were found in 23/44 (52%) patients with SIDs (5/15 SLE, 9/9 NSLE, 5/9 WG, 1/5 BD, 3/6 APLAS). All patients with WG with a positive history for CNS clinical involvement had abnormal MRI. Dual echo MRI abnormalities in patients with SIDs can be summarised as follows:
Seven patients (one SLE, four NSLE, two WG) had multiple, discrete hyperintense white matter lesions located both in the periventricular regions and at the cortical/subcortical junction, with a complete sparing of the infratentorial sites. These abnormalities were undistinguishable from those that can be seen in patients with MS (fig1). Two patients with NSLE showed the same MS-like pattern, but they had additional features strongly suggesting a vascular aetiology (for example, a larger ischaemic lesion located in the frontal lobe). Eleven patients (two SLE, two NSLE, three WG, one BD, three APLA) had multiple, small hyperintense white matter lesions located at the cortical/subcortical junction; in one of them (affected by WG) a cerebellar hyperintense lesion was also visible, whereas in another patient with WG a possible aneurysmatic enlargement of the right posterior cerebral artery was detected. One patient with NSLE had the same pattern of small hyperintense lesions at the cortical/subcortical junction, plus a larger ischaemic lesion located in the left internal capsule/lenticular nucleus.

Axial PD weighted TSE (A, D, G), T2 weighted TSE (B, E, H), and postcontrast T1 weighted CSE (C, F, I) images of the brain obtained from patients with NSLE (A-C), WG (D-F), and RRMS (G-I) at the level just above the roof of the lateral ventricles. On PD/T2 weighted images several hyperintense lesions are visible in the discrete and subcortical white matter. The pattern of the abnormalities is similar for the three patients. However, fewer lesions can be seen on the images from the patient with WG (D, E)) than on those from the patients with MS or NSLE. On the T1 weighted images from the patients with MSLE (C) and MS (I) several areas of hypointense signal are also visible, suggesting the presence of a more severe white matter disruption. On T1 weighted images from the WG patient (F), no hypointense lesions are visible.
Two patients with SLE showed less relevant abnormalities—that is, few, small hyperintense lesions in the subcortical frontal lobe white matter and an isolated, small hyperintense lesion in the white matter of the left centrum semiovale, respectively.
Mean PD weighted total lesion volumes were 24.7 ml for patients with MS (range 3.5–58.4 ml), 0.2 ml for patients with SLE (range 0.0–1.5 ml), 6.0 ml for patients with NSLE (range 0.6–18.4 ml), 1.5 ml for those with WG (range 0.0–11.8 ml), and 0.1 ml for those with APLAS (range 0.0–0.4 ml). PD weighted total lesion volume was 0.4 ml for the only patient with BD with hyperintense lesions in the brain. PD weighted total lesion volume was significantly higher for MS than for any other patient subgroup (p<0.0001). Mean PD weighted total lesion volume was 1.1 ml (range 0.0–11.8 ml) for patients with NSID. It was significantly lower than that of patients with MS (p=0.004).
Multiple T1 weighted hypointense lesions were visible in all patients with MS. One patient with SLE, five with NSLE, one with BD, one with WG, and two with APLAS had at least one hypointense T1 weighted lesion; however, only four patients with NSLE and one patient with WG had two or more hypointense lesions. Gd enhancing lesions were found in 4/10 patients with MS; the median number of enhancing lesions per patient was 2.0 (range: 0–7). No enhancing lesions were visible in the scans of patients with SID.
MTI
Average lesion MTR (table 2) was significantly different among patient subgroups (ANOVA; p<0.0001). At post hoc analysis, patients with MS had significantly lower lesion MTR than patients with SLE or WG.Patients with NSLE had significantly lower lesion MTR than patients with SLE. Average lesion MTR was 40.6% (range: 39.1–42.4%) for patients with NSID. Average lesion MTR values were also significantly different between patients with NSLE or NSID and patients with MS (ANOVA; p=0.003). At post hoc analysis, patients with MS had significantly lower lesion MTR than those with NSID.
Brain MTI findings in 15 healthy controls, 10 patients with MS, and 44 patients with different types of SID
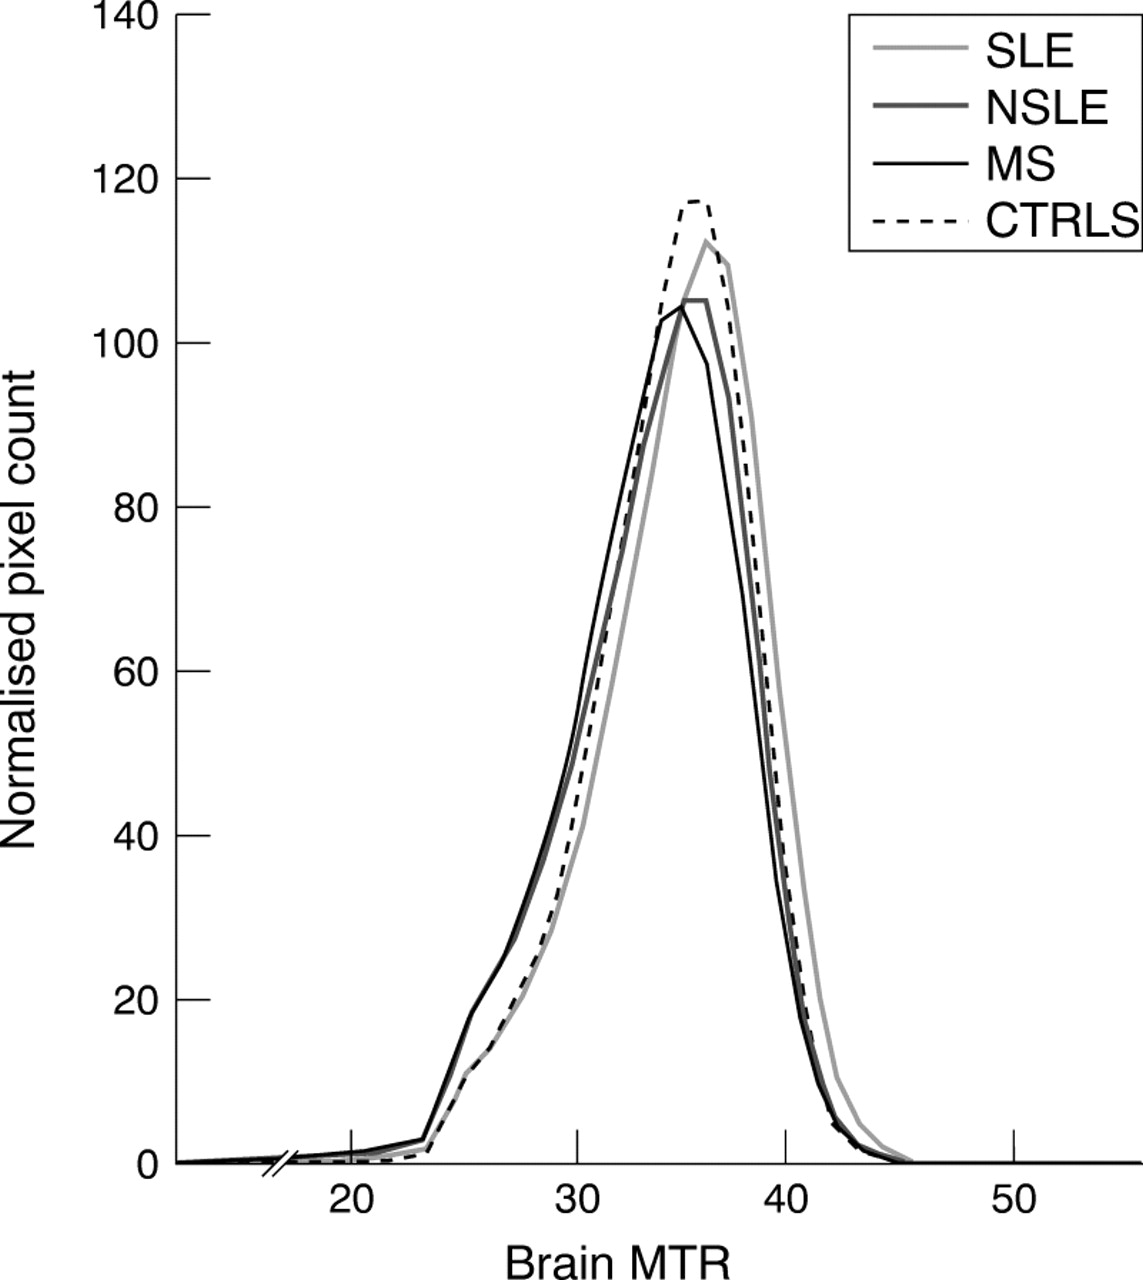
All the MTR histogram derived indices (table 2) were significantly different among patient subgroups (ANOVA; p values ranging from 0.005 to <0.0001). Fig 2 shows the MTR histograms of healthy controls, and patients with MS, SLE, or NSLE. At post hoc analysis, patients with MS had significantly lower average MTR, MTR50, and MTR75 than healthy controls, patients with SLE, WG, or BD and significantly lower peak height and location than healthy controls and patients with APLAS (peak height) or SLE (peak location) patients. MTR25 of patients with MS was significantly lower than that of healthy controls and patients with SLE, WG, BD, or APLAS. Patients with NSLE had significantly lower average MTR and MTR50than patients with SLE. MTR25 was significantly lower in patients with NSLE than in healthy controls and patients with SLE, WD, or BD. For the subgroup of 12 patients with NSID, mean values of MTR histogram derived parameters were the following: brain MTR=41.5% (range: 40.6–42.7), MTR25=32.4% (range: 32–34), MTR50=35.1% (range: 34–37), MTR75=37.3% (range: 36–39), peak height=115.6 (range: 90.3–133.0) and peak location=36.2 (range: 35–38). When comparing MTR histogram derived measures from patients with NSLE, NSID or MS, all the parameters but the histogram peak height were significantly different among the three subgroups (ANOVA; p values ranging from 0.009 to 0.0006). At post hoc analysis, patients with MS had significantly lower average MTR, MTR25, MTR50, MTR75 and histogram peak height than patients with NSID or NSLE and significantly lower MTR25 than patients with NSID. The same results were obtained when conducting the above analyses with metrics derived from the normal appearing brain tissue-MTR histograms (data not shown).

MTR histograms of whole brain tissue from healthy controls and patients with MS, SLE, or NSLE. The histogram shape is very similar for patients with MS or NSLE, whereas the MTR histogram of patients with SLE has a peak height and position which get closer to those of the histogram of healthy controls, For statistical analysis and results of group comparisons, see text.
MULTIVARIABLE ANALYSIS
Both PD weighted total lesion volumes and average lesion MTR fitted a model significantly separating (p=0.05 and 0.09, respectively) patients with MS from those with SID. Odds ratio values were 1.13 for PD weighted total lesion volumes and 0.68 for average lesion MTR, indicating a significantly higher risk of having MS with increasing total lesion volumes and decreasing lesion MTR values. This model was used to classify patients with abnormal brain MRI as MS or SID by applying a cut off value of 50% ( a patient was classified as SID or MS if the probability of having MS was less or more than 50%, respectively); 6/10 patients with MS (60%) and 21/23 patients with SID (91%) were correctly classified. Two patients with NSLE were misclassified as having SID and one of the misclassified patients with MS had a probability of having MS of 49%—that is, just below the cut off. No MRI or MTI derived variables significantly separated patients with MS as a group from patients with NSLE.
Discussion
Previous studies using conventional MRI techniques described several patterns of brain abnormalities in patients with SIDs, with or without clinical findings suggestive of CNS involvement.2-8 However, T2 weighted MRI abnormalities lack pathological specificity and, as a consequence, conventional MRI may not always be enough for a differential diagnosis between other immune mediated diseases and MS. In this study, we aimed at providing new insights about the different characteristics of CNS damage in SIDs and at identifying MRI measures potentially helpful for a differential diagnosis between other SIDs and MS.
We identified three different patterns of T2 weighted abnormalities, two with multiple MS-like or ischaemic lesions and one with isolated lesions. The first pattern closely resembles that of patients with MS and it was seen in about 30% of abnormal scans from patients with SIDs. These results suggest that, even after a careful morphological and regional analysis, in a relevant proportion of patients with conventional MRI abnormalities it is not possible to make a definitive differential diagnosis between MS and other SIDs based only on conventional MRI findings. This is mainly true for patients with NSLE, as 50% of them showed multiple white matter lesions resembling those suggestive of MS. The results of the quantitative assessment of total lesion volumes from PD weighted images demonstrated that a higher lesion burden is more typical for patients with MS and, to a lesser extent, it is also useful to distinguish patients with NSLE from the other categories of SIDs. Clearly, this is not relevant for diagnosis in individual patients, but it suggests that, similarly to MS,18 the assessment of total lesion volumes might be used as a reliable paraclinical marker of disease evolution in patients with NSLE.
White matter areas of hypointensity on unenhanced T1 weighted scans from patients with MS correspond to lesions with more severe demyelination and axonal loss.42 The proportion of hypointense lesions is significantly lower in cerebrovascular diseases than in MS,43 where it is about 20%-30%.44Our findings confirm that only a minority of patients with SIDs show hypointense T1 weighted lesions corresponding with T2 weighted abnormalities. Again, the frequency of T1 weighted abnormalities is higher in NSLE (about 50% of patients) than in any other SIDs. This suggests that T1 weighted scans may be useful for diagnostic purposes, in the sense that the presence of no or few hypointense lesions should increase the confidence in making a diagnosis of SIDs apart from NSLE.
Enhancing MS lesions on postcontrast T1 weighted scans are characterised by blood-brain barrier disruption and associated inflammation.45 In this study, the frequency of patients with MS with one or more enhancing lesions is that expected on the basis of large scale natural history studies.18 No enhancing lesions were visible in any patient with SIDs. This can be due to the different disease courses of MS and other SIDs: in the first condition, subclinical activity is almost continuous and the frequency of enhancement on MRI can be up to 10 times higher than that of clinical relapses.46 In SIDs, the development of new lesions seems to be more strictly correlated with acute events suggestive of CNS dysfunction and more rarely they occur in the absence of clinical activity.10 Another explanation for this finding lies in the relevant number of patients with SIDs who were undergoing steroid and/or immunosuppressive treatment at the time of the study.
Average lesion MTR was lower in MS and in NSLE than in any other SIDs. These results support the hypothesis that only a persistent and severe damage of brain parenchyma leads to clinical CNS dysfunction in patients with SLE, thus resembling what happens in patients with MS. The average lesion MTR reductions we found in patients with MS or NSLE cannot be attributed to potentially reversible changes in acute enhancing lesions,47 as none of them were detected in patients with NSLE and only very few of the MS lesions were enhancing at the time of the study.
Whole brain and normal appearing brain tissue MTR histogram derived measures were not significantly different between healthy controls and patients with SLE, BD, WG, or APLAS, whereas the metrics from both the MTR histograms were the lowest in patients with MS or with NSLE. Although these histogram changes are due to the larger amounts of macroscopic lesions in the last two conditions, they also indicate that the microscopic damage of the normal appearing brain tissue is relevant in patients with MS or NSLE and negligible in other SIDs, despite the presence of brain T2 lesions or clinical findings suggestive of CNS involvement. Some studies48 49 have already reported that patients with NSLE with non-focal psychiatric symptoms more often show a pattern of diffuse brain MRI abnormalities and have higher titres of antineurofilament antibodies than those with focal CNS disturbances. Although these findings have not been confirmed by recent studies,11 they suggest that, in NSLE, brain damage might also be immune mediated by antibodies against widespread brain tissue components, thus possibly resulting in a diffuse, microscopic pathology.
Previous studies50 in patients with MS reported that MTR histogram derived measures are significantly correlated with both the macroscopic T2 lesion burden and the degree of brain atrophy. Because in both patients with MS51 and patients with SLE,12 the degree of brain atrophy correlates well with the presence and severity of neurological impairment, MTI might be able to provide an accurate and global estimation of disease burden in either disease categories. Although MTI studies already suggested that microscopic damage in the normal appearing white matter is an important contributor to the neurological disability in patients with MS,23 the value of MTR histogram derived measures for NSLE assessment still needs to be evaluated with longitudinal studies in larger patient samples.
Both PD weighted total lesion volumes and average lesion MTR fitted a multivariable model significantly separating MS from the group of SIDs. Using this model, more than 90% of the patients with SIDs were classified correctly. Admittedly, our sample of patients with MS included four cases of secondary progressive disease and, clinically, this condition is more easily distinguishable from SIDs than relapsing-remitting MS. However, MRI indices do not provide any clear cut distinction between relapsing-remitting and secondary progressive MS18 and, as a consequence, we do not think that the diagnostic model proposed here is likely to change when considering only patients with relapsing-remitting MS. The combination of conventional MRI and MTI changes might, therefore, be used to increase the diagnostic confidence, when systemic features of SIDs are absent or not enough for a firm diagnostic conclusion. As already pointed out, conventional MRI and MTI findings from NSLE strongly resemble those from MS. Thus, the differential diagnosis between these two conditions has to rely upon a combination of clinical, neuroradiological, and neuroimmunological markers. However, conventional and non-conventional MRI might be more useful to assess the dynamics of the two diseases, as MRI and MTI findings in NSLE might follow a different evolution than in MS.
Admittedly, our results might have been biased by the relatively low numbers of patients studied for each type of disease and should be confirmed by large scale, longitudinal studies on individual disease groups. However, the following conclusions can already be drawn: (a) the extent and severity of macroscopic and microscopic brain pathology is significantly higher in MS and NSLE than in any other SID, and (b) MTI is promising for increasing the degree of confidence when making a differential diagnosis between MS and other SIDs.
Acknowledgments
We thank Mr Clodoaldo Pereira for helping us in collecting MR scans and Dr Maria Pia Sormani for her support in the statistical analysis.