Article Text

Abstract
OBJECTIVE To assess the feasibility of a new technique based on diffusion anisotropy to segment white and grey matter of the brain. To use this technique to measure the mean diffusivity (D̄) and magnetisation transfer ratio (MTR) of normal appearing white matter (NAWM) and grey matter (NAGM) from patients with multiple sclerosis.
METHODS Dual echo turbo spin echo, MT, and diffusion weighted scans of the brain were obtained from 30 patients with multiple sclerosis and 18 sex and age matched healthy controls. After image coregistration and removal of T2 visible lesions, white and grey matter were segmented from 10 supratentorial slices using diffusion anisotropy thresholds. Histograms of the average MTR and D̄ were created for normal white and grey matter of controls and NAWM and NAGM of patients with multiple sclerosis.
RESULTS All the MTR histogram derived metrics of the NAWM from patients with multiple sclerosis were significantly lower than those of white matter from controls. The peak height of the D̄histogram of NAWM from patients with multiple sclerosis was also significantly different from that of normal white matter. The average MTR, the peak location of the MTR histogram, and peak height of theD̄ histogram of the NAGM of patients with multiple sclerosis were significantly lower than the corresponding quantities of grey matter from controls.
CONCLUSIONS A technique was developed for segmenting white and grey matter with the potential for improving the understanding of the pathophysiology of many neurological conditions. Its application to the study of multiple sclerosis confirms the presence of a diffuse tissue damage in the NAWM of these patients and suggests that subtle changes also occur in the NAGM.
- magnetisation transfer ratio
- white matter diffusity
- grey matter diffusivity
- multiple sclerosis
Statistics from Altmetric.com
In multiple sclerosis, conventional T2 weighted MRI has proved to be sensitive for detecting lesions and their changes over time.1 However, it has limitations. These include the inability to detect subtle abnormalities in the so called normal appearing white matter (NAWM)2 and lesions located in the grey matter.3 Other MR techniques, such as magnetisation transfer imaging (MTI) and diffusion weighted imaging (DWI), have the potential to overcome these limitations.
Magnetisation transfer imaging is based on the interactions between protons in a relatively free environment and those where motion is restricted. In the brain; these two states correspond to the protons in tissue water, and in the macromolecules of myelin and cell membranes. Off resonance irradiation is applied, which saturates the magnetisation of the bound protons, but this is transferred to the mobile protons, thus reducing the observable signal intensity. The degree of signal loss depends on the density of the macromolecules in a given tissue. Thus, low MT ratio (MTR) indicates a reduced capacity of the macromolecules in brain tissue to exchange magnetisation with the surrounding water molecules, reflecting damage to myelin or to the axonal membrane. Recent studies have shown that low MTR correlates with histopathological findings of myelin and axonal loss.4 5
Diffusion weighted imaging provides a unique form of MR contrast that enables the diffusional motion of water molecules to be measured and, as a consequence of the interactions between tissue water and cellular structures, provides information about the orientation, size, and geometry of brain structures.6 In biological systems, molecules are generally confined in a finite region of space by partially permeable barriers that hinder diffusion and lead to a situation where the diffusion coefficient is always lower than that of free water and is, therefore, called the apparent diffusion coefficient (ADC). Because some cellular structures, such as axons, are aligned on the scale of an image pixel, ADC is also dependent on the measurement direction. A full characterisation of diffusion can be achieved in terms of a tensor,7 a 3×3 matrix which accounts for the correlation existing in anisotropic media between molecular displacement along one direction, and the displacement along orthogonal directions. From the tensor, it is possible to derive some indices that are invariant to changes of the frame of references. These indices include the mean diffusivity (D̄=1/3 of the trace of the tensor) and the fractional anisotropy (FA).8 9 The second represents the most robust measure of anisotropy.9 The ADC,10 11 D̄, 12-15and FA14 have all been found to be significantly changed in lesions and NAWM of multiple sclerosis compared with normal white matter.
In the normal brain, grey matter and white matter have different diffusion characteristics. In grey matter, diffusion is isotropic when averaged on a voxel scale, whereas it is extremely anisotropic in white matter due to the directionality of the myelin fibre tracts.16 It is therefore conceivable that a technique based on an index of diffusion might accurately segment white matter and grey matter of the brain. In this study, we assessed the feasibility of such an approach, using FA as a measure of deviation from isotropy. We also used this segmentation technique to measure MTR and D̄ of the NAWM and the normal appearing grey matter (NAGM) from patients with multiple sclerosis to improve our understanding of the complex mechanisms leading to the heterogeneous manifestations of the disease.
Patients and methods
PATIENTS
We studied 30 consecutive patients with clinically definite multiple sclerosis17 (18 women and 12 men, mean age 38.4 years, range 23–57 years). Their median expanded disability status scale (EDSS) score18 was 3.0 (range 0.0–7.0) and their median duration of the disease was 7 years (range 1–16 years). Eighteen healthy volunteers (10 women and eight men, mean age 37.8 years, range 22–56 years) served as controls. Local ethics committee approval and written informed consent from all the subjects were obtained before study initiation.
IMAGE ACQUISITION
All imaging was performed using a 1.5 T scanner (Siemens Vision, Erlangen, Germany). The following sequences were obtained without moving the subjects from the scanner: (a) dual echo turbo spin echo (TSE) (TR=3300, first echo TE=16, second echo TE=98, echo train length=5); (b) two dimensional gradient echo (GE) (TR=640, TE=12, flip angle=20º), with and without an off resonance radiofrequency (RF) saturation pulse (offset frequency=1.5 kHz, gaussian envelope duration=7.68 ms, flip angle=500º); (c) pulsed gradient spin echo echo planar pulse sequence (interecho spacing=0.8, TE=123), with diffusion gradients applied in nine non-collinear directions, chosen to cover three dimensional space uniformly.19 The duration and maximum amplitude of the diffusion gradients were respectively 25 ms and 21 mTm−1, giving a maximum b factor in each direction of 1044 smm−2. To optimise the measurement of diffusion only two b factors were used20(b1≈0, b2=1044 smm−2). Fat saturation was performed using a four RF binomial pulse train to avoid chemical shift artifact. A birdcage head coil of ∼300 mm diameter was used for signal transmission and reception.
For the dual echo and MT scans, 24 contiguous interleaved axial slices were acquired with 5 mm slice thickness, 256×256 matrix and 250×250 mm field of view. The slices were positioned to run parallel to a line that joins the most inferoanterior and inferoposterior parts of the corpus callosum.21 For the DW scans, 10 slices 5 mm thick were acquired, with the same orientation of the dual echo scans, positioning the second last caudal slice to match exactly the central slices of the dual echo and MT sets. This brain portion was chosen as the periventricular area is a common location for multiple sclerosis lesions. In addition, these central slices are less affected by the distortions due to B0 field inhomogeneity, which can affect image coregistration. A 128×128 matrix and 250×250 mm field of view were used. The manufacturer's own phase correction and regridding algorithm was used before Fourier transformation and interpolation to a 256×256 image matrix.
IMAGE ANALYSIS AND POSTPROCESSING
All postprocessing was performed on a workstation (Sun Sparcstation, Sun Microsystems, Mountain View, CA, USA) independent from the scanner. The two GE scans, with and without the saturation pulse, were coregistered by using a surface matching technique based on mutual information.22 Then, MTR images were derived pixel by pixel according to the following equation: MTR=(M0−MS)/M0×100%, in which M0 is the signal intensity for a given pixel without the saturation pulse and MS is the signal intensity for the same pixel when the saturation pulse is applied. Finally, extracerebral tissue (including CSF) was removed from MTR maps using a local thresholding technique23 and coregistered with the b=0 step of the diffusion weighted images using the same technique as above.22 For the subsequent analysis, only the 10 supratentorial slices corresponding to the DW set of images were considered.
The DW images were first corrected for distortion induced by eddy currents using an algorithm which minimises mutual information between the diffusion unweighted and weighted images.22 Then, assuming a monoexponential relation between signal intensity and the product of the b matrix and diffusion tensor matrix components, the diffusion tensor was calculated for each pixel according to the following equation:

where M is the measured signal intensity, M0 is the T2 weighted signal intensity, bij are the elements of the b matrix (a 3×3 matrix which expresses the relation between the signal attenuation and the elements of the diffusion tensor matrix) and Dij are the elements of the diffusion tensor matrix. The tensor was estimated statistically, using a non-linear fitting of the data, according to the Marquardt-Levenberg method. After diagonalisation of the matrix, D̄ and FA were derived for every pixel. Extracerebral tissue was removed fromD̄ maps as described for MTR maps.23
Two experienced observers, unaware to whom the scans belonged, identified by consensus the multiple sclerosis lesions on the proton density weighted images and marked them on the hard copies. T2 weighted images were always used to increase confidence in lesion identification. Then, multiple sclerosis lesions were outlined on the b=0 step of the diffusion weighted images (T2 weighted, but diffusion unweighted) using a semiautomated technique based on local thresholding and the marked hard copies as a reference.23 The following step consisted of automatic transferral of multiple sclerosis lesion outlines onto the MTR, D̄, and FA maps, which were aligned exactly with the b=0 step of the diffusion weighted images. The areas on D̄ and FA maps corresponding to macroscopic multiple sclerosis lesions were nulled out. At the end of this process MTR andD̄ maps from patients with multiple sclerosis were constituted only by NAWM and NAGM and those from controls by white and grey matter.
The segmentation of white and grey matter was obtained using “conservative” FA thresholds. Based on the different architectural characteristics of white and grey matter, we assumed that pixels with FA values above a certain threshold were likely to represent white matter, whereas those with FA values below another threshold were likely to be a part of grey matter. A single experienced observer measured average brain white and grey matter FA by placing 3.5 mm2regions of interest (ROIs) bilaterally in four white matter (internal capsule, genu of the corpus callosum, centrum semiovale, and subcortical white matter of the frontal lobe) and in four grey matter (putamen, head of the caudate nucleus, thalamus, and grey matter of the frontal lobe) areas of the brain from all controls. As shown in figure1, the overlap between FA values of white and grey matter was modest. White matter was segmented by applying an FA threshold=average white matter FA minus 1 SD (this value was 0.20). Grey matter was segmented by applying an FA threshold=average grey matter FA plus 1 SD (this value was 0.17). Then, the same pixels were selected automatically from the coregistered MTR and D̄ maps. Figure 2 is a typical example of the application of this segmentation procedure on an image from a normal subject.

Mean and percentile distributions of the FA values of white matter (WM) and grey matter (GM) from healthy volunteers. The boundaries of the boxes represent the 25th and the 75th percentiles, the upper and lower bars represent the smallest and largest observations that are lower than one interquartile range from the edges of the box.

Example of the white matter/grey matter segmentation procedure in a normal subject. On the top row, (A) axial images of the fractional anisotropy (FA), (B) magnetisation transfer ratio (MTR) and (C) mean diffusivity (D̄) maps before segmentation. In (D) the white matter mask obtained by applying an FA threshold=0.20 is shown. On the same row, (E) there are the MTR and (F) D̄ maps after the application of the white matter mask. In (G) the grey matter mask obtained by applying an FA threshold=0.17 is shown. On the same row, there are (H) the MTR and (I) D̄ maps after the application of the grey matter mask. For further details see text.
MTR and D̄ characteristics of NAWM and NAGM from patients with multiple sclerosis and of white and grey matter from controls were studied using histogram15 24 and ROI analysis. MTR and D̄ histograms were created as previously described.15 To correct for the between subject differences in brain volume each histogram was normalised by dividing the height of each bin by the total number of pixels contributing to the histogram. For each histogram, the following measures were derived: the relative peak height (the proportion of pixels at the most common MTR and D̄value), the peak position (the most common MTR andD̄ values), and the average MTR andD̄. ROI analysis, performed as follows. Firstly, a single experienced observer placed 3.5 mm2 ROIs on the same areas on T2 weighted scans from controls and patients (these areas were selected carefully to avoid partial volume effects from the surrounding tissue). The ROIs were placed bilaterally in areas close to the anterior and posterior parts of the body of the lateral ventricles, in the genu and splenium of the corpus callosum, internal capsule, centrum semiovale, putamen, head of the caudate nucleus, thalamus, and cortical grey matter of frontal, temporal, parietal, and occipital lobes. Secondly, the outlined regions were superimposed onto the coregistered MTR and D̄ maps and the average MTR and D̄ of all the ROIs calculated.
STATISTICAL ANALYSIS
A two tailed Student's t test for non-paired data was used to compare (a) MTR and D̄ histogram derived metrics of the NAWM and NAGM from patients with the corresponding quantities of the white and grey matter from controls; and (b) the average MTR and D̄ of the ROIs placed in NAWM and NAGM from patients with those of white and grey matter from controls. Univariate correlations were assessed using the Spearman rank correlation coefficient. To reflect the relatively large numbers of comparisons and to avoid type II errors, a p value⩽0.01 was considered statistically significant, a p value between 0.01 and 0.05 as a significant trend, and p values>0.05 were not considered significant.
Results
No abnormalities were found on any of the scans from the controls. In patients with multiple sclerosis, average T2 lesion volume was 15.3 ml (SD 9.8 ml). In controls, the average white matter volume segmented from the 10 supratentorial slices was 311.1 (SD 29.8) ml, and the average grey matter volume was 247.7 (SD 29.5) ml. In patients with multiple sclerosis, the average NAWM volume was 273.4 (SD 40.6) ml, and the average NAGM volume was 205.9 (SD 38.1) ml. Grey matter volumes measured in patients were significantly lower than those from controls (p=0.001). No statistical comparison was performed for white matter volumes, as, in patients, macroscopic multiple sclerosis lesions were removed before white/grey matter segmentation. As a consequence, the volume of NAWM from patients was inevitably lower than that of white matter from controls.
Mean (SD) MTR and D̄ histogram derived metrics of NAWM and NAGM from controls and patients with multiple sclerosis
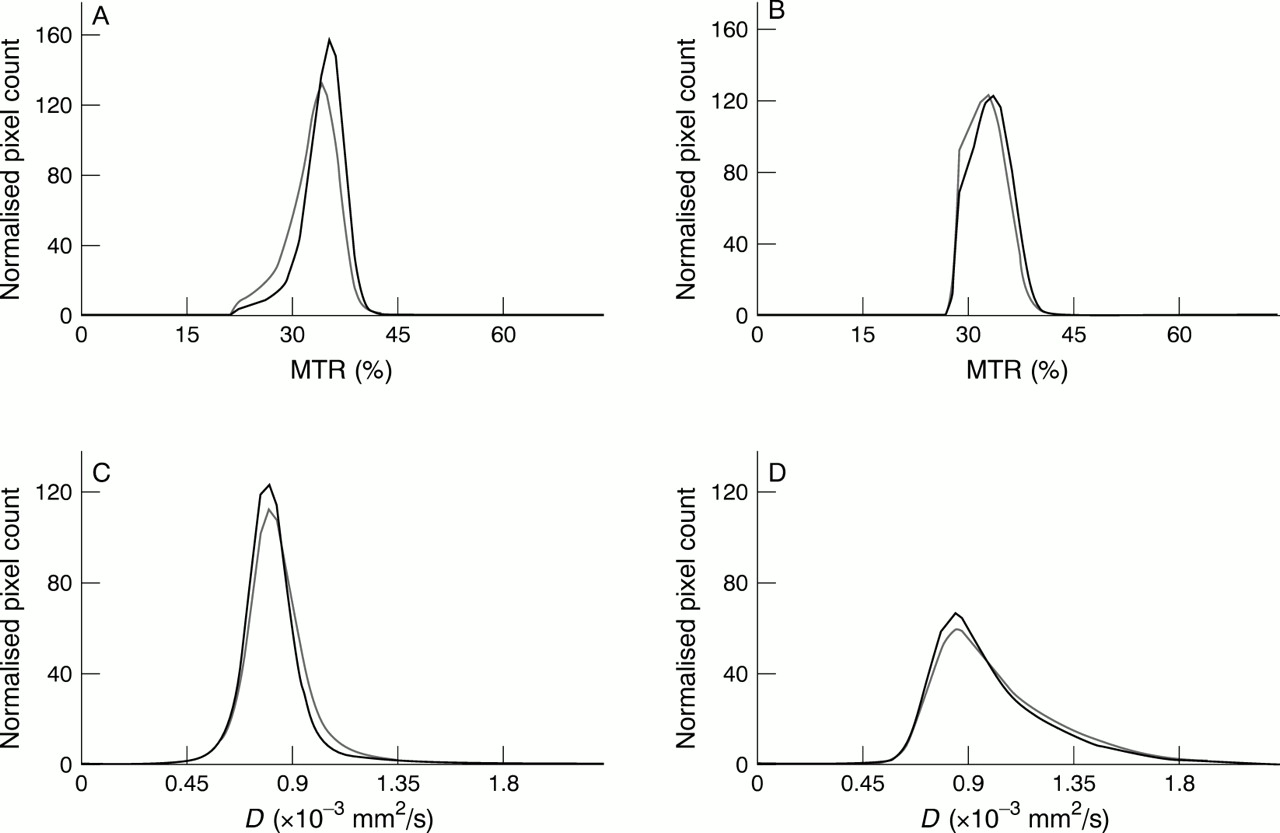
In the table, the means (SD) of the MTR andD̄ histogram derived metrics of NAWM and NAGM are reported for controls and patients. Average MTR andD̄ histograms of NAWM and NAGM from patients and controls are reported in fig 3. The MTR andD̄ values for the image pixels of all the subjects within each group were pooled before the histograms were formed As a consequence, these average histograms do not necessarily show the same trends as the statistics presented in the table, because the average histograms also reflect heterogeneity within the populations of the two groups. The average MTR values and peak locations of the NAWM and NAGM histograms were significantly lower in patients with multiple sclerosis than in controls (p values ranging from 0.001 to 0.005). For the NAWM, the peak height of the MTR histograms from patients was also significantly lower than that from controls (p=0.002). The peak height of theD̄ histograms from the control group was higher in both white and grey matter (p=0.007 and p=0.01 respectively); the average D̄ from controls also showed a significant trend to be higher in patients (p=0.04) for both NAWM and NAGM. Moderate correlations were found between T2 lesion volumes and the peak height of the NAGM-MTR histogram (r=−0.5, p=0.01) and average NAGM-D̄(r=0.4, p=0.04).

Magnetisation transfer ratio (MTR) and mean diffusivity (D̄) histograms of the normal appearing white (NAWM) and grey (NAGM) matter from patients with multiple sclerosis (grey line) and controls (black line). (A and B) are the NAWM-MTR and NAGM-MTR histograms. (C and D) show the NAWM and NAGM-D̄histograms.
Using MTR values obtained from the ROI analysis, the mean MTR of the white matter was 42.4% (SD 2.0%) for controls and 41.1% (SD 2.2%) for patients with multiple sclerosis (p<0.001). For grey matter, the mean MTR values obtained from ROI analysis were 39.5 (SD 2.4)% for controls and 38.2 (SD 3.1)% for patients with multiple sclerosis (p=0.001). The mean D̄(×10−3) values of ROIs in white matter were 0.789 (SD 0.08) mm2/s for controls and 0.810 (SD 0.09) mm2/s for patients with multiple sclerosis (p=0.03). The mean D̄ of grey matter from controls was 0.911 (SD 0.20) mm2/s. It was significantly lower than that from patients with multiple sclerosis (D̄=1.005 (SD 0.29) mm2/s, p=0.004).
Discussion
In this study, we assessed the feasibility of an objective technique based on tissue diffusion characteristics for segmenting white and grey matter of the brain. The segmentation process we developed uses FA thresholds, which allow separation of tissues with different architectural properties. Grey matter has a random microstructure and, as a consequence, the same self diffusivity in all spatial directions (at least on a MR voxel scale). On the contrary, white matter has a highly ordered microstructure and, therefore, water diffusion in white matter is anisotropic (protons are more free to move along a direction parallel to the white matter tracts than along a direction orthogonal to them). Admittedly, there is some overlap of FA values of white and grey matter and this inevitably results in a misclassification of some pixels. However, this overlap is just marginal and by applying conservative FA thresholds, as we did in the present study, the risk of pixel misclassification is markedly reduced at the price that some pixels are excluded from the two segmented sets. Nevertheless, this is likely to be less of an issue when comparing two groups of subjects (for instance, in parallel group clinical trials) or the same group of patients over time (for example, in cross over clinical trials). In addition, technical upgrade leading to better signal to noise ratios and increased spatial resolution should result, in the near future, in more precise white/grey matter segmentation using FA thresholds. Another advantage of this technique is that only minor human intervention is needed. This is limited to the removal of extracranial tissues using a highly reproducible semiautomated thresholding technique.23
The ability to segment white/grey matter of the brain using a reliable technique based on a quantitative index of tissue organisation has the potential to be applied in the assessment of many neurological conditions, including degenerative or inflammatory demyelinating conditions. In the present study, we used this approach to assess the MT and diffusion characteristics of NAWM and NAGM in patients with multiple sclerosis. This was done using the MTR andD̄ histogram analysis,15 24 which allows the assessment of the MTR andD̄ values from all the pixels included in the analysis, thus avoiding the possible sample bias associated to ROI analysis.
The main result of this study is the detection of reduced MTR and increased D̄ values in the NAGM from patients with multiple sclerosis. This indicates that brain grey matter is not spared by the multiple sclerosis pathological process. There is a large body of evidence25 suggesting that reduced MTR values in multiple sclerosis are associated with loss of tissue integrity. Similarly, an increased D̄suggests net loss of structural barriers to water molecular motion.6 One explanation of these findings might be the presence of a certain amount of discrete multiple sclerosis lesions in the grey matter of our patients. Grey matter lesions are usually missed on conventional T2 weighted imaging because they are usually small,3 have relaxation characteristics which result in poor contrast between them and normal grey matter and, in the case of cortical lesions, because of partial volume effects with surrounding CSF. On the contrary, previous postmortem studies3 26 27showed that lesions are relatively frequent in the cerebral grey matter of patients with multiple sclerosis. Brownell and Hughes26in a series of 32 cases found that 17% of the hemisphere lesions were at the leucocortical junction, 5% within the cerebral cortex, and 4% in the central grey matter. Lumdsen27 detected variable numbers of multiple sclerosis lesions (from only a few to 465) within the cerebral cortex of 93% of the 60 cases studied. Kiddet al 3 detected 478 cortical lesions at postmortem examination of 12 cases. These findings agree with in vivo studies showing that fast fluid attenuated inversion recovery28 29 or gadolinium enhanced25 30scans enable more grey matter lesions to be detected than conventional T2 weighted scans. An alternative, but not mutually exclusive, explanation of the MTR and D̄ changes we found might be wallerian degeneration of grey matter neurons secondary to the damage of fibres transversing white matter lesions in multiple sclerosis. That wallerian degeneration may have a role in explaining NAWM changes in multiple sclerosis is supported by the correlations found between T2 lesion volume and MTR andD̄ histogram derived metrics of NAGM.
Whatever the pathological mechanism leading to reduced MTR and increased D̄ in NAGM from patients with multiple sclerosis, the presence of damaged grey matter tissue in multiple sclerosis fits well with the frequent demonstration of cognitive impairment in patients with multiple sclerosis.31 32 Previous studies showed that MTR changes in the normal appearing brain tissue (NAWM and NAGM together)33 and the presence of U fibre lesions,34 which are known to often extend into the cortical grey matter,3 are correlated with cognitive decline in multiple sclerosis. Our segmentation technique based on FA thresholds should make possible the assessment of the relative contributions of white and grey matter damages to the cognitive deficits of patients with multiple sclerosis.
As it has been reported that FA of NAWM from patients with multiple sclerosis is significantly reduced compared with that of white matter from controls,14 our white/grey matter segmentation technique based on FA thresholds might have classified, in patients with multiple sclerosis, as grey matter pixels, pixels actually belonging to diseased subcortical white matter. Another potential problem with this technique is that in patients, due to the presence of brain atrophy,35 more pixels with a significant partial volume effect from the CSF might have been introduced in the patients' grey matter pool, thus contributing to reducing MTR and increasingD̄ values. These were the reasons why we decided to assess MTR and D̄characteristics of NAWM and NAGM from patients with multiple sclerosis also using an ROI analysis. We placed relatively small ROIs in several anatomical locations and avoided carefully any contamination from tissues different from that in analysis. Findings from ROI analysis confirmed that NAGM from patients with multiple sclerosis has lower MTR and higher D̄ values than grey matter from controls. That our segmentation technique worked properly in separating grey from white matter is also shown by the finding that the mean ratios of pixels attributed to NAGM versus those attributed to NAWM were 0.76 and 0.80 in patients with multiple sclerosis and controls respectively (this difference was not statistically significant).
Our results showing that NAGM from patients with multiple sclerosis has different MTR values than the grey matter from controls disagree with those from previous studies.36 37 This could be for two reasons. Firstly, postmortem studies showed that the amount of grey matter lesions is highly variable from patient to patient.3 27 Thus, considering the relatively few patients previously studied,36 37 it is not surprising that different results may be achieved. Secondly, we avoided sample bias by using MTR and D̄ histogram analysis, which took into consideration all the grey matter pixels from all the subjects. This was not the case for previous studies,36 37 which only performed an ROI analysis. Methodological considerations can also explain the different results between our ROI analysis and the previous ones.36 37 In previous studies, there is no mention of the size of the ROIs used. This is critical, as relatively large ROIs have a greater likelihood of being contaminated incidentally by CSF, and this would significantly bias the measurements. In addition, compared with the other studies,36 37 we analyzed more anatomical regions and, particularly, more cortical regions. This is again critical considering the high within and between patient variabilities in lesion locations and the larger amount of lesions found in the cerebral cortex than that found in the deep grey matter of patients with multiple sclerosis.26
Finally, our study confirms previous findings of MTR andD̄ changes in the NAWM of patients with multiple sclerosis.2 11-15 33 38-40 The merit of this study is, however, that a large portion of the NAWM in isolation has been studied. Previous studies have used either ROI analysis11-15 38 39 or considered together NAWM and NAGM.33 40 Subtle changes are known to occur in the NAWM from patients with multiple sclerosis, including diffuse astrocytic hyperplasia, patchy oedema, perivascular infiltration, gliosis, abnormally thin myelin, and axonal loss.2 All of these can modify the relative proportions of free and bound water as well as the amount of “restricting” barriers present in the white matter, thus influencing its MT and D̄characteristics.
Acknowledgments
This study was supported by a grant from MURST.