Article Text

Abstract
Objective: To examine 11C-methyl methionine (MET) accumulation on positron emission tomographic (PET) imaging of glioblastoma multiforme to determine the distribution of metabolic abnormality compared with magnetic resonance imaging (MRI).
Methods: Contemporaneous MRI was superimposed on corresponding MET-PET images in 10 patients with newly diagnosed glioblastoma multiforme before treatment. Differences between the extended area of MET accumulation on PET imaging (MET area), the gadolinium (Gd) enhanced area on T1 weighted images (Gd area), and the abnormal high signal intensity area on T2 weighted images (T2-high area) were assessed.
Results: The MET area was larger than the Gd area and included the entire Gd area. The discrepancy in volume between the MET and Gd areas became greater with increasing tumour diameter. On average, 58.6% of the MET area was located within the Gd area, 90.1% within 10 mm outside the Gd area, 98.1% within 20 mm, and 99.8% within 30 mm. A newly developed Gd area had emerged in five of the 10 cases up to the time of study. In three of the five cases this was in the MET area even after complete surgical resection of the Gd area on the initial MRI; in the remaining two it originated in the residual Gd area after surgery. In all cases, the T2-high area was larger than the MET area. The MET area extended partly beyond the T2-high area in nine cases, and was completely within it in one.
Conclusions: Glioblastoma multiforme cells may extend over the Gd area and more widely with increasing tumour size on Gd-MRI. The T2-high area includes the greater part of the tumour but not its entire area. The methods reported may be useful in planning surgical resection, biopsy, or radiosurgery.
- positron emission tomography
- methionine
- tumour invasion
- glioblastoma multiforme
- magnetic resonance imaging
Statistics from Altmetric.com
- positron emission tomography
- methionine
- tumour invasion
- glioblastoma multiforme
- magnetic resonance imaging
Malignant gliomas remain a formidable therapeutic challenge because of their invasive characteristics. It is the motile invading cells from these tumours, which cannot be surgically extirpated, that are responsible for recurrence of the tumour following radical resection.1 Currently, anatomical imaging achieved by magnetic resonance imaging (MRI) is the most widely accepted method of determining the target for treatment in malignant glioma. The region of gadolinium (Gd) enhancement is considered to correspond well with the main tumour mass. However, delineating the “true” extension of neoplastic cells into the adjacent brain regions has been a difficult task, because glioma cells are commonly found beyond the enhanced portion of the tumour, particularly in glioblastoma multiforme.2–9
The use of positron emission tomography (PET), an imaging technique providing metabolic data, plays an important role in improving diagnostic procedures in the management of malignant glioma. In PET studies, 11C-methyl methionine (MET) is the most widely used amino acid for brain tumour evaluation. The uptake of MET is accelerated in tumours compared with normal brain tissue10,11; thus MET-PET scanning appears to be a valuable tool for defining the boundaries of malignant gliomas. Previous PET studies have reported that MET-PET allows earlier and more accurate delineation of tumour extension than anatomical imaging, such as computed tomography or MRI alone.12–15
In this study, we analysed MET accumulation on PET imaging to determine the distribution of metabolic abnormality in glioblastoma multiforme, and this distribution was compared with the abnormal signal intensity of the tumour on MRI, to evaluate the discrepancy between lesion distributions yielded by these two methods.
METHODS
Patient population
Ten patients with newly diagnosed glioblastoma multiforme were studied. Metabolic activity was examined using MET-PET before treatment. In all cases, MRI was carried out at the time of PET imaging, and a pathological diagnosis was made from a tumour specimen obtained during surgery. The investigation was approved by the clinical research committee of our university, and informed consent was obtained from each patient.
PET methods
PET was undertaken with an Advance NXi imaging system (General Electric Medical Systems, Hino-shi, Tokyo, Japan), which provides 35 transaxial images with 5.0 mm intervals. The in-plane spatial resolution (full width at half maximum) was 4.0 mm. Patients were placed in the PET scanner so that slices were parallel to the canthomeatal line. Immobility was checked by alignment of three laser beams with lines drawn on the patient’s face. After a seven minute transmission scan had been obtained, a dose of 370 to 550 MBq (10–15 mCi) of MET was injected intravenously into the cubital vein within one minute. A 10 minute static PET scan was begun 20 minutes after the MET injection. No arterial blood samples were obtained.
MRI methods
A 1.5 T MRI system (Signa Horizon LX; General Electric, Waukesha, Wisconsin, USA) was used to obtain transaxial T1 weighted fast spin echo images (repetition time (ms)/echo time (ms)/number of excitations = 700/10/2) and T2 weighted fast spin echo images (4000/102/2) (FOV 24×24 cm, matrix size 512×256). Slice thickness was 6 mm, with a 3 mm slice gap. For contrast enhancement studies, 0.1 mmol/kg body weight of Gd was injected intravenously.
Data analysis
The maximum tumour diameter was defined as the maximum diameter of the area of Gd enhancement on a T1 weighted image (Gd area). The area of increased MET accumulation on PET (the MET area) was defined as the region of an accumulation of MET apparently higher than that of normal grey matter in the occipital lobe, assessed by qualitative visual analysis. The PET and MRI datasets were transferred to a SUN workstation (SPARC MP20; SUN Microsystems, Mountain View, California, USA). Co-registration of MET-PET and MRI was undertaken on the SUN workstation with a commercial software package (Dr View; Asahi Kasei Joho System, Tokyo, Japan), using a method described by Kapouleas and colleagues.16 Co-registered images provide 35 transaxial slices at 5.0 mm intervals. The size of the area in each slice was automatically calculated using the same software package.
Over the co-registered images, we drew seven lines which outlined the Gd area and 5 mm, 10 mm, 15 mm, 20 mm, 25 mm, and 30 mm beyond the Gd area, in all transaxial slices in which a Gd area was revealed (fig 1). In each slice, we measured the size of the MET area involved within each outline. Measurements were made by manually outlining the margins of the MET area. The sum of the size of the MET area in each slice was counted, and the size occupation ratio (SOR), accounting for all of the MET area within each outline, was calculated. The SOR was determined using the following equation:

Co-registered 11C-methyl methionine–positron emission tomography (MET-PET) images and gadolinium (Gd) enhanced T1 weighted magnetic resonance images. Red indicates the MET areas. Upper panel: all transaxial images in which the Gd area was demonstrated. Lower panel: a representative transaxial image with white lines which outline the Gd area, and 5 mm, 10 mm, 15 mm, 20 mm, 25 mm, and 30 mm beyond the Gd area.
SOR (%) of MET area within x mm outside the Gd area = sum of the size of the MET area within x mm outside the Gd area in each slice/sum of the size of the MET area in each slice.
In addition, the distance beyond the Gd area (the MET distance) at which more than 98% of the MET area was occupied was assessed in all cases. We compared the maximum tumour diameter and the MET distance using linear regression analysis.
Subsequently, we estimated the difference in the location and extent between the MET area and the area of high signal intensity on T2 weighted images (T2-high area). The cases were divided into the following two types, based on the relation between the MET area and the T2-high area: type 1, the MET area partly extended beyond the T2-high area (fig 2); type 2, the MET area was completely within the T2-high area (fig 3).
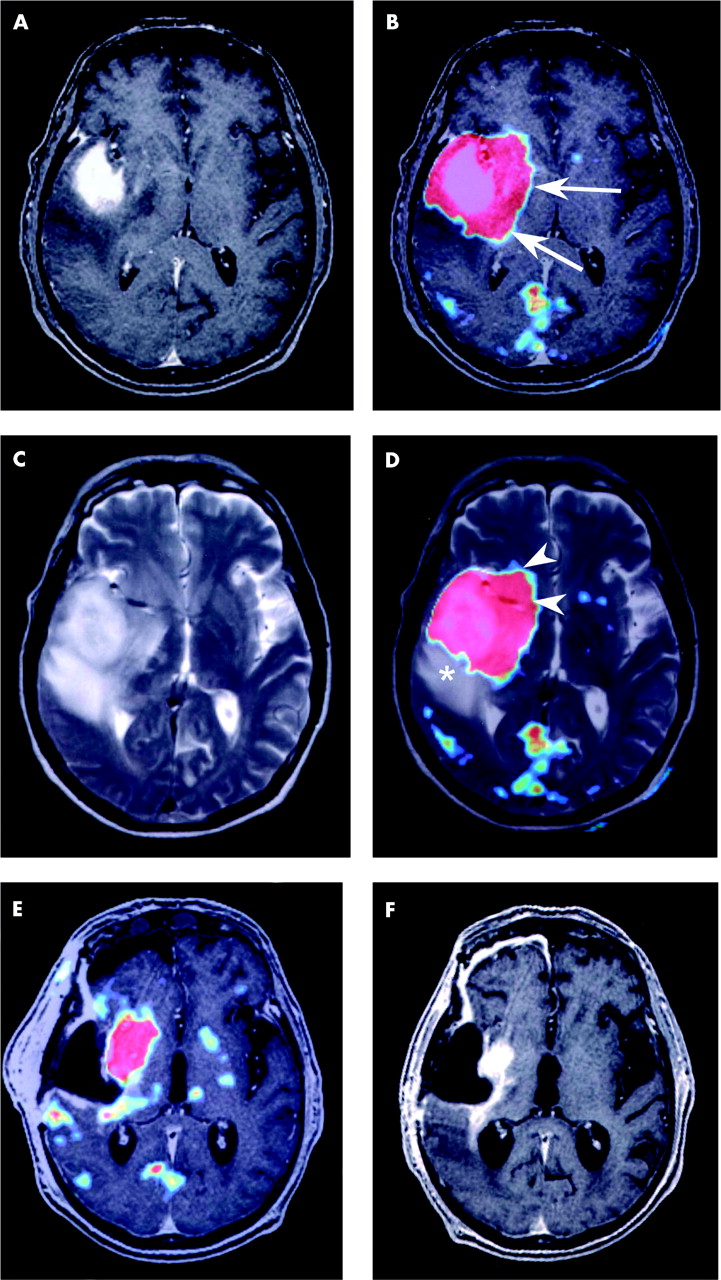
Case 6. Gadolinium (Gd) enhanced T1 weighted magnetic resonance (MR) image (panels A and F), Gd enhanced T1 weighted MR image co-registered with the 11C-methyl methionine–positron emission tomography (MET-PET) image (panels B and E), the T2 weighted MR image (panel C), and the T2 weighted MR image co-registered with the MET-PET image (panel D). Red indicates the MET area (panels B, D, and E). The MET area was larger than the Gd area, completely encompassing it (panel B). The arrows indicate points at which the MET area extended beyond the Gd area (panel B). Part of the MET area existed outside the T2-high area (arrowheads) (type 1), but a T2-high area existed without increased MET accumulation (asterisk) (panel D). The Gd area was completely resected, but a residual MET area can be seen in the right basal ganglia in Gd enhanced T1 weighted MR image co-registered with the MET-PET image after surgery (panel E). A Gd enhanced T1 weighted MR image eight months after the first examination (panel F) showing the development of a new Gd area in the right basal ganglia at which the MET area had extended outside the Gd area on the first examination.

Case 3. Gadolinium (Gd) enhanced T1 weighted magnetic resonance (MR) image (panel A); Gd enhanced T1 weighted MR image co-registered with 11C-methyl methionine–positron emission tomography (MET-PET) image (panel B); T2 weighted MR image (panel C); and T2 weighted MR image co-registered with the MET-PET image (panel D). Red indicates the MET area (panels B and D). The MET area was larger than the Gd area, encompassing it completely. The arrow indicates a point at which the MET area extended outside the Gd area (panel B). The T2-high area was larger than the MET area, encompassing it completely (panel D). The asterisk indicates a point at which the T2-high area existed without MET accumulation (type 2) (panel D).
RESULTS
The results are summarised in table 1. Representative transaxial slices of the cases are illustrated in figs 2 and 3.
The relation between the tumour size and the extent of 11C-methyl methionine (MET) area of the patients with glioblastoma multiforme
Discrepancy between MET area and Gd area
In all cases, the MET area was larger than the Gd area, encompassing it completely. In all but case 10, the MET area was completely located within 30 mm of the Gd area. On average, 58.6% of the MET area was located within the Gd area, 90.1% within 10 mm outside the Gd area, 98.1% within 20 mm, and 99.8% within 30 mm (table 1). The MET distance increased with an increase in the maximum tumour diameter, and a significant correlation was found between these variables by linear regression (y = 0.535x−8.865, x = maximum tumour diameter (mm), x >16.6, y = MET distance (mm), y >0, r = 0.975, p<0.001) (fig 4).

Correlation between the maximum tumour diameter (MTD) and the distance outside the Gd area (MET distance), at which more than 98% of the MET area was occupied. The hatched line represents a regression line with the equation y = 0.535x−8.865, x = maximum tumour diameter (mm), x>16.6, y = MET distance (mm), y >0 (regression coefficient: r = 0.975; p<0.001).
Discrepancy between MET area and T2-high area
In all cases, the T2-high area was larger than the MET area. The MET area partly extended beyond the T2-high area (type 1) in nine cases (fig 2), and was completely within the T2-high area (type 2) in one case (fig 3).
MET area and location of tumour recurrence
A newly developed Gd area emerged in five of the 10 cases during their clinical course up to the time of the study. These areas were demonstrated in the MET area even after complete surgical resection of Gd area on the initial MRI in three of the five cases (6, 8, and 9) (fig 2), and originated in the residual Gd area after surgery in the remaining two cases. These newly developed Gd areas were verified as tumour recurrences pathologically at the time of a second operation or at necropsy.
DISCUSSION
The use of PET, an imaging technique providing metabolic data, may play an important role in improving diagnostic procedures for determining the extent of malignant gliomas. MET is a radiopharmaceutical that can be used for PET scanning, and accumulation of MET in tissues seems to reflect transmembrane transport, which is influenced by requirements of the cells for protein synthesis precursors; it therefore correlates with tissue proliferation and malignancy.17–19 Because the metabolism of proteins is much greater in tumour cells than in the surrounding brain tissue, MET-PET scanning appears to be a more valuable tool for defining the boundaries of malignant gliomas than abnormal signal intensity on MRI.12,14,20 However, an accurate assessment of the relation between the distribution of the metabolic abnormality and that of the signal abnormality on MRI in patients with glioblastoma multiforme has not been reported. Our study addressed these issues by recording the distribution of the metabolic abnormality on MET-PET in untreated glioblastoma multiforme, and comparing the findings with magnetic resonance images from the same individuals. The recent development of co-registration image techniques has allowed accurate integration of PET based metabolic data with magnetic resonance based anatomical data, and this improves the value of the information obtained from PET scanning.
Our study shows that there are distinct differences in topographic images of glioblastoma multiforme between MET-PET and MRI. The MET area obviously extends beyond the Gd area, and only 58.6% of the MET area was involved within the Gd area on average. On the other hand, 99.8% of the MET area was involved within 30 mm outside the Gd area. In addition, the volume discrepancy between the MET area and the Gd area became larger with an increase in maximum tumour diameter (fig 4). The Gd area in glioblastoma multiforme definitely corresponds to the tumour, suggesting a disturbed blood–brain barrier. Additionally, in recent PET studies, analysis of the metabolic and histological characteristics of a stereotactic biopsy specimen provided evidence that regional high MET uptake correlates with the presence of tumour cells.13,15 Results with our three cases in whom a newly developed Gd area emerged in the MET area after complete surgical resection of the Gd area suggest that there were latent tumour cells in MET area beyond the Gd area—in these cases, the metabolic abnormality on MET-PET preceded the local tumour recurrence on MRI. Accordingly, our study indicates that glioblastoma multiforme tumour cells are not always limited to the Gd area, though on average almost all tumour cells are estimated to be located within 30 mm of the Gd area. Our results suggest that surgical resection confined to the Gd area is insufficient to achieve total resection of this tumour.
Our study also showed that the T2-high area was larger than the MET area in all cases. However, in nine cases, the MET area extended partly beyond the T2-high area. This suggests that glioblastoma multiforme is likely to extend beyond the T2-high area. It is thought that the T2-high area beyond the MET area consists mainly of peritumoral oedema.
In a recent study, PET data were successfully combined with MRI data to provide specific information for defining the target volume for radiosurgery and neuronavigation surgery in patients with brain tumours such as gliomas.21,22 The clinical role of PET imaging in the management of patients with glioblastoma multiforme will increase as more studies are done, validating the information provided by this unique physiological imaging technique. The potential of PET for the accurate investigation of in vivo pathophysiology has opened new pathways for the management of malignant glioma.
Conclusions
Previous PET studies on glioblastoma multiforme have reported that the MET area corresponds well with the area of tumour extension. The results of our study show that glioblastoma multiforme cells may extend over the Gd area and more widely with increasing tumour size on Gd-MRI. The T2-high area includes the greater part of glioblastoma multiforme, but does not show the entire area involved, and the evidence that tumour cells extend beyond the T2-high area is strong. The T2-high area beyond the MET area is probably mainly a reflection of peritumoral oedema. The methods discussed in this report could be useful in planning surgical resection, biopsy, or radiosurgery for glioblastoma multiforme.
REFERENCES
Footnotes
-
Competing interests: none declared