Article Text

Abstract
Background: The presence and degree of neuronal degeneration already existing in patients at their initial presentation with a clinically isolated syndrome suggestive of multiple sclerosis (CIS) is unclear, and whole brain or whole normalised grey matter analyses have not demonstrated significant atrophy in CIS cohorts at clinical presentation. Voxel-based analyses allow detection of regional atrophy throughout the brain and, therefore, may be sensitive to regional atrophy in CIS patients, and these changes may correspond with clinical disability.
Methods: This study used a modified voxel-based morphometry (VBM) method to correct for lesion effects to analyse regional atrophy and perform voxel-wise correlations between volume and clinical metrics in 41 untreated CIS patients at presentation compared with 49 healthy controls.
Results: The results confirmed that there was no significant difference in whole normalised grey matter volume between CIS and controls, whereas VBM showed significant areas of bilateral thalamic, hypothalamic, putamen and caudate atrophy. Voxel-wise correlations with clinical measures showed that cerebellar volumes correlated with clinical cerebellar function, nine-hole peg test scores and the Multiple Sclerosis Functional Composite (MSFC) score, and that the MSFC score was also correlated with putamen volume. Lastly, T1 lesion volumes were found to correlate with thalamic and hippocampal atrophy, suggesting a link between white matter lesions and grey matter degeneration at the earliest stages of multiple sclerosis.
Conclusions: Atrophy is present in CIS patients at presentations, particularly in the thalamus, and other deep grey matter structures. Furthermore, the correlations with clinical metrics suggest the importance of this atrophy to clinical status and the correlation with T1 lesion load suggests a possible role of Wallerian degeneration.
Statistics from Altmetric.com
Patients with multiple sclerosis (MS) typically present with a clinically isolated syndrome (CIS), which is characterised by an initial, well-defined demyelinating neurological event persisting for 48 hours or more, and involving the optic nerve, brain parenchyma, brainstem, cerebellum or spinal cord. Recent evidence has demonstrated early neuro-axonal loss in MS1–4 and, within the first year after the initial presentation, with a CIS,3–6 with the assumption that progressive atrophy is a marker of irreversible tissue damage. A possible explanation is the existence of neuronal degeneration preceding and independent of the initial clinical episode. Supporting evidence for this hypothesis includes data from abnormal magnetisation transfer MRI7 in CIS subjects and magnetic resonance spectroscopy anomalies in early MS.8 However, significant global and regional brain volume loss has not, as yet, been directly detected in CIS at presentation.
Grey matter tissue loss is poorly understood in MS and may be attributed to Wallerian degeneration or the presence of focal grey matter lesions. However, although some CIS patients may exhibit profound grey and white matter atrophy, others may not show much difference compared with controls. As a group, therefore, CIS patients do not tend to show significant grey matter atrophy, as determined by the segmentation of whole grey matter.3 9 The heterogeneity is not limited to regional volumetric changes, but to the severity of the initial clinical demyelinating event and the extent of recovery. This observation may be the result of heterogeneous distributions of grey matter damage/loss producing the clinical symptoms at presentation. Therefore, significant focal volumetric changes may be present and detectable by voxel-based techniques. Correlating clinical measures with focal regions of volume change represents a potential framework for associating clinical disability with atrophy.
Voxel-based morphometry (VBM)10 estimates voxel-wise volume changes based on the intensity mismatches after registration across datasets. VBM has only recently been applied in MS due to the confounding effects of white matter lesions on the registration and segmentation processes. A solution using prior segmentation and removal of lesions from the registration and segmentation process has been proposed.11 Recently, a few VBM studies have been published in relapsing-remitting12–15 and primary-progressive multiple sclerosis.16
In this manuscript, we present results of our study of the grey matter volumetric changes in CIS patients with whole grey matter atrophy methods, and voxel-wise analysis with VBM. In particular, we demonstrate the influence of lesions on the VBM results and investigate the relationship of regional atrophy estimates from VBM with clinical metrics in CIS patients with statistically normal whole grey matter volumes.
METHODS
The study cohort consisted of 41 untreated CIS patients and 49 control subjects who were evaluated at the University of California, San Francisco Multiple Sclerosis Center (table 1). The subjects presenting with their first well-defined, neurological event persisting for more than 48 hours involving the optic nerve, brainstem, cerebellum or spinal cord were included in the classification as patients with CIS. All CIS patients demonstrated at least two abnormalities on brain MR imaging, measuring greater than 3 mm2. This research investigation was performed with the approval from the University of California, San Francisco Committee on Human Research. Written informed consent was obtained from all study participants.
The CIS patients presented with a clinical optic neuritis (3), brainstem/cerebellar syndrome (13) and cervical and/or thoracic myelitis (25). None of the CIS patients was treated with approved disease-modifying therapy prior to their MRI scan and no steroid therapy was used within 4 weeks of the MRI scan.
Clinical assessments
CIS patients underwent standard neurological assessment batteries on the day of their MRI examination. These included the Kurtzke Expanded Disability Status Scale (EDSS)17 assessment and Multiple Sclerosis Functional Composite (MSFC) score: 9-Hole Peg Test (NHPT), Paced Auditory Serial Addition Test (PASAT-3) and 25-Foot Timed Walk (25FWT). The 25FWT, PASAT-3 and NHPT values were converted to age- and sex-matched z residuals using normative data18 and MSFC score was calculated.19
Magnetic resonance imaging
Magnetic resonance imaging scans for all subjects were acquired on a 1.5 T GE (GE, Milwaukee, WI) MRI scanner with a standard head coil using the same scanner and imaging parameters for uniformity. All CIS subjects were scanned at a median of 3.6 months after first clinical symptoms. Patients were not entered if they received treatment with glucocorticoids within the previous month. The imaging protocol included 3D T1-weighted spoiled gradient recalled echo volumes (pixel size of 1 mm×1 mm×1.5 mm, 124 slices, flip angle 40 degrees, 27 ms repetition time, 6 ms echo time) and a dual echo T2/PD-weighted images (1 mm×1 mm×3 mm pixels, interleaved slices, 20 ms and 80 ms echo times).
Image analyses
Data analysis and image processing was performed on a Sun (Sun Microsystems, Mountain View, CA) workstation running an AMD Opteron 150 processor and 3 GB of RAM on Red Hat Linux (Red Hat, Raleigh, NC). MATLAB 7.0.4.352 SP2 (Mathworks, Natick, MA) and SPM2 (Wellcome Department of Cognitive Neurology, London) were used. Other software included in-house software used for analyses for lesion volume and lesion mask determinations, as well as scripts developed to implement the lesion correction for VBM analysis. T1-weighted lesions were identified by a single reviewer on simultaneously viewed T2- and proton density-weighted images with regions of interest drawn based on a semi-automated threshold with manual editing as described elsewhere.20
The T1-weighted (T1W) 3D volumes were used to determine grey and white matter volumes, to segment lesions and to perform VBM analyses. A local T1W template was created using the subjects’ images from this study. This local T1W template map was created by registering each subject’s T1W image to the Montreal Neurological Institute (MNI) average 152 template with an affine transformation, and then averaging the registered images of all the subjects and subsequently smoothing using an 8 mm full-width at half-maximum (FWHM) isotropic Gaussian smoothing kernel. Then segmentation of the local template was performed to create probabilistic masks of grey matter, white matter and cerebrospinal fluid (CSF) to be used as priors in the registration and segmentation for all study subjects.
Voxel-based morphometry
The VBM processing was achieved with the optimised VBM protocol.10 VBM was performed with masking of the registration cost function with lesion masks.11 Each two-dimensional slice from the original scans was analysed for lesions and carefully outlined by an experience MS neurologist (DP). The two-dimensional lesion regions were converted into binary lesion masks. The lesion masks were then smoothed three-dimensionally with 8 mm Gaussian kernels (fig 1). These smoothed lesions masks were used in the VBM algorithm to mask the cost function when registering the segmented grey matter images of the subjects to the local grey matter template created from the initial step. The resulting grey matter images were modulated to retain pre-normalisation volume information. The voxel intensities in the image were multiplied by the Jacobian determinants that were calculated from the spatial normalisation step. Voxel-wise comparisons of CIS to control grey matter volumes were performed with the General Linear Model using the False Discovery Rate (FDR) method,21 with p<0.05 with correction for multiple comparisons. The statistical model tested regions where CIS volumes were less than control volumes and covaried for sex, age and total intracranial volume. For improved reliability of the results, clusters with a few voxels (<30) were not reported. A check of regions where CIS had larger volumes than controls was also performed to test the reliability of the data for systematic bias. The association of anatomical labels with MNI coordinates was determined using the AAL template provided with MRIcron (http://www.mricro.com/mricron) and (http://www.neurovia.umn.edu/cgi-bin/tal_atlas) for the hypothalamus.

Whole-brain analyses
Total grey and white matter and CSF volumes were determined from the SPM2 analysis for all subjects. In brief, each subjects’ T1W volume was registered to the local template and segmented into probabilistic maps of grey, white and CSF (fig 1). The total intracranial volume for each subject was calculated from the sum of these three compartments. The white and grey matter volumes were normalised for the subjects’ total intracranial volume divided by this volume and thereby creating volume fractions. These fractions were scaled to a nominal volume of 2006 cubic centimeters (cc) total intracranial volume for the MNI template. The normalised grey, white and brain (grey plus white) volumes were compared (F-test) between CIS and control subjects, with age and sex as covariates.
Correlations with clinical measures
Clinical measures of disease duration, EDSS, MSFC, NHPT residuals, 25FWT residuals, PASAT residuals, cerebellar functional scores, pyramidal functional scores and T1 lesion volumes were voxel-wise correlated with the modulated grey matter values (“volumes”) for the CIS patients. Hypotheses tested were modulated grey matter values decreased with increasing disease duration, increased EDSS, increased MSFC, increased 25FWT residuals, increased NHPT times residuals, increased T1 lesion volumes, increased pyramidal scores, increased cerebellar scores and decreased PASAT residuals. Age, sex and total intracranial volume were included as covariates in all correlations and results with FDR corrected for multiple comparisons with p<0.05 were noted. Finally, we investigated the step-wise regression of these clinical variables with normalised whole grey matter volumes with age and sex as covariates.
RESULTS
Results are presented below for clinical assessments and T1 lesion volume (table 2), whole grey matter volumes (table 3), and voxel-based analyses in the comparison between CIS patients and control subjects (table 4). Also included are the results from comparison for VBM analysis with and without lesion segmentation correction. Lastly, results are presented for the voxel-based correlations of clinical metrics with local atrophy in the CIS patients.
Grey matter atrophy in CIS patients
The mean normalised whole grey and white matter, and brain volumes for controls and CIS are shown in table 3. From the ANOVA for whole normalised grey matter volumes with age and sex as added effects, no significant volume difference was found between CIS and controls (p = 0.54 for nGMV; p = 0.15 for nWMV; p = 0.21 for nBV).
VBM in CIS patients
The results in table 4 show significant atrophy in the CIS patients’ thalamic, hypothalamic, putamen, caudate and brainstem regions compared with the control subjects using the procedure to correct for the presence of lesions; figure 2 shows these regions.

When the analysis was run without correction for lesions, qualitatively similar results were found for the thalami but with reduced statistical significance (table 4). These results replicated the strongest regions found in the bilateral thalami but not the results in other areas, including the hypothalamus, putamen and brainstem.
Correlations with clinical metrics
The voxel-wise and whole normalised grey matter correlations with clinical metrics are shown in table 5. Significant voxel-wise correlations of the VBM volume estimates with the clinical metrics were found for the cerebellum, thalamus, hippocampus, putamen/claustrum and caudate.
The whole normalised grey matter volumes in CIS patients were correlated with the VBM voxel volume estimates and were significantly correlated with widespread grey matter regions, including the thalamus. However, in the step-wise regression of clinical metrics with whole normalised grey matter in the CIS cohort, only age was found as a covariate.
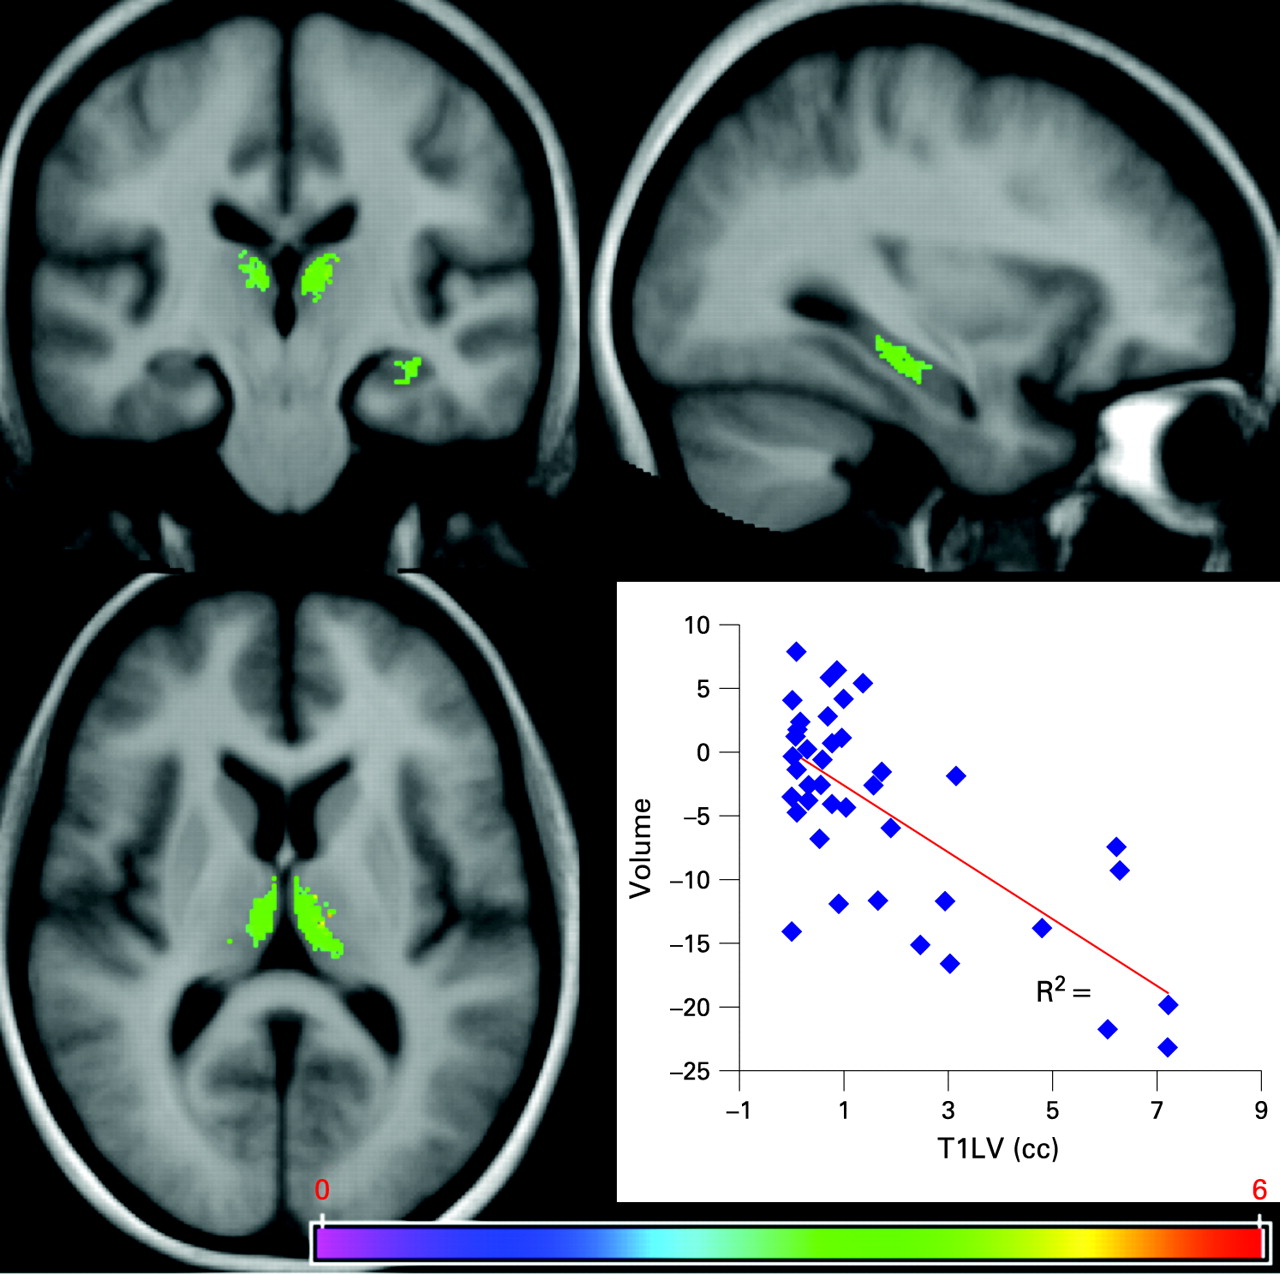
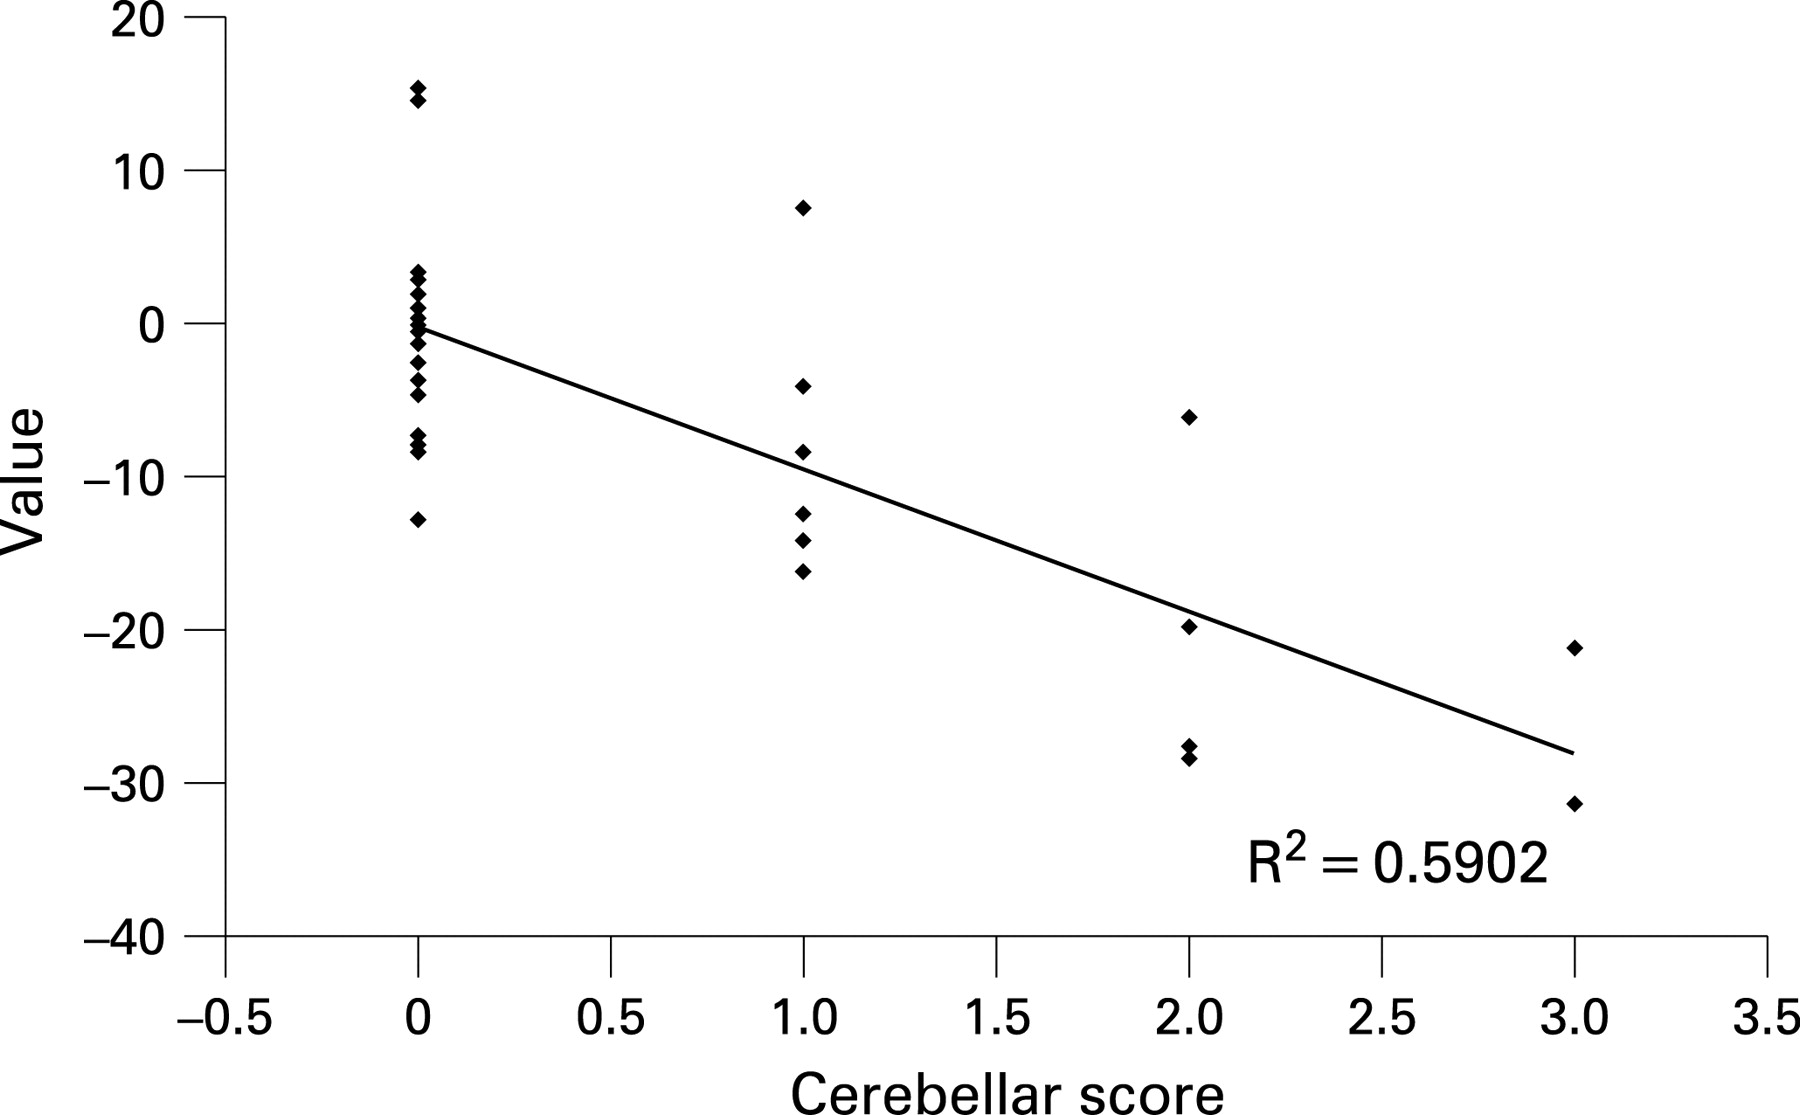
Increased T1 lesion volumes were found to correlate with the bilateral thalami and left hippocampus volume loss (fig 3). Decreased NHPT z-scores and cerebellar functional scores correlated with reduced volume in the right and left cerebellum (fig 4). No significant correlations were found between EDSS and grey matter atrophy, but disability measured by the MSFC score correlated strongly with cerebellum, putamen, claustrum and caudate volumes (fig 5).

DISCUSSION
Using VBM, we have determined regional atrophy in patients at a median of less than 4 months after their initial clinical presentation with a clinically isolated syndrome suggestive of MS and at least two brain lesions. The regional atrophy was detected bilaterally in the thalami, hypothalamus, putamen, caudate and brainstem, even though no difference in whole normalised grey matter volume was detected. These results may indicate pre-existing neuronal degeneration in patients before their clinical presentation. Furthermore, thalamic atrophy was found to correlate with T1 lesion volume, suggesting a link between white matter lesions and thalamic degeneration. Finally, we have demonstrated relationships between clinical disability and regional volumes.
Grey matter atrophy in CIS and early MS
Currently, there is no direct evidence of grey matter atrophy in CIS patients at initial clinical presentation. This may be due to the sensitivity of whole grey matter volume estimation methods and/or to the heterogeneity of this pathological process. Our current study confirms the insensitivity of whole normalised grey matter measures to detect grey matter atrophy in CIS at initial presentation, as reported in a previous study.3 9
The earliest that whole normalised grey matter atrophy has been detected in MS was in a “possible MS” cohort3 and from a longitudinal study comparing volume loss between initial presentation and a follow-up period of 14 and 3 years.6 The “possible MS” cohort satisfied the Barkhof crtiteria for dissemination in space or had more two or more lesions plus IgG synthesis, and had short disease duration (mean 0.7 years) and significant cortical thinning compared with controls.3 The present study suggests that the regional approach is more powerful for detecting early atrophy in CIS subjects. Grey matter loss in MS is likely to be a heterogeneous and multi-factorial pathological process, but our results suggest a tendency for focal atrophy in some brain regions that can be detected very early in the disease. Hence, the effects of focal atrophy may be diluted when testing for differences at the whole grey matter level.
Voxel-based grey matter studies in multiple sclerosis
Only recently have VBM studies been carried out in MS.12–16 Four of these studies were on relapsing-remitting MS12–15 and one on early primary-progressive MS.16 The results from these studies have been diverse, with thalamic and fronto-temporal lobe findings. Of the five VBM studies published to date, the three studies with disease duration of 4–5 years had thalamic atrophy findings,12 15 16 and one study with disease duration of 13 years14 and the other with unclear disease duration13 had fronto-temporal lobe findings. The current study with median disease duration of less than 4 months agrees with the thalamic atrophy detected in other early relapsing-remitting MS cohorts. These results are also consistent with thalamic abnormalities observed in MS by other methods.22–25 It is unclear why the other studies have detected only fronto-temporal and not thalamic atrophy given the extensive evidence for thalamic degeneration; this discrepancy may originate from cohort and/or methodological differences.
Methodological issues
VBM has been widely applied in many neurological conditions. However, there are caveats that should be stated with any VBM analysis. The interpretation of volume information depends on the accuracy of the registration. For example, intensity variations due to tissue pathology and differences in shape without volume changes can be misinterpreted as atrophy. The masking of lesions in the white matter showed an improvement in the stereotactic normalisation and enabled significance of the results herein. It is ideal to use VBM in the CIS cohort (also early primary-progressive MS) among patients with MS as the lesion volume is very low. Other applications to MS have considered cohorts with much larger lesion volumes14 and these authors used a segmentation method based on T1 relaxation times. In general, the validity of any method to remove the impact of large lesion loads on VBM analyses has not been established and, in all cases, caution must be used when interpreting the results from these studies. In addition to lesions, the presence of T2 hypointensities presumed to be from iron depositions in the deep grey matter in patients with MS has been associated with atrophy and cognitive deficits.26 These have not been seen in our cohort on the T2-weighted images or any corresponding intensity variations on the T1-weighted images used for our analysis. So, although in theory these intensity variations may affect grey matter segmentation, their absence in this very early cohort is not unexpected and is not likely to have influenced our results.
A second caveat is in the statistical testing, which does not allow inferences based on negative results; for example, based on the current results, we cannot infer that the cortex is not atrophied in CIS. Furthermore, in the present study, we also tested our data for regions where CIS have larger volumes than controls, and no significant regions were found. This test provides a check for the possible occurrence of systematic or spurious differences between the groups.
Thalamic and hypothalamic degeneration in multiple sclerosis
Neuronal loss in the thalamus of patients with MS has been hypothesised based on thalamic abnormalities observed in CIS7 27 and MS22–25 28–30 patients and hypothalamic lesions.31 These abnormalities include magnetisation trausfer ratio, T2 hypointensities, increased mean diffusivity and N-acetyl aspartate (NAA) reduction with post-mortem studies of neuronal densities. The work of Cifelli et al22 25 show direct histopathological evidence of thalamic neuronal loss in MS; however, it is unknown how early this loss occurs. Grey matter atrophy is considered to be an in vivo marker of irreversible neuronal loss (NAA depends on both neuroaxonal function and loss). The present study provides strong evidence of thalamic and hypothalamic neuronal loss at the earliest stages of MS. Later in multiple sclerosis, T2 hypointensities have also been correlated with atrophy32 and cognitive deficits and thalamic atrophy,26 and is consistent with our finding of early thalamic volume loss and the presence of cognitive deficits in CIS without detectable global grey matter atrophy.33
Role of white matter lesions
The correlation between T1 lesion volume and thalamic and hippocampal atrophy supports an impact of white matter lesions on thalamic/hippocampal neurons, but does not exclude primary neuroaxonopathy and/or demyelinating grey matter lesions occurring in tandem. The role of white matter lesions in grey matter atrophy remains unclear with supporting and contradicting evidence. Given that the thalami are relatively well myelinated compared with other grey matter structures, it is not surprising that demyelinating lesions have been found with great frequency in MS deep grey matter nuclei, including the thalami,34 and may occur independently of white matter lesions. A recent study35 has also reported demyelinating lesions in the cerebral cortex, thalamus, basal ganglia and hippocampus. Our lack of sensitivity with current imaging methods to detect grey matter lesions is a hindrance to the investigation of this hypothesis.
A possibility is that the correlation arises from the connectivity of the thalami and hippocampi with white matter lesions. In this case, distal degeneration may occur with white matter lesion damage to axons resulting in thalamic and hippocampal neuronal loss. This “connectivity” hypothesis is supported by the known high prevalence of white matter pathways connecting in and out of the thalami. Several reports have demonstrated the relationship between white matter lesions and thalamic28 36 37 and other deep grey matter37 38 neuronal loss. Reduced thalamic metabolism was also found to correlate with lesion load.36 Thalamic and hippocampal abnormalities were also correlated with white matter lesion load in an MR spectroscopic study.28 In this study, reduced NAA was observed in the thalamus and increased mI in the thalamus and hippocampus. These metrics were correlated with lesion volume, and the thalamic and hippocampal mI were correlated with each other.28 This hypothesis can be further investigated with improved timing of the relative grey and white matter changes from serial studies, improved detection of grey matter lesions, and delineation of connected regions using diffusion fibre tracking.
Correlations with clinical function
We have found correlations of regional atrophy (see table 5) with clinical functional metrics, primarily in the thalami, putamen and cerebellum. It is important to clarify that, in addition to the regions already reported, the cerebellum and hippocampi have a trend towards reduced volumes in CIS compared with controls (T values between 1.0 and 2.0)—although not significant compared to the statistical threshold used in this study (FDR p<0.05 corrected for multiple comparison). The three components of the Multiple Sclerosis Functional Coefficient—25FWT, PASAT and NHPT—were tested for voxel-wise correlations with atrophy in the CIS cohort. Of these measures, the NHPT was found to correlate with putamen and cerebellar volumes, and cerebellum volumes were found to correlate with the 25FWT. When combined to form the disability metric MSFC, even stronger correlations were found with atrophy of the putamen and cerebellum (in contrast, no significant correlations were detected between regional atrophy and the EDSS). From another study, segmented caudate volumes in patients with MS were found to be decreased compared with controls, with no correlations with disease duration or EDSS.39 These findings are consistent with the results presented here; however, those authors did not investigate the relationship between caudate volume and MSFC score. These functional tests primarily assess motricity and coordination and both fit well with where the regional atrophy was detected. In contrast, no significant correlation was detected between these clinical metrics and whole grey matter volumes, which shows the additional benefit of regional analyses to detect the link between grey matter loss and clinical function. Furthermore, these correlations give further confidence to the cross-sectional atrophy detected in the thalami, caudate and putamen, and the trends in cerebellum and hippocampus of our cohort.
CONCLUSION
In conclusion, we provide direct evidence of grey matter volume loss in CIS patients with at least two brain lesions at presentation from their first clinical episode. Our results indicate that the thalamus, cerebellum and putamen exhibit atrophy. Furthermore, correlations with T1 lesion volumes suggest that neuronal degeneration early in the disease may be dependent on the occurrence of visible white matter lesions. Correlations with clinical metrics suggest a relationship between the regions of detected grey matter atrophy and the functionally related clinical disability and disability, as determined from the MSFC. In addition to showing the earliest atrophy in MS, this study demonstrates the need for regional analyses of atrophy for improved sensitivity and correlation with clinical measures.
Acknowledgments
We would like to acknowledge the funding of this work by the National Multiple Sclerosis Society research grant RG3240A1.
REFERENCES
Footnotes
Competing interests: None declared.