
Abstract
BACKGROUND AND PURPOSE: Because cerebral perfusion imaging for acute stroke is unavailable in most hospitals, we investigated the feasibility of a method of perfusion scanning that can be performed rapidly during standard cranial CT. Our aim was to identify the scanning parameters best suited to indicate tissue at risk and to measure a perfusion limit to predict infarction.
METHODS: Seventy patients who had suffered stroke and had undergone cranial CT 0.5 to 12 hours (median, 3.75 hr) after the onset of symptoms participated in the study. While undergoing conventional CT, each patient received a bolus of iodinated contrast medium. Maps of time to peak (TTP), cerebral blood volume (CBV), and CBF were calculated from the resulting dynamically enhanced scans. These perfusion images were compared with follow-up CT scans or MR images showing the final infarctions.
RESULTS: CBF maps predicted the extent of cerebral infarction with a sensitivity of 93% and a specificity of 98%. In contrast, CBV maps were less sensitive and TTP maps were less specific and also showed areas of collateral flow. Infarction occurred in all of the patients with CBF reduction of more than 70% and in half of the patients with CBF reduction of 40% to 70%.
CONCLUSION: Dynamic CT perfusion imaging safely detects tissue at risk in cases of acute stroke and is a feasible method for any clinic with a third-generation CT scanner.
Although studies show that the IV administration of a fibrinolytic drug improves the outcome of acute stroke (1–3), the therapy itself can cause serious intracerebral hemorrhage. Both the diagnosis and treatment of acute stroke might be improved if cerebral perfusion could be measured to identify the tissue at risk. The extent of ischemia cannot be assessed by neurologic examination alone. Transcranial duplex sonography (4), digital subtraction angiography (5), CT angiography (5), xenon-enhanced CT (6), positron emission tomography (7, 8), single-photon emission CT (SPECT) (9, 10), and various MR imaging techniques (11–17) are useful methods for evaluating acute stroke. However, these methods have disadvantages and are not available in all hospitals. Because almost all patients with suspected acute stroke should undergo CT, which is also widely available, to exclude hematoma and existing infarcts, essential time can be gained by also measuring cerebral perfusion during the initial CT. The aim of our study was threefold: to investigate whether the use of dynamic CT with conventional iodinated contrast medium augmented by software that rapidly provides maps of CBF is feasible in cases of acute stroke, to determine which imaging parameters best detect tissue at risk, and to identify perfusion thresholds for predicting the development of infarction.
Methods
We conducted a prospective study to determine the value of CT for measuring cerebral perfusion by use of a bolus of iodinated contrast medium in patients with acute stroke. The initial plain CT and the perfusion maps were compared with the follow-up CT scans or MR images. Patients were grouped post hoc according to their National Institutes of Health Stroke Scores (NIHSS) at admission.
Patients
Candidates for this study were adult patients with obvious hemispheric symptoms such as hemiparesis, aphasia, or hemianopia of less than 12 hours' duration, who were consecutively admitted to our institutions between 1996 and 1998, and whose plain cerebral CT scans showed no signs of hematoma. Patients with brain stem symptoms were excluded. The study design conformed to the Declaration of Helsinki and all subsequent versions on the participation of humans in studies. Informed consent was obtained from each patient, if possible. If the patient was aphasic, he or she was examined according to the hospital guidelines for emergency treatment and the next of kin was asked for consent and was asked whether the patient would be likely to agree to undergoing the procedure.
Perfusion Imaging Methodology
The main principle of our method of perfusion imaging is based on the analysis of plain and contrast-enhanced CT scans obtained at different times. Most important is a sharp bolus of contrast medium resulting from rapid injection (10–20 mL/s). The software used the maximal slope of the time-density curve (Perfusion CT software; Siemens, Erlangen, Germany) to measure cerebral blood perfusion from dynamically enhanced cerebral CT scans, as described previously (18). See appendix for relevant formulae to calculate the parameters. The parameters chosen for evaluating cerebral perfusion were CBF, cerebral blood volume (CBV), and time to peak (TTP).
Our method of calculating CBF is biased by the use of a contrast bolus that is not compact enough to prevent venous outflow before the peak of the arterial inflow is reached (it is not biased by recirculation). This results in a diminution of the calculated flow. Partial volume effect of the blood reference cannot be completely excluded. Therefore, our perfusion maps were used as non-absolute values relative to the unaffected regions of the brain within the same section in patients with focal pathologic abnormalities.
Perfusion Imaging Procedure and Follow-up Examinations
Conventional plain CT of 3- or 4-mm-thick basal sections and 5- or 8-mm-thick supratentorial sections were obtained. Dynamic contrast-enhanced CT scans were acquired by injecting 50 mL of iodinated contrast medium (300 mg/mL) into a peripheral vein through a 16-gauge catheter, either manually or with an angiographic power injector (injection velocity = 10 mL/s).
Then 10-mm-thick scans with rotation times of 0.75 to1 seconds were reconstructed every 0.75 to 1.5 seconds by a 30- to 40-second-long scan on a continuously rotating CT scanner (Somatom Plus S or Somatom Plus 4; Siemens). The CT scans were transferred via DICOM net (every series, 1–2 min) to a personal computer (Intel Pentium Pro 200 MHz, 128 MB) and perfusion images were calculated in approximately 1 minute.
Because this method allowed only a single section to be calculated with each contrast bolus, one to three levels were examined per patient. The first dynamic CT scan for each patient was obtained at the level of the basal ganglia. If no perfusion abnormality was evident on the first perfusion section or if an estimation of the lesion volume was desired, a second or even a third scan was obtained rostral or, in patients with motoric aphasia, caudal to the basal ganglia.
The involved subterritories were determined by native follow-up CT or MR imaging (with T2- and proton density–weighted turbo spin-echo and diffusion-weighted (b = 1000) echo-planar imaging sequences) performed within the 1st week after stroke onset.
Image Interpretation
Because we used a single-section perfusion technique (one to three sections), it was not possible to calculate the volume of the tissue at risk. Therefore, we defined its extent semiquantitatively by determining whether early signs of infarction, perfusion deficits, and definitive infarction occurred in any of 12 arterial subterritories.
Two neuroradiologists evaluated the conventional CT scans while blind to the parameter images and to the results of the follow-up examination and evaluated the parameter images while blind to the follow-up scans. The plain CT scan (baseline scan) was examined for early CT signs (ECTS) of infarction (ie, swelling or hypodensity of the gray matter equivalent to a decrease of 4 to 10 HU) and for hyperdense vessel signs of thromboembolism of the internal carotid artery (ICA) and of the middle cerebral artery (MCA) and its branches, which were visible as dense vessels with approximately 60 HU (19–21). The perfusion maps were analyzed for decrease in CBF, decrease in CBV, and delay in TTP. When the evaluations differed, the evaluators agreed on a common decision. The CT scans were analyzed for evidence of cerebral infarct or perfusion changes in six arterial subterritories on both hemispheres of the brain, according to Ringelstein et al (22), as follows: the anterior cerebral artery; the deep (lenticulostriatal) territory of the MCA; the ventral (frontal) territory of the MCA; the middle (temporal, insular, and central) territory of the MCA; the posterior (parietal and temporo-occipital) territory of the MCA; and the posterior cerebral artery.
On the basis of preliminary examinations by this method, 10 patients with subacute stroke and 30 patients with symptomatic carotid stenosis (unpublished data) were classified to have moderate (CBF in the affected territories between 30% and 60% of CBF in the normal territories) or severe (CBF less than 30% of normal CBF) changes in CBF. Changes in CBV were also classified as moderate (CBV in the affected territories between 50% and 80% of normal) or severe (CBV less than 50% of normal CBV). The TTP on the affected side was considered moderately delayed if it lagged by 3 to 6 seconds and severe if it lagged more than 6 seconds behind the TTP on the normal side. ECTS and perfusion lesions in each subterritory of the initial scans were correlated with definite infarcts shown in the first follow-up CT scans or MR images.
Statistical Analysis
Sensitivity, specificity, and positive and negative predictive values of hyperdense vessel signs, ECTS, a CBF map, a CBV map, and a TTP map for the prediction of infarcts were calculated with 95% confidence intervals. We hypothesized first that CT-based CBF maps would predict infarction better than conventional CT scans, second that CBV maps would be less sensitive, and third that TTP maps would be less specific. True- and false-positive findings on the conventional and parameter scans regarding definite infarct in the follow-up study were explored by χ2 tests. To maintain a global α-level of P < .05 for these three hypotheses, multiple testing was adjusted according to Bonferoni-Holm. In addition to the hypotheses, explorative tests were conducted using χ2 tests.
Results
A total of 70 patients (42 male and 28 female patients), ranging in age from 28 to 85 years (median, 64 years), met the inclusion criteria. Thirty of these patients were examined 0.5 to 3 hours after the onset of symptoms, 18 between 3.5 and 6 hours after symptom onset, and 22 between 7 and 12 hours after symptom onset (median, 3.75 hr). The NIHSS was less than 3 for five patients. A mean of 1.8 sections of dynamic CT scans was obtained per patient (for each of 23 patients, only one section was obtained, for each of 36 patients, two sections, and for each of 11 patients, three sections). No complications occurred. Perfusion scan quality was relatively poor but was sufficient for evaluation of seven patients who had decreased heart function, causing a delayed arrival of the contrast bolus, and for two patients in whom the CT injector delivered insufficient contrast bolus. Larger areas of decreased perfusion in the brain often appeared on the source CT scans with the arrival of the contrast medium bolus as areas of reduced and delayed enhancement. Scan acquisition, data transmission, and generation of CBF, CBV, and TTP maps required approximately 5 minutes for each series of scans.
Follow-up examinations were performed within the 1st week, with a median of 2 days, for 61 patients and after several weeks for two patients, respectively. Six of the patients with transient ischemic attack and one of the patients diagnosed to have epilepsy did not undergo scanning after the initial procedure because of complete resolution of symptoms on the same day. Sixty-one follow-up CT examinations and 31 MR imaging examinations were done.
Four patients underwent fibrinolysis with tissue plasminogen activator within 3 hours. Two patients with no visible perfusion deficit developed microangiopathic lesions, and two patients with large perfusion deficits developed infarction within these areas.
Patients without Ischemia
The results of perfusion CT for three patients with acute stroke symptoms (NIHSS ≥ 3) showed no evidence of cerebral ischemia. Further evaluation led to diagnosis of seizures secondary to gliosis in one patient, astrocytoma in one, and radiation injury in one. The results of conventional CT were abnormal for all three patients; an ECTS of infarction was suspected in one case. Specificity and positive predictive values of the conventional and perfusion CT were determined for all 70 patients. Table 1 provides an overview of the findings for the different pathologic abnormalities.
An overview of the different diseases in 70 patients with stroke symptoms
Transient Ischemic Attack and Migraine
The clinical symptoms resolved within 24 hours in 14 of the 67 patients with cerebral ischemia. In 13 of these 14 patients, the symptoms were because of a transient ischemic attack (initial NIHSS < 3 for two patients). The 14th patient had amnestic aphasia and showed mild hypoperfusion (CBF in the left temporo-occipital MCA territory was 60% of that on the normal side). Clinically diagnosed to have migraine, this patient did not develop an infarct (initial NIHSS < 3). Eleven of the patients with transient ischemic attacks had no abnormalities revealed by perfusion images, two patients showed moderate TTP delay (in one subterritory and in the whole carotid territory, respectively), and none developed an infarct.
Microangiopathy and Lacunar Infarcts
Among the 53 patients for whom cerebral infarction was confirmed by follow-up studies, six had microangiopathic or lacunar infarcts (< 1.5 cm in diameter). It was difficult to differentiate these small ischemias from artifacts in the white matter by perfusion scanning, and a lesion in the internal capsule was suspected based on only two of the six patients' TTP maps, one of the six patients' CBV maps, and one of the six patients' CBF maps.
Infarctions Greater than 1.5 cm
The macroangiopathic infarcts in 47 patients had a hemodynamic origin (low flow due to carotid stenosis) in three cases and were territorial in 44, including seven smaller gyral infarcts. The initial NIHSS was less than 3 for two of these patients. Ninety-six territories were involved, most often (35 times) the middle cortical area of the MCA (Table 2).
Sensitivity for predicting infarction in the subterritories of all patients disregarding microangiopathy
Results of conventional and perfusion imaging in cases of subsequently confirmed infarction >1.5 cm in maximum diameter
Of the seven gyral infarcts, six were detected on TTP maps, four on CBF maps, and three on CBV maps. The 40 large territorial and hemodynamic infarcts (>10 mL) were all diagnosed based on patients' CBF maps (sensitivity of 100%).
Tables 2 and 3 show the relationships between moderately pronounced perfusion parameters and cerebral infarction greater than 1.5 cm in diameter. If only severe perfusion changes were considered, sensitivity decreased while specificity became 100% for the CBF and CBV maps.
Hyperdense vessel signs were visible in only one third of the patients with cerebral infarction greater than 1.5 cm. Thus, the sensitivity of hyperdense vessel signs was substantially lower than that of the CBF map (P < 1E–8) and was also lower (but not significantly) than the sensitivity of ECTS. Hyperdense vessel signs could not be evaluated for 15 patients because of general sclerosis of the cerebral arteries. The specificity of hyperdense vessel signs was lower than that of ECTS (P < .02).
ECTS of infarction revealed true-positive findings for infarcts greater than 1.5 cm in approximately half of the brain territories and patients (Table 2). Figures 1 and 2 provide examples of false-negative ECTS. The specificity of ECTS was very high; only one territory in one patient was falsely positive for infarction. The negative predictive value of ECTS for infarction was only 26% among patients examined within 3 hours after the development of symptoms; 3 hours after the appearance of symptoms, the negative predictive value of ECTS increased to 71% (P < .005). Conventional CT findings were more sensitive for detecting infarction in the deep territory of the MCA than in other territories (Table 2). In contrast, the perfusion maps did not show significantly different sensitivities (and only slight differences in the specificities) for different territories of the brain.

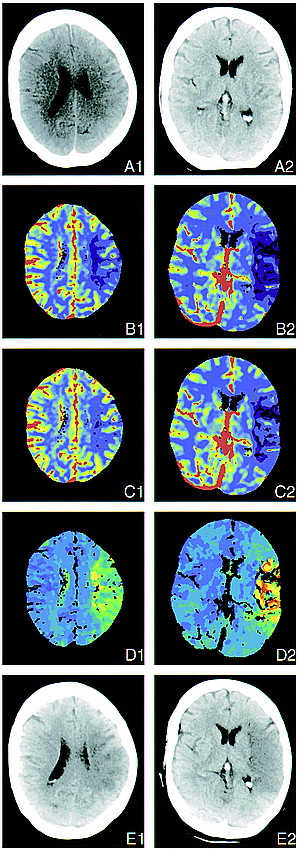
Two perfusion sections in a case of left MCA occlusion. Three hours before undergoing the examination, this 61-year-old woman experienced acute right hemiplegia and global aphasia during coronary angiography.
A, Early conventional CT scans appear normal, with no signs of swelling or discrete cortical hypodensity.
B, CBF maps show flow reduction in nearly the whole cortical territory of the left MCA. Temporal (B2), severe; parietal (B1), moderate to severe. Note that there is a mismatch with the ECTS (color code: red, blood vessels; green, normal cortex; blue, normal white matter; violet, low flow area).
C, CBV maps also show ischemia, although less clearly in the central parietal region because of decreased contrast (color code: red, blood vessels; green, normal cortex; blue, normal white matter; violet, low flow area).
D, TTP concentration of contrast enhancement maps show time delay in the cortical territory of the left MCA and artifact in areas where no peak is discernible (color code: blue, segmented blood vessels, normal cortex; dark green, normal white matter; light green, yellow, and red, low flow area).
E, Follow-up CT scan, obtained 1 day after stroke, shows infarction in the former ischemic portion of the cortical territory of the MCA. Temporal (B2), complete; central/parietal (B1), patchy.
CBF maps indicating moderate or severe deficits showed true-positive results for infarcts in more than 90% of the brain territories and patients (Figs 1 and 2). These results included three patients and 17 brain territories with only a moderate decrease of perfusion. Decrease in CBF was significantly more sensitive for infarction than ECTS (P < 5E–5 for patients and P < 1E–10 for territories). CBF was especially more sensitive than ECTS for infarction in the anterior (P < .002), middle (P < 2E–5), and posterior (P < 5E–4) territories of the MCA. Only moderate decreases in CBF maps gave false-positive indications; specificity was lower than that of ECTS (P < .001). However, if the NIHSS was equal to or greater than 3, a moderate CBF decrease was falsely positive in only one patient (specificity, 95%).
CBV maps showed fewer definite regions of low perfusion than did CBF maps. In areas with almost no perfusion, CBV was also measured as zero. CBV maps gave true-positive indications of infarction in higher proportion than did ECTS (P < 5E–4 for patients and P < .002 for brain territories), including 25 patients and 36 brain territories with only moderate decrease of blood volume. However, CBV showed a significantly lower proportion of true-positive territories than did CBF (P < 2E–4). CBV maps gave fewer false-positive results (all for moderate decrease) than did CBF maps (P < .05). CBV was slightly increased in territories of stenotic vessels if CBF was compensated.
TTP maps were nearly as sensitive indicators of cerebral infarction as were CBF maps but were less specific. Sensitivity was higher than that of ECTS (P < 1E–4 for patients and P < 1E–9 for territories). The TTP delay among patients with infarction ranged between approximately 1 and 15 seconds. Longer delays resulted in artifacts, because the bolus peak disappeared in the background noise. However, TTP map delay also occurred in nine patients without infarction and was falsely positive in more than one third of the territories; thus, the specificity of TTP regarding patients and territories was significantly lower than that of CBF (P < .05 and P < 1E–6) and ECTS (P < .005 and P < 5E–13). The high rate of false-positive findings revealed by the TTP map despite normal CBF was most probably due to carotid stenosis compensated via collaterals (Fig 2). TTP maps that indicated a delay of more than 6 seconds or an artifact showed only one region in one patient as falsely positive; however, if these criteria had been used to identify infarction, they would have led to false-negative results for an additional six patients and 13 regions compared with the criteria of TTP delay greater than 3 seconds. CBF and TTP together are 100% sensitive for cerebral infarction relative to the patients as well as to the territories.

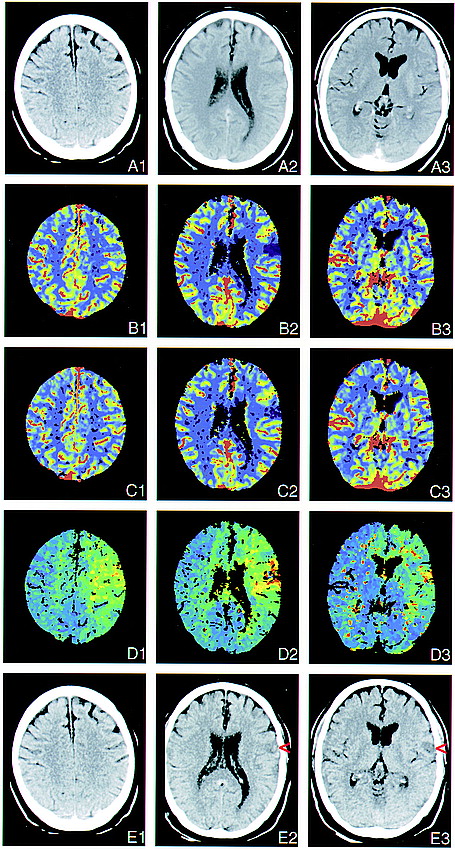
Three perfusion sections. Occlusion of a left MCA branch and of the ipsilateral ICA. This 62-year-old man was admitted with right hemiparesis and aphasia 8 hours after the onset of symptoms. The color-coding is similar to that used in figure 1.
A, Early conventional CT scans appear normal, although retrospectively, a discrete hypodense area can be seen in the cortex (A2).
B, CBF maps show severe flow reduction in the fronto-opercular territory of the left MCA.
C, CBV maps show the ischemic region to be less pronounced and indicate a 10% increase in blood volume in the surrounding cortex, which compensated for the reduced flow velocity in the territory of the left carotid artery.
D, TTP concentration of contrast enhancement maps show time delay not only in the ischemic zone but also in the territories of the entire left MCA and anterior cerebral artery due to occlusion of the ICA, as revealed by sonography. Acute left carotid artery occlusion might have led to embolization in a frontal branch of the MCA.
E, Follow-up CT scans, obtained 3 days after stroke, show a small infarct representing the former ischemic area of the frontal cortical territory of the MCA (red arrowheads).
Discussion
A fast algorithm enabled us to calculate CBF maps almost without any time delay. This method requires only a personal computer with appropriate evaluation software and a DICOM connection to the CT scanner. After performing conventional CT to exclude hematoma and to determine definitive infarct in patients with acute stroke, it takes only a few minutes to acquire and evaluate perfusion scans. The major drawback of dynamic CT is that only a single or a few sections of perfusion scans can be acquired (a whole-brain CBF map can be obtained only by electron-beam CT [23]). Nevertheless, dynamic CT CBF maps of one to three (median 1.8) perfusion sections had a sensitivity of 94% when predicting infarction. In a similar study including 28 infarcts in 32 patients, Koenig et al (24) used a single perfusion section and found a sensitivity of 89% using the CBF map. Their finding that only three smaller infarcts were not predicted by the single-section technique corresponds to our experience.
Because of the above-mentioned influences that prevent precise calculation, the CBF image from bolus-tracking CT can be used only as a relative CBF map, except for the use of a 14-gauge central-vein catheter. Therefore, some uncertainty remains in low-flow areas regarding whether flow is less than15 mL/100 g/min and whether infarction occurs. Our findings of patients with acute stroke show that loss of only approximately 50% to 60% (in our group of moderate flow reduction) of CBF leads to infarcts in more than half of the cases and loss of more than 70% leads to infarctions in all cases. This is consistent with SPECT data (25). Therefore, the exact and absolute values of CBF seemed of minor relevance in our study. The CBF map represents only a measurement at one point in time and does not reveal changes before and after perfusion imaging. Accordingly, Heiss et al (8), who conducted a positron emission tomographic study, reported that final infarct size depends more on spatial extension than on severity of hypoperfusion but also on recanalization (by systemic fibrinolysis). Flow rates of less than approximately 5 mL/100 g/min might not be differentiated from zero flow in CT-CBF maps, because such low flow would be covered by the noise of the time-density curve.
Acute stroke is usually diagnosed by neurologic examination only. Although clinical symptoms are very sensitive to cerebral ischemia, they are nonspecific. The results of dynamic CT perfusion imaging were negative in cases of seizures, transient ischemic attacks, migraine, and also lacunar infarction; the latter was caused by poor signal-to-noise ratio and therefore low spatial resolution in the white matter. However, microangiopathic lesions may not require instantaneous and invasive therapy. Small gyral infarctions were detected by the CBF maps in more than half the cases. Large territorial infarcts, which are of main therapeutic relevance, were predicted by the CBF maps with a sensitivity of 100%. The specificity for predicting infarction can be raised to 100% (this specificity is reported by Koenig et al [24]), but only when severe CBF reduction is considered; the sensitivity then decreases.
ECTS of ischemia on plain CT scans reflect intracellular edema and are specific but not sensitive for stroke at an early stage. They show existing irreversible infarction within 2 hours of ischemic stroke (19, 20) but do not show tissue at risk. Late and ongoing therapy studies with IV fibrinolysis (1–3), radical scavengers (RANNTAS) (26), and calcium antagonists (27–29) have been conducted without proof of insufficient brain perfusion, and for that reason, some might have failed (another problem of most of the neuroprotective studies is that they are not combined with recanalization). Large fresh infarctions detected by conventional CT are contraindications for fibrinolysis, because they indicate a high risk of hemorrhage (3). Our study results confirmed that the presence of ECTS on conventional CT scans is very specific for the presence of infarction. Our findings did not clarify whether normal CT density excludes irreversible infarction at the time of examination. It is still unclear how ECTS correspond to diffusion hindrance as revealed by MR imaging, because signal increase in diffusion-weighted imaging (drop of the apparent diffusion coefficient) is at least partially reversible. The higher incidence of ECTS in the basal ganglia can be explained by the time course of embolization, which first spreads to the perforators of the main stem of the MCA and later migrates into the MCA bifurcation. The low sensitivity of hyperdense vessel signs corresponds to the results of an earlier study (21).
Even on our baseline dynamic contrast-enhanced CT scans, larger areas of impaired brain circulation were visible. The CBF maps predicted the extent of infarction better than ECTS. In studies using MR perfusion and diffusion-weighted imaging (12–16), the definite infarct volume ranged between the lesion volumes of diffusion-weighted (smaller) and perfusion-weighted (larger) maps. This finding could be due to a higher sensitivity of diffusion images to early infarction (compared with ECTS) or to less specificity of the kind of MR perfusion imaging used. The CBF maps are very reliable for perfusion deficits, if a good contrast bolus can be obtained and if patient movement within the 20 seconds of bolus passage is limited. Image quality can be impaired in patients with cardiac failure. Koenig et al (24) reported that perfusion CT provided almost the same results as did SPECT for 18 patients with acute stroke. The CBV maps in acute thrombosis or embolism of brain arteries are much less sensitive, because the lower relative loss of CBV (to approximately half of normal) compared with CBF (down to zero) provides less image contrast. Calculated CBV also falls to zero only in regions of very low perfusion. This is not because of a real decrease in blood-containing vessel volume but because of a failure of contrast enhancement of the blood in the case of no flow. Nevertheless, there were slightly fewer false-positive findings in the CBV map. The CBV map is also least sensitive to motion artifacts. CBV mapping can be performed not only of a single section but also of the whole brain, if a prolonged contrast bolus is used during helical brain scanning (30). Peak time images reveal highly sensitive time delays or intrinsic artifacts (the contrast peak disappears in the noise of the time-density curve) in cases of acute cerebral low perfusion. It is more difficult to interpret findings in the white matter, because perfusion is less than half that of the gray matter and is normally delayed. Consequently, it contains more artifacts. Peak times are delayed in chronic high-grade stenosis of the common or internal carotid, subclavian, or vertebral artery or the brachiocephalic trunk (31); CBF is normal or slightly reduced, and CBV is mildly elevated. Delayed TTP but normal perfusion could also be a remaining sign of recanalized embolization or collateralization.
Dynamic CT caused a radiation skin dosage of 0.6 Gy, as measured by a phantom from the Siemens research group. The lens of the eye was always outside the dynamic CT section in our study. The exposure dosage of the lens was calculated to be 30 mGy, which is 3% of the threshold for cataract development (32). Each perfusion section requires its own contrast bolus. Unlike ionic iodinated contrast medium, non-ionic contrast media do not increase infarction size in rats (33). Nevertheless, even with our regimen of one to three sections, we used less contrast medium on average(90 mL) than would be necessary for CT angiography. Assessment of the whole brain for perfusion imaging by IV injection of a single bolus of contrast medium seems to be a promising new development with CT scanners equipped with multiple detector rings.
Mismatch of regions with ECTS (ie, definitive infarction and regions with CBF decrease) could help in the selection of suitable patients for therapy. For example, dynamic CT perfusion imaging could help to determine whether IV fibrinolysis, angiography and intraarterial recanalization, heparinization, neuroprotective medication, hypothermia, or early decompression craniotomy is indicated. Berrouschot et al (34) determined that SPECT could predict infarction on a more accurate basis than could neurologic scores and that SPECT had greater sensitivity than did conventional CT. SPECT could also predict malignant infarction and fatal outcome. For these reasons, SPECT perfusion scanning was suggested for selecting patients for early decompressive hemicraniotomy and hypothermia (34). Jansen et al (35) showed that tissue at risk, defined by MR perfusion-weighted imaging that exceeded tissue with diffusion disturbance, could be salvaged by recanalization. Ueda et al (25) reported that ischemic tissue with CBF greater than 55% of cerebellar flow can be salvaged with recanalization (by intraarterial thrombolysis) even after 6 hours, brain tissue with CBF greater than 35% of cerebellar flow may be saved within less than5 hours, and tissue with CBF less than 35% of cerebellar flow is at risk for hemorrhage. Accordingly, normal conventional CT and relevant decreased CBF with dynamic CT could provide for a more flexible therapeutic time window for stroke treatment.
Conclusion
Dynamic CT perfusion imaging is feasible in any clinic with a third-generation CT scanner (even without spiral CT capability). Single-section CBF maps predicted all territorial infarcts of volumes larger than 10 mL. CBF images were superior to CBV images in sensitivity and superior to TTP images in specificity. This method showed that infarction will occur in all vascular territories where loss of perfusion is more than 70% and in more than half of the cases when perfusion losses are between 40% and 70%.
Appendix: Calculation of CBF, CBV, and TTP
 where brain = cerebral tissue parameter, max = maximum of the slope, blood = intravasal reference, peak = peak of the time-density curve, native = before contrast enhancement, arrival = time of first arrival of contrast medium, and section = enhancement in the section.
Acknowledgments
We thank Prof. K. Tatsch, Clinic of Nuclear Medicine, for reading the manuscript, J. Benson, Department of Neurology, for copyediting, A. Crispin, Institute of Medical Informatics, for statistical counseling, and D. Lauffer, Media Department, for arranging the image tables.
Footnotes
↵1 Address reprint requests to OA Dr. med. Thomas E. Mayer, Abteilung Neuroradiologie, Klinikum Grosshadern, Ludwig Maximilians Universität, 81377 München, Germany.
References
- Received November 29, 1999.
- Accepted after revision February 28, 2000.
- Copyright © American Society of Neuroradiology
In this issue


Jump to section
Related Articles
Cited By...
- Focal Hypoperfusion in Acute Ischemic Stroke Perfusion CT: Clinical and Radiologic Predictors and Accuracy for Infarct Prediction
- Whole-brain Volume Perfusion Computed Tomography: Acquisition Techniques and Radiation Dose
- CT Perfusion in Acute Lacunar Stroke: Detection Capabilities Based on Infarct Location
- Perfusion Deficits and Mismatch in Patients with Acute Lacunar Infarcts Studied with Whole-Brain CT Perfusion
- Imaging and Treatment of Patients with Acute Stroke: An Evidence-Based Review
- Imaging Recommendations for Acute Stroke and Transient Ischemic Attack Patients: A Joint Statement by the American Society of Neuroradiology, the American College of Radiology, and the Society of NeuroInterventional Surgery
- CT Brain Perfusion Protocol to Eliminate the Need for Selecting a Venous Output Function
- CT perfusion improves diagnostic accuracy and confidence in acute ischaemic stroke
- Perfusion CT in Acute Ischemic Stroke: A Qualitative and Quantitative Comparison of Deconvolution and Maximum Slope Approach
- Evaluation of CT Perfusion in the Setting of Cerebral Ischemia: Patterns and Pitfalls
- Fetal Origin of the Posterior Cerebral Artery Produces Left-Right Asymmetry on Perfusion Imaging
- Sixty-Four-Section Multidetector CT Angiography of Carotid Arteries: A Systematic Analysis of Image Quality and Artifacts
- Pharmacologic Interventions for Stroke: Looking Beyond the Thrombolysis Time Window Into the Penumbra With Biomarkers, Not a Stopwatch
- 320-slice CT neuroimaging: initial clinical experience and image quality evaluation
- Theoretic Basis and Technical Implementations of CT Perfusion in Acute Ischemic Stroke, Part 2: Technical Implementations
- Perfusion CT in Patients with Acute Ischemic Stroke Treated with Intra-Arterial Thrombolysis: Predictive Value of Infarct Core Size on Clinical Outcome
- Can the Ischemic Penumbra Be Identified on Noncontrast CT of Acute Stroke?
- Neuroimaging applications of multislice CT perfusion
- Reproducibility of Quantitative CT Brain Perfusion Measurements in Patients with Symptomatic Unilateral Carotid Artery Stenosis
- Perfusion-CT Assessment of Infarct Core and Penumbra: Receiver Operating Characteristic Curve Analysis in 130 Patients Suspected of Acute Hemispheric Stroke
- Visual evaluation of perfusion computed tomography in acute stroke accurately estimates infarct volume and tissue viability
- Brain imaging using multislice CT: a personal perspective
- Reborn Workhorse, CT, Pulls the Wagon Toward Thrombolysis Beyond 3 Hours
- Parametric Perfusion Imaging With Contrast-Enhanced Ultrasound in Acute Ischemic Stroke
- Trial Design and Reporting Standards for Intra-Arterial Cerebral Thrombolysis for Acute Ischemic Stroke
- Perfusion CT: a worthwhile enhancement?
- Guidelines and Recommendations for Perfusion Imaging in Cerebral Ischemia: A Scientific Statement for Healthcare Professionals by the Writing Group on Perfusion Imaging, From the Council on Cardiovascular Radiology of the American Heart Association
- CT or MRI for Imaging Patients with Acute Stroke: Visualization of "Tissue at Risk"?
- MOSAIC: Multimodal Stroke Assessment Using Computed Tomography: Novel Diagnostic Approach for the Prediction of Infarction Size and Clinical Outcome
- Comparison of Admission Perfusion Computed Tomography and Qualitative Diffusion- and Perfusion-Weighted Magnetic Resonance Imaging in Acute Stroke Patients