
Abstract
BACKGROUND AND PURPOSE: Previously reported quantitative parameters for the magnetization transfer ratio (MTR) do not give identical results, which can limit their ability to differentiate normal from diseased tissue and render them vulnerable to variations among MR systems. Our purpose was to systematically study different MTR metrics; propose a new MTR histogram parameter, AMTR2/3; and compare AMTR2/3 with existing parameters in a study of multiple sclerosis (MS).
METHODS: Seven conventional MTR parameters were proposed: global and mean MTR; peak height and position of the histogram; and percentiles MTR25, MTR50, and MTR75. Additionally, we investigated a parameter, AMTR2/3, to indicate the normalized pixel count (area under the histogram curve) inside the band size of two-thirds MTR histogram peak height. All parameters were measured in 10 patients with relapsing-remitting MS (group A), 10 healthy control subjects from the same imaging center as that of patients (group B), and four healthy control subjects from an outside institution (group C). Comparison of findings was performed between groups A and B to assess the discriminating ability of MTR parameters and groups B and C to evaluate intersystem variations.
RESULTS: All MTR parameters differed between groups A and B, but the difference was significant for only global MTR, mean MTR, MTR25, and AMTR2/3. With the exception of AMTR2/3, all parameters differed significantly between the two control groups.
CONCLUSION: AMTR2/3 is less sensitive to MR imaging system variations than are other MTR parameters and was most effective in differentiating patients with MS from healthy control subjects. This finding supports the use of AMTR2/3 in multicenter MT MR imaging studies of MS.
Magnetization transfer (MT) imaging is now a well-recognized MR imaging technique for studying various brain diseases. For example, in its application to the study of multiple sclerosis (MS), MT MR imaging provides quantitative information about microscopic and macroscopic lesion burden, with some specificity for the most destructive aspects of MS (1, 2).
The first step in the quantitative analysis of MT MR imaging data is the calculation of the MT ratio (MTR). When this technique was initially developed, MTR values were obtained from regions of interest, which allowed the study of individual lesions and of discrete areas of brain tissue (3). Currently, MTR values are calculated on a pixel-by-pixel (or voxel-by-voxel) basis from a large area of brain tissue or from the entire brain parenchyma (4). With the current method, the histogram of MTR values is calculated for a more objective, global, and automated analysis of brain tissue.
To perform quantitative MTR histogram analysis, we applied several histogram parameters that have been proposed in the literature. Figure 1 shows the most frequently used parameters. These include the peak height and peak position of the histogram; the mean MTR; and the MTR values corresponding to the 25th (MTR25), 50th (MTR50), and the 75th (MTR75) percentiles of the histogram, which indicate the MTR at which the integral of the histogram is 25%, 50%, and 75% of the total, respectively. All of these MTR metrics can be used to differentiate patients with MS from healthy control subjects (4, 5). They are correlated with the clinical manifestations of MS (5, 6) and are sensitive to the accumulation of disease burden over time (7). However, values obtained from established MTR parameters vary, and debate persists regarding which is the optimal histogram-derived parameter for large-scale, multicenter MS studies that require a tradeoff between sensitivity to disease-related changes and intersystem variability in measurements (4, 5, 8). The purpose of our study was to systematically investigate MTR histogram metrics and to propose a new histogram parameter, AMTR2/3.
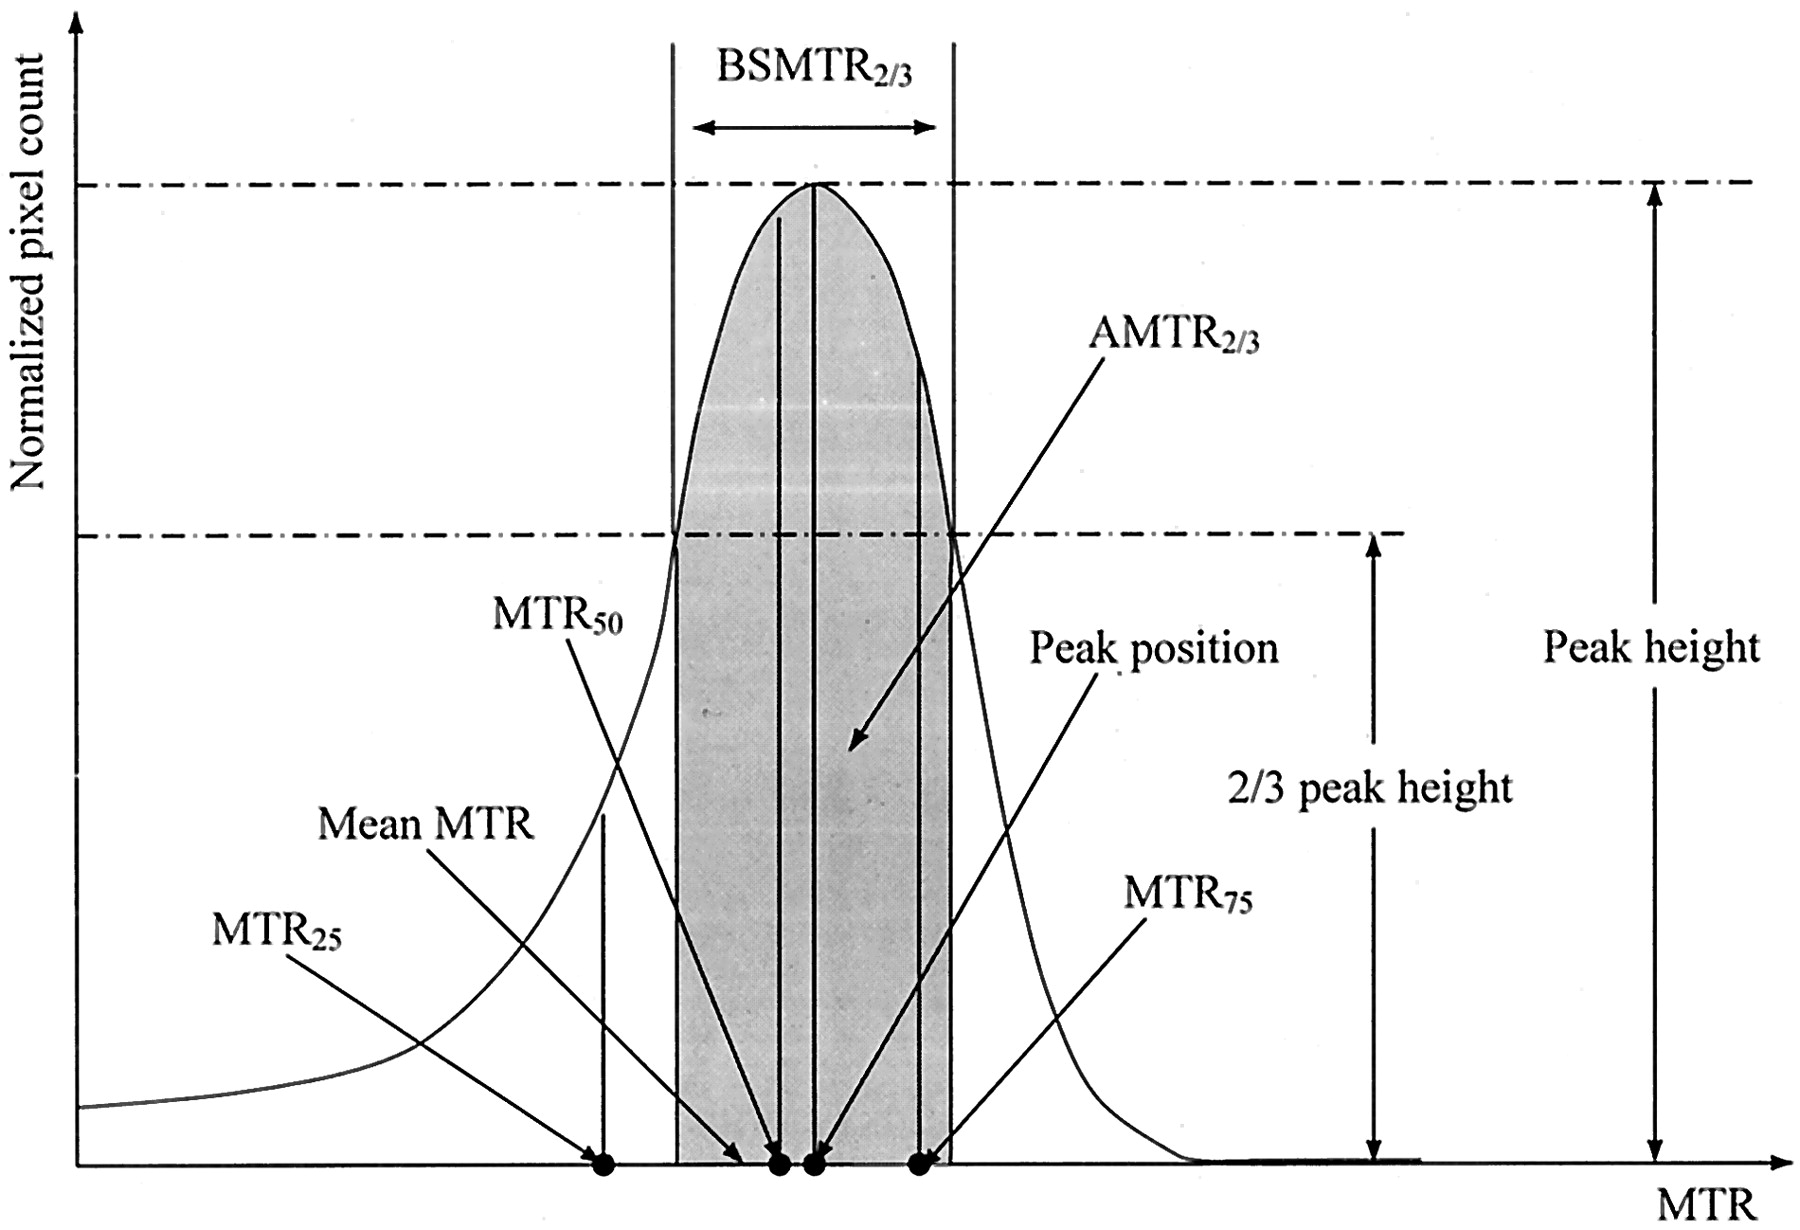
Graphical representation of the MTR histogram–derived parameters used in this study.
Methods
Participants
We examined 10 patients (group A, six women and four men) with relapsing-remitting MS (9). Mean age ± SD was 38.5 ± 9.2 years, mean duration of disease was 6.5 years (range, 1–15 years), and mean Expanded Disability Status Scale score (10) was 2.2 (range, 1.5–4.0). No patient had relapses or steroid treatment in the 3 months preceding study initiation. Ten healthy volunteers from the same imaging center (group B, seven women, three men) served as control subjects. Mean age was 33.5 ± 3.6 years. All subjects provided written informed consent.
To assess changes in the MTR histogram due to variation among MR imaging units, we examined four healthy control subjects (group C, one woman and three men). These subjects underwent MR imaging at another imaging center. Their mean age was 29.3 ± 8.2 years.
In groups A and B, cranial MR images were obtained by using a 1.5-T MR imaging unit (Magnetom Vision; Siemens Medical Systems, Erlangen, Germany). During a single imaging session, the following sequences were performed without moving the subject from the imager: 1) dual-echo turbo spin-echo (TSE) (TR/TE/NEX, 3300/16–98/1; echo train length, 5); 2) T1-weighted conventional spin-echo (TR/TE/NEX, 768/15/2); and 3) 2D gradient-echo (GE) (TR/TE, 640/12; flip angle, 20°) first with and then without an MT saturation pulse. (The latter was an off-resonance radio-frequency pulse centered 1.5 kHz below the water frequency with a Gaussian envelope of duration of 7.68 ms and a flip angle of 500°.) Twenty-four contiguous axial sections were acquired with a 5-mm section thickness, a 256 × 256 matrix, and a 250-mm field of view, giving an in-plane spatial resolution of approximately 1 × 1 mm. The sections were positioned parallel to a line joining the most inferoanterior and inferoposterior parts of the corpus callosum (11).
Subjects in group C underwent 2D GE imaging with the same type of 1.5-T MR imaging unit (Magnetom Vision) and parameters (TR/TE, 650/15; flip angle, 20°; first with and then without MT saturation pulse [off-resonance resonance radio-frequency pulse centered 1.5 kHz below the water frequency; Gaussian envelope of duration, 7.68 ms; and flip angle, 500°]) as those used in the other control group. Thirty-two contiguous axial sections were acquired with a 3-mm section thickness, a 256 × 256 matrix, and a 250-mm field of view, giving an in-plane spatial resolution of approximately 1 × 1 mm. The sections were positioned parallel to a line joining the most inferoanterior and inferoposterior parts of the corpus callosum.
Image Postprocessing
For each subject, only 10 central sections (groups A and B) or 18 central sections (group C) were postprocessed; these represented an axial slab of brain tissue with 5- or 5.4-cm thickness, respectively. This brain volume was chosen to minimize the inclusion of extracerebral tissue in the histogram (4). Two GE images, one with and one without a saturation pulse, and two TSE images (groups A and B) obtained at the same position as that of corresponding GE images were first registered. Then, an automatic segmentation algorithm based on a k-Nearest-Neighborhood (k-NN) clustering method was applied to the TSE images (group A and B) or to the GE images (group C) to remove hypointense pixels, such as those for background noise and bone. An image-processing technique of mathematical morphology was finally performed to remove extra cerebral tissues. After postprocessing, only brain tissue (ie, white matter, gray matter, CSF, and MS lesions) was kept, and a template of each brain was created.
MTR Histogram Analysis
An MTR map corresponding to each section was created. All pixels with MTR values lower than 10% were excluded to minimize the number of residual pixels with partial volume averaging from CSF (12). To correct for the between-subject difference in brain volume, each histogram was normalized by dividing it by the total number of pixels in the brain volume under consideration. From each normalized MTR histogram, band size of two-thirds histogram peak height (BSMTR2/3) and the area under the histogram curve (AMTR2/3) were calculated. For comparison, the following MTR histogram measures were calculated: mean brain MTR, peak height, peak position, MTR25, MTR50, and MTR75. Global MTR of the brain parenchyma, which is not derived from MTR histograms, was also calculated. Global MTR was obtained by computing the mean signal intensity of the images obtained with and those without a saturation pulse corresponding to the total brain volume and then applying the MTR equation (3, 12).
MTR histograms obtained in patients with MS and healthy control subjects were visually compared. The discriminating ability of the MTR parameters was studied in terms of the mean, SD, SD/mean ratio, relative difference, and results of a two-tailed Student t test for unpaired data. Statistical significance was set at P <.001. Differences in the patient and control groups were also visually assessed by expressing an MTR histogram parameter as a function of the number of subjects.
Results
MTR histograms from patients with MS (group A) and same-center healthy control subjects (group B) had different shapes (Fig 2). The most salient changes in the patient group compared with those in the control group were a simultaneous decrease in histogram peak height and an increase in pixel counts at lower MTR values. These changes are quantitatively shown in Table 1, which also gives the quantitative assessment of the ability of each parameter to differentiate patients with MS from healthy control subjects. All MTR measurements differed between groups A and B. Moreover, all measurements except for BSMTR2/3 had lower values in group A as compared with group B. However, the MTR parameters did not yield identical results. In particular, group differences were statistically significant for only global MTR (P = .006), mean MTR (P = .006), MTR25 (P = .004), and AMTR2/3 (P <.001).

Average MTR histograms from 10 patients with MS (dotted line) and 10 healthy control subjects (solid line) obtained by using the same MR imaging unit.
MT MR imaging—derived parameters in subjects imaged with the same imaging system
Difference in shape was also observed between MTR histograms from the two control groups, B and C, that underscore variations in findings due to different MR imaging systems (Fig 3). In particular, a marked shift and an important modification in lower MTR values on the histogram were observed between groups B and C. Table 2 shows the results of further assessment of their differences observed with different MTR parameters. A significant difference between the two control groups was found for all parameters, with the exception of AMTR2/3.

Average MTR histograms from groups B (solid line) and C (dotted line), the two control groups, who were imaged with different MR imaging units.
MT MR imaging–derived parameters in control subjects imaged with different imaging systems
Distinction between the patients (group A) and the same-center control subjects (group B) based on peak height, MTR25, and AMTR2/3 is graphically illustrated in Figures 4⇓–6. Two MTR parameter curves were plotted to represent the patient (group A) and control (group B) participants. For each pair of parameter curves, an optimal MTR parameter value provided the best separation of the two groups. These values were 8.9, 36.1, and 54.7 for peak height, MTR25, and AMTR2/3, respectively.

Scatterplot of MTR histogram peak heights indicates the value that best distinguished patients with MS and the control group B.

Scatterplot of MTR25 values indicates the value that best distinguished patients from the control group B.

Scatterplot of AMTR2/3 values indicates that AMTR2/3 was the best parameter for differentiating patients from control subjects.
Discussion
Fundamental Theoretical Basis of MT Imaging
The most primary information obtained from MT imaging is the MTR map that is obtained by calculating, on a pixel-by-pixel or voxel-by-voxel basis, the contrast between two images or two volumes acquired first with and then without MT saturation. MT imaging of disease then consists of characterizing changes on the MTR map. If the MTR map is considered to be a simple 2D image or 3D volume, then many opportunities exist for exploiting such a 2D or 3D representation. Until this study, the most-explored parameter has been the histogram of the MTR map, which is measured by first counting the number of each MTR value (ie, the pixel count) and then dividing the pixel count by the total number of pixels or voxels included in the brain section or volume under consideration.
The mathematical nature of histogram analysis is the first-order probability density distribution, because a histogram is an approximation of the continuous probability density distribution in the cases of discrete images. Therefore, an implicit hypothesis of MTR histogram analysis is that the MTR map can be completely characterized by its probability density distribution. Under this assumption, MT imaging is reduced to a description of MTR histograms derived by quantitative parameters.
As shown in Figure 1, the previously proposed parameters exploit the histogram of the MTR map in a one-dimensional manner, since they all depend on one variable. The peak height parameter depends on only one MTR value. From a theoretical viewpoint, this parameter should not be used, as taking a single value of probability density distribution is illogical. Because MTR maps are discrete images, in practice we are not using a continuous probability density distribution but rather its discrete approximation; therefore, the peak height parameter can still be used. However, such a parameter is sensitive to spurious factors such as noise. The peak position and mean MTR are also of one dimension, because they depend on a single MTR value. The peak height, peak position, and mean MTR essentially describe changes of the MTR histogram at a punctual position of the horizontal axis. They can only indirectly reflect changes in pixel counts besides those of the histogram peak or mean MTR value, and they do not give any indication of changes in pixel counts at lower MTR values. Therefore, they cannot allow one to completely describe changes in MTR histograms. MTR25, MTR50, and MTR75 are a class of parameters differing from the aforementioned peak height, peak position, and mean MTR parameters, because they involve integration of the MTR histogram over an interval or band of MTR values. However, since this integration is conditioned by the area percentage, the value of MTR25, MTR50, and MTR75 depends on only the upper limit of the interval (the lower limit of the interval is always fixed at zero). Therefore, the MTR25, MTR50, and MTR75 remain at one dimension. These parameters describe only changes at lower MTR values of the MTR histogram and do not give a direct and accurate measurement of changes of pixel counts at the peak position of the MTR histogram.
Therefore, peak height, peak position, and mean MTR have a dimension of pixel counts and are sensitive to changes in the amplitude of the MTR histogram. In contrast, MTR25, MTR50, and MTR75 have a dimension of band size and are sensitive to changes in lower MTR values of the histogram. These parameters provide complementary information about the change in shape of the MTR histogram. Herein we sought to combine this complementary information by defining a new MTR histogram parameter, AMTR2/3, which accounts for both the pixel count and the band size. Such a parameter is defined as the integration of the normalized two thirds of the peak height of the MTR histogram, BSMTR2/3, as illustrated in Figure 1; the shaded area represents the area and integration from which AMTR2/3 is calculated.
AMTR2/3 is two dimensional in nature, because its value depends on both the peak height and the band of MTR values. However, unlike peak height, AMTR2/3 does not count pixels at a single MTR value but rather pixels around the peak position. Unlike MTR25, MTR50, and MTR75, the lower and upper limits of the MTR interval involved in AMTR2/3 are not fixed but conditioned by the band size corresponding to two thirds of the peak height of the MTR histogram. Therefore, AMTR2/3 simultaneously encodes information given by the parameters of peak height, peak position, and MTR values around the peak position. Owing to BSMTR2/3, AMTR2/3 also indirectly encodes information given by the MTR percentiles and is more sensitive to pixel count changes at lower MTR values than are peak height, peak position, and mean MTR.
The choice of band size corresponding to two-thirds the MTR histogram peak height in AMTR2/3 is an important issue. In general, the MTR of any tissue varies among pixels. Therefore, counting pixels at a single MTR value, as in the case of peak height or peak position, or inside a small band of MTR values, as in the case of MTR25, does not always allow one to characterize the MTR distribution of tissue in a pertinent way. At the other end of the continuum, if pixel counting is performed for the whole brain, as in the case of global MTR, or inside a large MTR band size beginning from zero, as in the case of MTR75, the information is too averaged. This effect inevitably decreases the discriminating ability of the MTR parameters. With AMTR2/3, an optimal MTR band size is involved. The decrease of the area under the histogram curve in two thirds of the peak height band size directly encodes the decrease of pixel counts around the MTR histogram peak and indirectly encodes the increase of pixels at lower MTR values.
Findings from the Present Study
The changes observed in the MTR histogram obtained in the patients with MS confirm what many researchers have found (4–6, 13, 14). However, different MTR parameters did not show the same discriminating ability. Among the previously reported parameters, peak height and MTR25 showed the largest relative difference and were therefore most sensitive to changes in the MTR histogram. This finding is consistent with theoretical definitions, as the two parameters capture changes in pixel counts at the peak location and in lower MTR values. Although peak height gave a bigger relative difference, it had a higher P value (P = .07) than that of MTR25 (P = .004) and was less discriminating than the latter (Figs 4 and 5). The same observation can apply to the comparison of P values for peak height versus other conventional parameters, such as global MTR (P = .006), mean MTR (P = .006), and MTR50 (P = .06). Peak height led to bigger SD and SD/mean values. This greater variability in peak height made it harder to differentiate patients from control subjects. These results demonstrate that peak height was sensitive to spurious variation, as expected.
The limitations of peak height, MTR25, or other conventional parameters for discriminating control and injured groups has also been observed with other MT applications. McGowan et al (15) proposed the parameter, normal white matter range (RWM), which is defined as the mean of the white matter histogram ± SD. This parameter is sensitive to changes in the amplitude of the MTR histogram, but it is a better metric than peak height or other conventional MT parameters, because it involves integration over a band size of 2 SD. Compared with AMTR2/3, RWM remains one dimensional in nature, because its band size is fixed (±SD). Greater variability of peak height compared with that of other conventional MT parameters can also be noted in early reports (8, 13, 14, 16–23). In many cases, this variability has contributed to higher P values for the peak height parameter. On the other hand, that MTR25 is more discriminating than are MTR50 and MTR75 directly demonstrates that MS can induce an important increase in pixel count at lower MTR values. The discriminating ability of MTR25, MTR50, and MTR75 degraded when the histogram integration area increased. When 75% of the total histogram area was integrated, the discriminating ability was at its worst; this can be explained by an increase in the integration area that results in an overload of information. The large relative difference given by the peak height and MTR25 clearly suggests that MS causes simultaneous changes in pixel counts around the peak position and at lower MTR values of the histogram. Furthermore, a comparison of the relative difference of the peak height and MTR25 also shows that MS leads to more marked changes in pixel count at the peak location than in pixel count at lower MTR values. Among the parameters in Table 1, peak position and BSMTR2/3 were the least discriminating. This finding implies that MTR band size alone is not sensitive to MTR histogram changes due to MS. (The peak position is a particular case in which the band size is reduced to one pixel.) In other words, the MS disease spectrum does not induce significant shifting of MTR histogram peak. Global MTR and mean MTR have an intermediate discriminating ability.
Compared with the previously reported parameters, AMTR2/3 has shown the best discriminating ability. This finding demonstrates two important points. First, AMTR2/3 preserves pixel-counting sensitivity of peak height but does not have the disadvantages of the latter with regard to spurious variations. Second, it also exhibits the ability of MTR25 for encoding changes at lower MTR values. In cases of MS, the band size of two-thirds peak height in AMTR2/3 corresponds to a histogram area in which most of the pixels belonging to normal tissue are included, whereas pixels belonging to diseased tissue are excluded. If a larger band size is used, a larger area under the histogram curve would have been involved. As a result, pixels belonging to tissue affected by MS would be mixed with those corresponding to normal tissue. Likewise, if a smaller band size is used, pixels corresponding to normal tissue would not be taken into account. In both cases, the discriminating ability of the MTR parameters decreases. Therefore, the BSMTR2/3 of AMTR2/3 makes it possible to accurately capture changes in the MTR histogram due to MS by encoding simultaneous changes in pixel counts around the histogram peak position and at lower MTR values.
The difference in MTR histograms between the two control groups, as shown in Figure 3, shows that although the acquisition conditions were comparable in the two centers (ie, same MR imaging systems and protocol), the resulting MTR histograms differed in both shape and position. This difference might have been caused by several factors, such as difference in section thickness, but identifying the different causes is no trivial task. However, our results confirm findings showing that MTR measures are highly dependent on MR imaging units (21–26). In particular, Richert et al (25) have shown that for the same subject and the same MR imaging units, upgrading software can change the MTR histogram. These changes are characterized by both a modification in the peak height and a shift in the MTR histogram. Changes in the MTR histogram across MR imaging systems can be explained from an image-processing viewpoint. Calculating MTR accounts for a first-order derivation, with the difference in discrete images corresponding to the derivation of continuous images. It is well known that derivation is sensitive to spurious variations. If two images are not acquired under the same operating conditions, even small changes in images with and those without saturation pulses can be amplified on the resulting MTR image, leading to notable changes in the MTR histogram. In a multicenter study, it is generally difficult, if not impossible, to make the acquisition conditions exactly the same; no two MR imaging systems behave identically, even if they have the same hardware and software components.
The machine-dependent character of MTR measures poses the problem of how to distinguish between MTR changes due to disease and those due to system variations. The results in Table 2 illustrate this problem. The significant differences in conventional MTR values between the two control groups demonstrate that these parameters are not suitable for use in multicenter studies of MS. For example, peak height and MTR25 gave a particularly misleading indication by providing the greatest difference between the control groups. However, this failure of peak height, MTR25, and other previously reported parameters is consistent with their one-dimensional nature. Existing parameters did not exhibit the same degree of failure. In particular, peak height gave a result better than that of other parameters. This indirectly implies that MTR histogram changes due to variation in MR imaging systems do not induce significant changes in pixel counts at the peak position of the histogram. That is, variation in MR imaging systems is not characterized by a decrease or increase in the number of pixels at the position of the histogram peak. This finding is somewhat consistent with that reported by Richert et al (25), which showed that the difference between the two MTR histograms in the same healthy control subject is characterized by clear MTR histogram shift on the MTR value axis. This MTR shifting can also be reflected in the large difference in the parameter peak position in Table 2.
Comparing the values of peak height in Tables 1 and 2 shows that the peak height is a better solution among the bad ones. We also note that the global MTR and mean MTR always exhibited intermediate performance. That the greatest difference was observed with MTR25 indicates that the modification of pixel counts at lower MTR values is an important characteristic of changes in the MTR histogram due to variations in MR imaging systems. Therefore, this variation induces not only shifting of MTR histograms but also substantial modifications in the MTR histograms at lower MTR values. As expected, these histogram modifications in the MTR histograms occurred with lower MTR values and these changes cannot be well described with existing MTR parameters. For example, histogram changes due to MS and system variations are all characterized by increased pixel count at lower MTR, MTR25 and thus do not allow one to distinguish between patients with MS and healthy control subjects. In contrast, because the pixel counts at the peak position of the MTR histogram change significantly in patients with MS but little in control subjects, peak height is a more convenient parameter. Unfortunately, as explained earlier, peak height was sensitive to spurious variations; therefore, it did not provide the expected results of discrimination. The problem of stability with peak height can also be seen in its large SD/mean values (Table 2). On the contrary, the best performance was obtained with AMTR2/3; this parameter was less affected by intersystem variability than were all other MTR parameters and maintained good ability in discriminating between patients and control subjects. This is not surprising; AMTR2/3 integrates the histogram around a peak position and is therefore less sensitive to shifting of MTR histograms. Compared with peak height, which can be unsteady because it corresponds to pixel counts at a single MTR value, AMTR2/3 is more stable because of correspondence to an integrated value within an interval of MTR values.
The design of the present investigation imitates that of a multicenter MR imaging trial in which subjects are imaged with different MR imaging systems at individual centers and in which a range of acquisition parameters is allowed for a given sequence. Therefore, we were not assessing pure intersystem variability, which is done by imaging the same group of control subjects with two MR imaging units and by using the same acquisition parameters. For this reason, interindividual and intersequence variations might have contributed to the observed differences in MTR parameters between the two control groups. However, because these variations correspond to practical situations in multicenter studies, our results reinforce the applicability of AMTR2/3 as a potentially useful MTR parameter for the study of MS.
Conclusion
The previously proposed MTR parameters differ in terms of both sensitivity to MS-related abnormalities and susceptibility to intersystem variations in healthy control subjects. Although peak height and MTR25 are sensitive to changes due to MS, they do not allow one to distinguish these changes from those due to variations in MR imaging systems. The new MTR histogram parameter AMTR2/3 seems to achieve the best trade-off between good discriminating ability and acceptable intersystem variability. This finding supports its use as a comprehensive, histogram-derived metric for the analysis of data in multicenter studies of MS monitored with MT MR imaging. Further clinical validation in larger subject databases and of clinical measures are the topics of our ongoing studies.
Acknowledgments
The authors would like to thank Mrs. M.P. Réthy, Medical Library, Hospital of Neurology of Lyon, for her technical assistance.
Footnotes
L.Q.Z. supported by the French Ministry, Ministere de l’Education Nationale, de la Recherche et de la Technologie, with grant Bourse post doctorant etranger. This work also partially support by the Region Rhone-Alpes under grant Ademo. J.G. supported by grants from the Hospices Civil de Lyon and the Centre National de la Recherche Scientifique.
References
- Received April 9, 2003.
- Accepted after revision February 18, 2004.
- Copyright © American Society of Neuroradiology


