
Abstract
BACKGROUND AND PURPOSE: Studies to determine the value of noninvasive neurovascular studies for the effectiveness of treatment and long-term follow-up of dural arteriovenous fistulas (AVFs) are of clinical importance. We determined whether the serial changes of carotid duplex sonography (CDS) were correlated with the evolution of dural AVF status after treatment or follow-up.
METHODS: Four parameters of CDS were studied in two groups of patients with dural AVF: resistance index, end diastolic velocity, peak systolic velocity, and flow volume of the external carotid artery (ECA). The first group included 13 patients who received endovascular therapy, the efficacy of which was determined by the results of postembolization angiography. In the second group, 16 patients received only clinical and CDS follow-up. Evolution of clinical symptoms was recorded and classified as deteriorating, stationary, or improving. Patients underwent CDS before and after treatment (group 1) or at long-term follow-up (group 2).
RESULTS: In the first group, the resistance index of the ECA increased in patients with occluded or nearly occluded dural AVF after embolization (n = 7, P = .01), but it did not change significantly in patients with partial treatment (n = 6, P = .11). Of patients with occluded or nearly occluded dural AVF after embolization, the ECA resistance index increased in patients with noncavernous sinus dural AVF (n = 5, P = .003) but not in patients with cavernous sinus dural AVF (n = 2, P = .48). In the second group, CDS parameters—particularly the resistance index—were well correlated with clinical status during follow-up.
CONCLUSION: The resistance index of the ECA is correlated with the effectiveness of treatment and clinical evolution of dural AVF.
Recurrence of arteriovenous communication after incomplete treatment of dural arteriovenous fistulas (AVF) is common (1). Because a dural AVF usually consists of many feeding arteries with multiple anastomoses between feeders, flow recruitment in untreated arteries after partial therapy has been mentioned as a possible cause of recurrence (1–5). Therefore, the effectiveness of treatment for dural AVF is important. However, to our knowledge, no group has reported on use of noninvasive neurovascular studies in patients with dural AVF to evaluate the effectiveness of treatment.
Dural AVF may recur, even after apparent complete obliteration of the malformation (6–10), and the feeding arterial supply may also change during follow-up after partial treatment or in the absence of therapy (6, 11, 12). Long-term follow-up is therefore mandatory in patients with dural AVF, but because of its invasiveness, conventional cerebral conventional angiography is not optimal in this regard. Sonography has been suggested for annual follow-up to detect possible hemodynamic changes associated with dural AVF (6, 11, 13). However, we found no studies in which the follow-up results of carotid duplex sonography (CDS) were correlated with the status of dural AVFs.
Some Doppler hemodynamic characteristics of the feeding arteries have been used to evaluate intracranial arteriovenous shunt surgery; these characteristics include reduced flow resistance (14–23), increased flow volume (14–18, 24, 25), increased systolic flow velocity (13–15, 22, 25–27), and increased diastolic flow velocity (14, 25, 26). Patients with dural AVF also had shorter sonographic cerebral circulation time than that in normal subjects (28). However, the use of CDS in patients with dural AVF is still unpopular, despite its noninvasiveness, likely because of the limited number of reports describing the relationship between CDS results and AVF status. To determine the role of CDS in evaluating the effectiveness of treatment and in long-term follow-up of patients with dural AVF, we determined whether the serial changes on CDS were correlated with the evolution of dural AVF status after treatment or at follow-up.
Methods
Study Design and Patients
Patients Receiving Embolization (Group 1)—
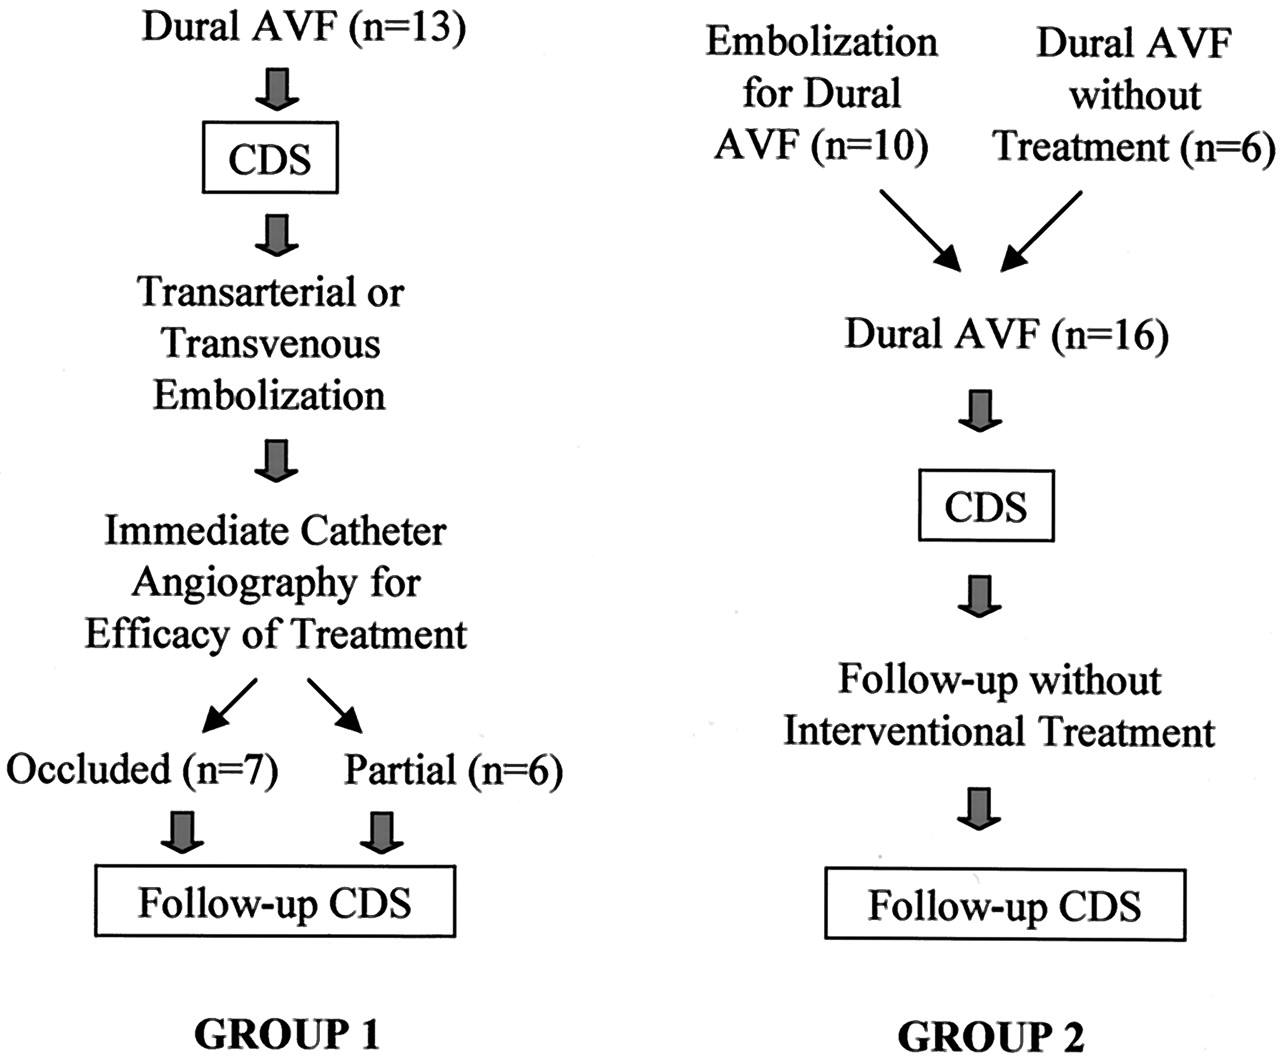
The present study comprised two parts, as shown in Figure 1. The first part included the first population of 13 adults with intracranial dural AVF confirmed on conventional angiography (group 1). These patients received transarterial or transvenous embolization of their fistulas between October 1997 and August 2003. The dural AVFs were located in the cavernous sinus (n = 3), sigmoid sinus (n = 3), torcular herophili (n = 3), transverse sinus (n = 2), base of the brain (n = 1), or brain convexity (n = 1). Feeding vessels of all dural AVFs included branches from the external carotid artery (ECA). Transarterial embolization was carried out through the ECA; the coil was inserted into the dural sinus around the fistulas in patients who underwent transvenous embolization. The efficacy of embolization was determined by performing conventional angiography immediately after the intervention. Patients were classified into one of two groups: those with occlusion and those with partial treatment. Those in whom postembolization angiograms showed total elimination of the AVF or minimal residual dural AVF were assigned to the occluded group, while those who belonged to the partial treatment group still had obvious residual dural AVF. CDS was carried out in each patient before and after embolization. The interval between treatment and postembolization CDS was less than 1 week, except in three patients, who had intervals of 13, 27, and 50 days.

Algorithm of the study groups.
Patients with Follow-Up (Group 2)—
The second part of the study included the second population of 16 patients with intracranial dural AVFs confirmed on conventional angiography (group 2). They did not receive interventional treatment for their AVFs during follow-up. Their dural AVFs were located in the sigmoid sinus (n = 4), transverse sinus (n = 4), cavernous sinus (n = 3), torcular herophili (n = 2), base of the brain (n = 2), or superior sagittal sinus (n = 1). Feeding arteries of all AVF included the ECA. They had pulsatile tinnitus (n = 13) or chemosis or proptosis (n = 5). These patients underwent CDS study twice within an interval of 1–21 months (median, 6 months). Ten patients (63%) had received embolization therapy before their first CDS study. According to evolution of symptoms during follow-up, the outcome of these patients was categorized as deteriorating, stationary, or improving.
Patients from both groups provided informed consent.
Using the Cognard method (11), we classified dural AVFs into five types based on their venous drainage pattern as follows: type I indicated drainage into a sinus with normal antegrade flow; type II, drainage into a sinus with retrograde venous drainage into the sinus or sinuses (type IIa), with retrograde venous drainage into cortical vein or veins (type IIb) or with retrograde venous drainage into the sinus and cortical vein or veins (type IIa+b); type III, drainage directly into a cortical vein without venous ectasia; type IV, drainage into a cortical vein with venous ectasia larger than 5 mm in diameter and three times larger than the diameter of the draining vein; and type V, drainage into spinal perimedullary veins.
CDS Study
CDS study was performed by using either a 3–11-MHz real-time B-mode imaging transducer and a 3.6-MHz pulsed Doppler transducer (HP 4500; Hewlett-Packard Company, Palo Alto, CA) or a 10-MHz real-time B-mode imaging transducer and a 6-MHz pulsed Doppler transducer (Diasonic VST Master; Diasonics, Tirat Carmel, Israel). Arterial diameters, peak systolic velocity (PSV), end-diastolic velocity (EDV), time-averaged velocity, resistance index (RI), and flow volume of the extracranial ECA were measured. RI was defined as follows: (PSV−EDV)/PSV. The flow volume was automatically calculated as the product of the time-averaged velocity and the cross-sectional area.
We used four parameters—RI, EDV, PSV, and flow volume of the ECA (14)—to analyze sonographic pretreatment and posttreatment changes in patients in the first population and to analyze changes during follow-up in the second population. CDS results from bilateral ECA were obtained. We analyzed data from the side of the ECA with greater change values. In patients receiving transarterial embolization in one (right or left) ECA, however, we evaluated the ECA in which embolization was performed. We used only CDS results for the ECA because the sensitivity for detecting dural AVFs by using parameters related to the internal carotid artery were considered to be less than 30% (14). Those performing the CDS study were blinded to the clinical condition of each patient.
Statistical Analysis
A Fisher exact test was used to determine differences in categorical data between groups. The t test or analysis of variance was used to determine differences in age and baseline CDS data. The pair t test was applied to determine differences in CDS data between the two serial CDS studies. Two-sided P values of less than .05 were considered to indicate a statistically significant difference. SPSS software (version 10.0; SPSS, Chicago, IL) was used for the statistical analyses.
Results
Patients Receiving Embolization (Group 1)
Table 1 shows the characteristics of 13 patients with dural AVF who received embolization treatment. We found no difference in patient age or sex or in the location or type of dural AVF between the occluded and partial-treatment groups. In addition, CDS data obtained before embolization in the occluded group were not different from those in partial-treatment group for the parameters of RI (P = .88), EDV (P = .58), PSV (P = .64), and flow volume (P = .3).
Characteristics of patients and dural AVFs
Table 2 shows the results of CDS before and after embolization in the series of 13 patients with dural AVF. In those with total or nearly total elimination of the dural AVF (n = 7), RI increased and EDV decreased significantly after embolization (P < .02). In patients with partial treatment (n = 6), however, RI and EDV data before embolization were not significantly different from those obtained after embolization (P > .1). In both the occluded and partial-treatment groups, PSV and flow volume did not change significantly after treatment. When we subdivided patients in the occluded group by the location of their dural AVF, patients with a cavernous sinus dural AVF (n = 2) did not have different RI values between the two CDS studies (P = .48), whereas patients with a noncavernous sinus dural AVF (n = 5) had increased RI values (P = .003) after embolization.
Results of carotid duplex sonography before and after embolization of dural AVF
Patients with Follow-Up (Group 2)
Table 1 also summarizes the characteristics of the 16 patients in group 2 who received follow-up studies. We observed no difference in patient age or sex or in the location or type of dural AVF between the three groups of patients (e.g., those with deteriorating, those with stationary, and those with improving AVFs). In addition, CDS data at baseline did not show differences between these groups in terms of RI (P = .81), EDV (P = .71), PSV (P = .13), and flow volume (P = .35).
Table 3 shows the results of the two CDS studies for the 16 patients who were followed up but not treated. Of the patients with deteriorating clinical symptoms (n = 6), RI decreased and EDV, PSV, and flow volume increased significantly during follow-up (P < .05). In patients with a stationary clinical condition (n = 7), CDS results for RI, EDV, PSV, and flow volume at baseline were not different from those obtained after follow-up. In patients with improving clinical symptoms (n = 3), RI increased significantly during follow-up (P = .009), whereas EDV, PSV, and flow volume did not differ between the two CDS studies. Analyzing the changes of the ECA RI values in dural AVF patients by clinical status, we found that RI decreased by 0.1 in five (83%) of six patients with clinical deterioration. The RI increased by 0.1 in all three patients with clinical improvement and changed by less than 0.1 in six (86%) of seven patients with a stationary status.
Results of carotid duplex sonography at baseline and after follow-up in patients with dural AVF
Discussion
Incomplete treatment in patients with dural AVF may lead to an increase in arterial supply in residual feeding arteries (1–5). Total elimination of arteriovenous communication has been suggested when aggressive therapy is indicated for dural AVF (11, 29). After dural AVF are treated, the effectiveness of therapy may provide information to predict possible future recurrence of arteriovenous shunt surgery and to consider further AVF management. In this study, patients with occluded and nearly occluded dural AVF after embolization had significantly increased ECA RI values and decreased ECA EDV values after treatment compared with their pretreatment data. Similar findings were not found in patients who received partial treatment. Using CDS, we conclude that we can evaluate the effectiveness of treatment immediately after intervention for dural AVF.
Long-term follow-up is mandatory in patients with dural AVF. Cognard et al (6) reported two cases of dural AVF in which the venous drainage changed from benign to aggressive during follow-up; increased flow in their feeding arteries was detected on sonography. Satomi et al (7) followed up 50 patients with dural AVF by means of conventional angiography; five patients had an alteration in the venous drainage pattern. New dural AVF may develop in patients with or without management of previous fistulas (6, 10, 30), and dural AVF may also close spontaneously without aggressive intervention (31). We found a good correlation between serial ECA RI change and the evolution of clinical symptoms related to dural AVF. Because of the convenience, noninvasiveness, and reproducibility of CDS, we suggest annual sonographic follow-up with an emphasis on the RI of the ECA in patients with dural AVF. A change in the ECA RI of 0.1 or more during CDS follow-up is well correlated with the patient’s clinical status.
In a previous report (14), the RI of the ECA (cutoffs: right, 0.72; left, 0.71) yielded a sensitivity of 74% and a specificity of 89% for predicting dural AVF. In this study, the ECA RI was also the best parameter to evaluate dural AVF status. The RI of the ECA can be used to evaluate the effectiveness of treatment and the status of dural AVF during long-term follow-up, as well as to screen for dural AVF.
The RI of the ECA did not change significantly in patients with a cavernous sinus dural AVF, even after total or nearly total elimination of the shunts, as it did in patients with a noncavernous sinus dural AVF. The sensitivity of CDS in depicting dural AVF by using the ECA RI was also different between studies of cavernous sinus AVF (54%) and of noncavernous sinus AVF (86%) (14). Arteriovenous shunting in cavernous dural AVF is usually small and has relatively low flow velocity; therefore, hemodynamic changes related to this kind of fistula may not be detectable in the upstream region, such as the ECA. In patients with cavernous sinus dural AVF, we should follow up their AVF status with not only CDS but also color Doppler flow imaging of the superior ophthalmic vein (16, 17).
CDS still has limitations in the evaluation of dural AVFs. For instance, it depicts only the hemodynamic change in their feeders without showing the actual size and patterns of the venous drainage. In patients with recurrent symptoms related to dural AVF or deterioration of CDS results (e.g., lowering of the ECA RI during follow-up), conventional angiography is still necessary to delineate the status of the AVF. In our study, we categorized the patients in the follow-up series by their clinical symptoms, and that approach may have introduced categorical bias. Lastly, we did not analyze the data between the subgroups because the number of patients was relatively small.
Additional large, prospective studies with angiographic categorization are necessary to delineate the correlation between the evolution of dural AVF and the results on CDS.
Conclusion
The ECA RI is correlated with the effectiveness of treatment, and it is sensitive to the clinical evolution of dural AVF. In practice, we propose that patients with dural AVF should undergo CDS study before and immediately after endovascular therapy to evaluated the effectiveness of treatment and to determine their baseline hemodynamic status before follow-up. Patients with dural AVF who do or do not receive aggressive treatment should also undergo regular CDS study during long-term follow-up. A 0.1 increase in the ECA RI may indicate diminution of arteriovenous shunt; however, if the ECA RI decreases by 0.1 during CDS follow-up, cerebral conventional angiography should be considered for further evaluation.
References
- Received April 26, 2004.
- Accepted after revision June 14, 2004.
- Copyright © American Society of Neuroradiology


