
Abstract
BACKGROUND AND PURPOSE: Arterial spin-labeling is an emerging technique for noninvasive measurement of cerebral perfusion, but concerns remain regarding the reliability of CBF quantification and clinical applications. Recently, an ASL implementation called QUASAR was proposed, and it was shown to have good reproducibility of CBF assessment in healthy volunteers. This study aimed to determine the utility of QUASAR for CBF assessment in patients with cerebrovascular diseases.
MATERIALS AND METHODS: Twenty patients with carotid stenosis underwent CBF quantification by ASL (QUASAR) within 3 days of performance of 123I-iodoamphetamine-SPECT. CVR to acetazolamide also was assessed by ASL and SPECT. In surgically treated patients, the respective scans before and after the procedures were compared.
RESULTS: Regional CBF and CVR values measured by ASL were significantly correlated and agreed with those measured by SPECT (rs = 0.92 and 0.88, respectively). A Bland-Altman plot demonstrated good agreement between 2 methods in terms of CBF quantification. Furthermore, ASL could detect pathologic states such as hypoperfusion, impaired vasoreactivity, and postoperative hyperperfusion, equivalent to SPECT. However, ASL tended to overestimate CBF values especially in high-perfusion regions.
CONCLUSIONS: ASL perfusion MR imaging is clinically applicable and can be an alternative method for CBF assessment in patients with cerebrovascular diseases.
Abbreviations
- ACZ
- acetazolamide
- AIF
- arterial input function
- ASL
- arterial spin labeling
- CAS
- carotid artery stenting
- CBF
- cerebral blood flow
- CEA
- carotid endarterectomy
- CVR
- cerebral vasoreactivity
- IMP
- iodine 123 N-isopropy-p-iodoamphetamine
- NASCET
- North American Symptomatic Carotid Endarterectomy Trial
- PET
- positron-emission tomography
- QUASAR
- quantitative STAR labeling of arterial regions
- ROC
- receiver operating characteristic
- ROI
- region of interest
- SPECT
- single-photon emission CTl
- Venc
- velocity encoding
Hemodynamic assessment of patients with cerebrovascular disease plays a crucial role in determination of treatment strategy. Patients with symptomatic occlusion of internal carotid artery and compromised CBF are at high risk for future ischemic stroke.1 Furthermore, in patients with carotid stenosis, assessment of CBF and CVR to vasodilating agents is critically important to measure perioperative risks such as hyperperfusion phenomena. These are rare complications of revascularization surgery, but once they happen, the mortality rate can be quite high.2,3
PET is currently considered the standard for quantitative CBF measurement. However, in routine clinical practice, SPECT also was applied for CBF assessment in patients. Several studies demonstrated the validity of CBF measurement by SPECT with PET.4,5 However, PET and SPECT imaging involves the injection of radioactive tracers that limit its repeatability and application for healthy volunteers.
In addition to these nuclear medicine techniques, numerous other methods for evaluation of brain hemodynamics, such as perfusion CT and perfusion MR imaging, have been developed.6 An MR imaging technique known as ASL is especially useful because it allows noninvasive measurement of brain perfusion by using magnetically labeled blood as an endogenous tracer.7 As such, it allows repeated studies of both healthy subjects and different groups of patients where use of radiation and injection of exogenous contrast agents may be restricted.
With ASL, the protons of the arterial water in the feeding vasculature of the brain are magnetically labeled and used as an endogenous tracer. After the labeling, a certain delay is necessary before acquiring MR images to allow labeled protons to flow through the arterial vascular tree and exchange magnetization with unlabeled tissue water. The subsequent change in tissue magnetization can be detected and yields information about CBF.
Despite this major advantage, ASL has not been widely used for clinical applications. This is because it is an inherently low signal intensity–to-noise technique, and absolute flow quantification is challenging due to uncertainties in factors such as labeling efficiency, spatial and temporal definition of the magnetic bolus, kinetics of the labeled water, and static tissues parameters. Development efforts to solve specific technical issues have resulted in many different ASL implementations and postprocessing strategies. Several validation studies comparing CBF measurements by specific ASL techniques with those by other more established methods can be found in the literature.8–12 Although reasonable correlation between CBF values obtained by ASL and other methods has been reported, the choice of optimal ASL implementation and postprocessing remains unclear due to large methodologic differences used in those studies.
Recently, an ASL implementation called QUASAR has been proposed.13 This method combined several ideas from other ASL techniques into a single sequence, thereby allowing time-efficient data acquisition at multiple inversion times. A new CBF quantification method based on model-free deconvolution and performed in a completely user independent manner also was introduced. Reproducibility of CBF quantification by QUASAR in healthy volunteers has been investigated in a large multicenter study that showed very promising results.14,15
The goal of this study was to determine the clinical utility of ASL (QUASAR) for CBF assessment in patients with cerebrovascular diseases. We compared the CBF and CVR quantification by ASL (QUASAR) with that by SPECT in patients with carotid stenosis.
Materials and Methods
Subjects
Between January and October 2008, 20 patients (16 men and 4 women; mean age, 70.0 ± 8.1 years) with carotid stenosis were recruited into the current ASL-SPECT comparative study. Patient demographics are summarized in Table 1. Among them, 12 patients had symptomatic and 8 patients had asymptomatic carotid stenosis. Of the 20 patients, 10 had severe (>70%), 6 had moderate (50%–70%), and 4 had mild (<50%) ipsilateral carotid stenosis based on the method of NASCET.16 Four patients had contralateral carotid stenosis (>50%), including 1 patient with carotid occlusion. Three patients had intracranial carotid stenosis. All patients underwent preoperative CBF assessment by SPECT and ASL (QUASAR). In 15 patients, CVR also was examined with intravenous administration of ACZ. Postoperative CBF evaluations by ASL and SPECT were performed in 12 patients who were treated surgically (carotid endarterectomy: 10 patients, carotid artery stenting: 2 patients). Routine anatomic MR imaging confirmed the absence of large hemispheric cerebral infarction in all 20 patients before CBF measurement, and no ischemic event was revealed in any patient during these studies. The median interval between the preoperative ASL and SPECT studies was 1.5 days (range, 1–3 days), with a required interval of >24 hours to eliminate the effect of ACZ. All postoperative ASL and SPECT studies were performed on the next day of operation without administration of ACZ. Drugs that could affect CBF measurement, such as antihypertensive, antiplatelet, and sedative agents were not altered in the time between the ASL and SPECT studies. Medical records were reviewed for physiologic parameters at the time of the ASL and SPECT scans. The local ethics committee approved this study and informed consent was obtained from all subjects.
Baseline characteristics of patients
MR Imaging
MR imaging was performed by using a 3T clinical scanner (Philips Achieva R2; Philips Healthcare, Best, the Netherlands). Before perfusion scans, conventional MR imaging including T1-weighted, T2-weighted, fluid-attenuated inversion recovery, and MR angiography of the carotid and cerebral arteries was acquired. For CBF assessment of preoperative patients, the protocol included 2 ASL scans, before and after injection of ACZ, with a 3D whole-brain gradient-echo image acquired in between. The 3D whole-brain image was acquired to match SPECT and ASL coordinate spaces. QUASAR sequence with the following parameters was used: FOV = 240 mm, matrix = 64 × 64, 7 sections (6 mm thickness/2-mm section gap). TR/TE/ΔTI/TI1 = 4000/22/300/40 ms (13 time points), flip angle = 35°/11.7°, sensitivity encoding factor = 2.5, Venc = (∞, 4 cm/s), and 82 averages (48 by using Venc = 4 cm/s, 24 by using Venc = ∞, 10 with smaller flip angle). Seven axial sections covered the upper part of the cerebrum, basal ganglia, and cerebral lobes. For measurement of CVR, 1 g of ACZ was given intravenously; 10 minutes later, the ASL scan was repeated. The CVR was calculated as follows: CVR (%) = [(ACZ-challenge CBF – resting CBF) × 100]/(resting CBF).
Data Processing: ASL
Raw ASL data were exported off-line on a personal computer and processed by using dedicated software provided by Petersen ET (Department of Neuroradiology, Aarhus University Hospital, Aarhus, Denmark). Description of postprocessing details can be found in a previous report.13 In brief, QUASAR sequence allows measurement of tissue equilibrium magnetization (M0, t) and T1 relaxation times in each voxel through Look-Locker acquisition strategy. The sequence also includes dual flip angle image acquisitions to correct for B1 inhomogeneities for more reliable estimates of static tissue parameters. With M0, t and tissue segmentation based on T1 map, it is possible to compute blood equilibrium magnetization (M0, a = M0, t/λ) for gray and white matter in a user-independent manner. Because M0, a is a direct scaling factor of CBF estimate, this approach removes an important source of errors compared with other ASL techniques. CBF values themselves are obtained by using model-free deconvolution of the perfusion signal intensity (ΔM) with a locally defined AIF in a way similar to dynamic susceptibility contrast perfusion studies. Local AIFs are determined as voxels with strong arterial phase signal intensity that are determined from the difference between images acquired with and without vascular crusher gradients in the QUASAR sequence. Overall, CBF quantification from data acquired with the QUASAR sequence requires assumption of only the following parameters: T1(blood) = 1.65 s; inversion efficiency = 95%; and blood-brain partition coefficients (λ) 0.98 and 0.82 for gray and white matter, respectively.15
Data Processing: SPECT
All patients were scanned on a rotating dual-headed gamma camera with dynamic SPECT for 50 minutes (e.CAM GMS-7700; Toshiba Medical, Tokyo, Japan). We used a dual-table autoradiographic method that has been developed for diffusible tracers to quantify CBF at rest and after pharmacologic stress from a single session of dynamic scans with dual bolus administration of 123I-IMP. Several studies demonstrated the accuracy of this method.17,18 To calculate CBF after an ACZ challenge on the theoretical basis of a 2-compartment model, 2 look-up tables were used to reflect the effect of radioactivity in the brain from the first dose of IMP.
The subjects received 2 doses of IMP (111 MBq each) with a constant infusion for 1 minute at the beginning and at 25 minutes of dynamic SPECT, and with injection of ACZ at 10 minutes before the second injection of IMP. SPECT scan started immediately after administration of IMP both rest and ACZ challenge scans. Arterial blood sampling was performed 10 minutes after the first IMP administration.
Comparison of ASL and SPECT Data
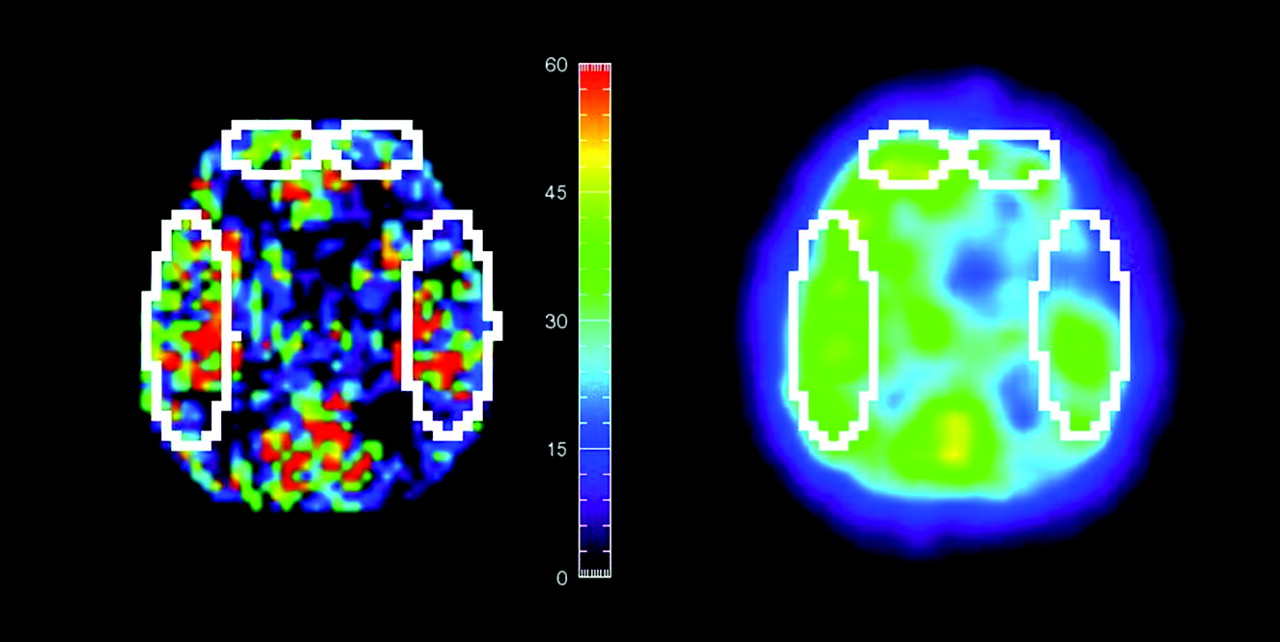
ROI analysis was performed to compare regional CBF values from ASL and SPECT data. For this analysis, the ASL and SPECT images were first registered by using the FLIRT tool from the FSL package.19 A rigid-body transformation was used to align the SPECT data with a skull-stripped 3D T1-weighted image. This was then combined with off-center differences between 3D and ASL scan geometries to bring the SPECT image into the ASL coordinate space. Sections, including the basal ganglia and third ventricle, were chosen for the comparative analysis. In each subject, 4 ROIs were manually placed in bilateral frontal and temporal lobes. Custom-made viewing software on the development environment (IDL 6.1; Research Systems, Boulder, Colorado) was used to draw ROIs on ASL sections and to copy them onto the corresponding SPECT sections (Fig 1). These procedures made it possible to compare the ROIs of exactly the same size and same location on both ASL and SPECT. The average sizes of the ROIs were 6.6 ± 1.1 cm2 (47.3 ± 7.8 pixels) and 22.5 ± 3.8 cm2 (159.9 ± 27.2 pixels) in the frontal and temporal lobes, respectively. To minimize vascular artifacts in ASL data, only CBF values from 0 to 150 mL/100 g/min were included in the analysis.

Representative region of interest sizes and locations in SPECT and ASL perfusion CBF images after registration. ROIs defined on 1 image are automatically copied to another.
The CVR studies were performed by using the same dose (1 g) and timing of administration of ACZ in the ASL and SPECT studies.
Statistical Analysis
Descriptive statistics are presented as mean ± SD. Paired t tests were used for comparison of the physiologic parameters. Fisher exact test was used for proportion analysis. Spearman rank correlation coefficient was used to assess the correlation between the CBF values measured by ASL and SPECT. Bland-Altman plots were generated to display the spread of data and the limits of agreement.
To establish a threshold for differentiating between normal and abnormal states of CBF and CVR on ASL, we defined a significant CBF decrease as a CBF reduction of >20% compared with the contralateral side and impaired CVR as CVR of <10% based on SPECT data, according to the previous studies.20,21 Using these references of SPECT, we generated ROC curves for CBF and CVR measurement by ASL. The ROC curves were used to determine the most appropriate cutoff values to classify normal and abnormal states of CBF and CVR on ASL.
A P value <.05 was considered to indicate a statistically significant difference. An open source software package was used for statistical analysis (R: A language and environment for statistical computing; R Foundation for Statistical Computing, Vienna, Austria; http://www.R-project.org). For creation of graphs, a commercially available software package also was used (Aabel 3.0; Gigawiz, Tulsa, Oklahoma).
Results
No significant changes in physiologic parameters between preoperative ASL and SPECT scan were observed. Body temperature, heart rate, mean blood pressure, and oxygen saturation were 36.2 ± 0.4 and 36.1 ± 0.5 (Celsius), 74.3 ± 15.3 and 74.7 ± 13.9 (beats per minute), 93.3 ± 12.9 and 93.8 ± 12.4 (mmHg), and 97.4 ± 1.4 and 97.3 ± 1.4 (percentage) at the time of the ASL and SPECT scans, respectively.
Anatomic MR imaging and CBF measurement by ASL were completed within 1 hour in all patients. The duration of the QUASAR scan was 5.6 minutes, whereas 25 minutes was required to obtain a CBF map by SPECT. Measurement of resting CBF could be performed in all patients, but 5 patients were excluded from the CVR study due to motion artifacts (n = 2), contraindication of ACZ (n = 2), and no written permission for use of ACZ (n = 1). There were no adverse effects of drug allergy, stroke, cardiovascular events, or renal malfunction due to the injection of ACZ.
ROI Study
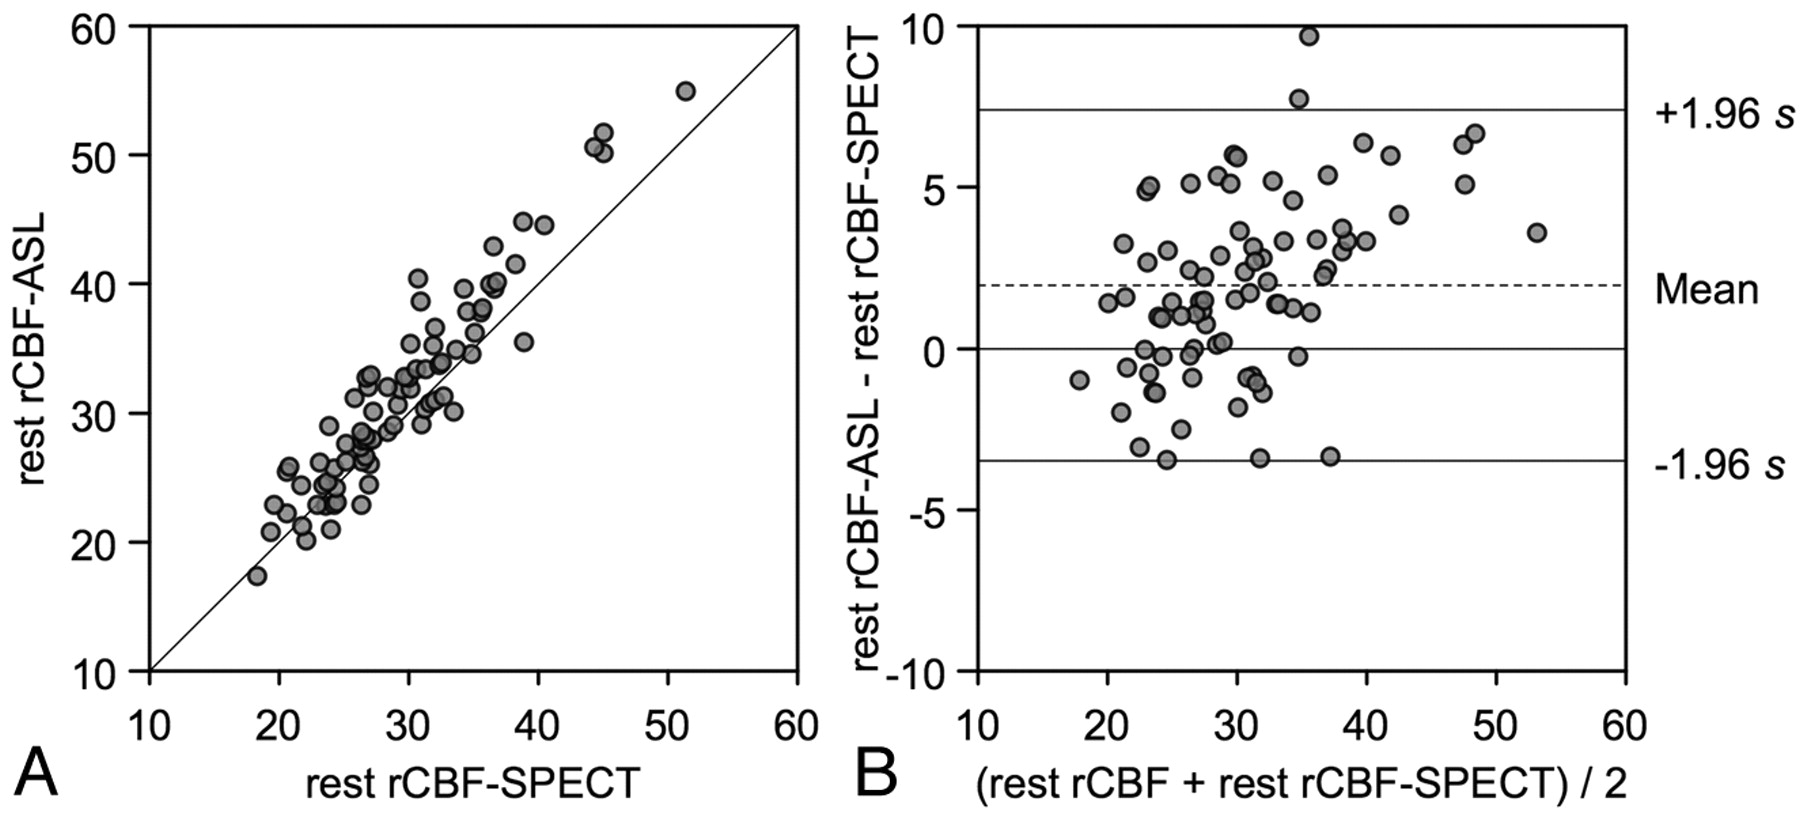
Summary of ROI analysis is shown in Table 2. In all ROIs, average regional CBF measured by ASL and SPECT was 31.5 ± 7.7 and 29.6 ± 6.4 mL/100 g/min, respectively. In comparative analysis, regional CBF measured by ASL was significantly correlated with that measured by SPECT (rs = 0.92, P < .001) (Fig 2 A). Bland-Altman plot demonstrated the mean CBF difference (D1) between the 2 methods (ASL minus SPECT) was 2.0 mL/100 g/min, and SD of the differences was 2.8 mL/100 g/min. In total, 97.5% of data points lay between D1 ± 1.96 SD and the differences seemed to be normally distributed. These findings indicated excellent agreement of the 2 methods of resting CBF (Fig 2B). However, a scatter diagram with the line of equality showed a trend in the bias, being positive (ie, ASL-CBF higher) for SPECT-CBF measures (Fig 2A). The plot of difference against the average of the 2 CBF measurements also showed this tendency: the differences tended to be positive when CBF was high (Fig 2B).

CBF assessments by ASL and SPECT in the region of interest analysis. A, Resting CBF values measured by ASL are plotted against the corresponding CBF values measured by SPECT from bilateral frontal and temporal ROIs. The solid line shows the line of equality. B, Bland-Altman plot of CBF values measured by ASL and SPECT. A plot of the differences between the methods against their means is shown. The broken line shows average of differences, and the solid line indicates ±1.96 × SD of differences.
Summary of ROI analysis
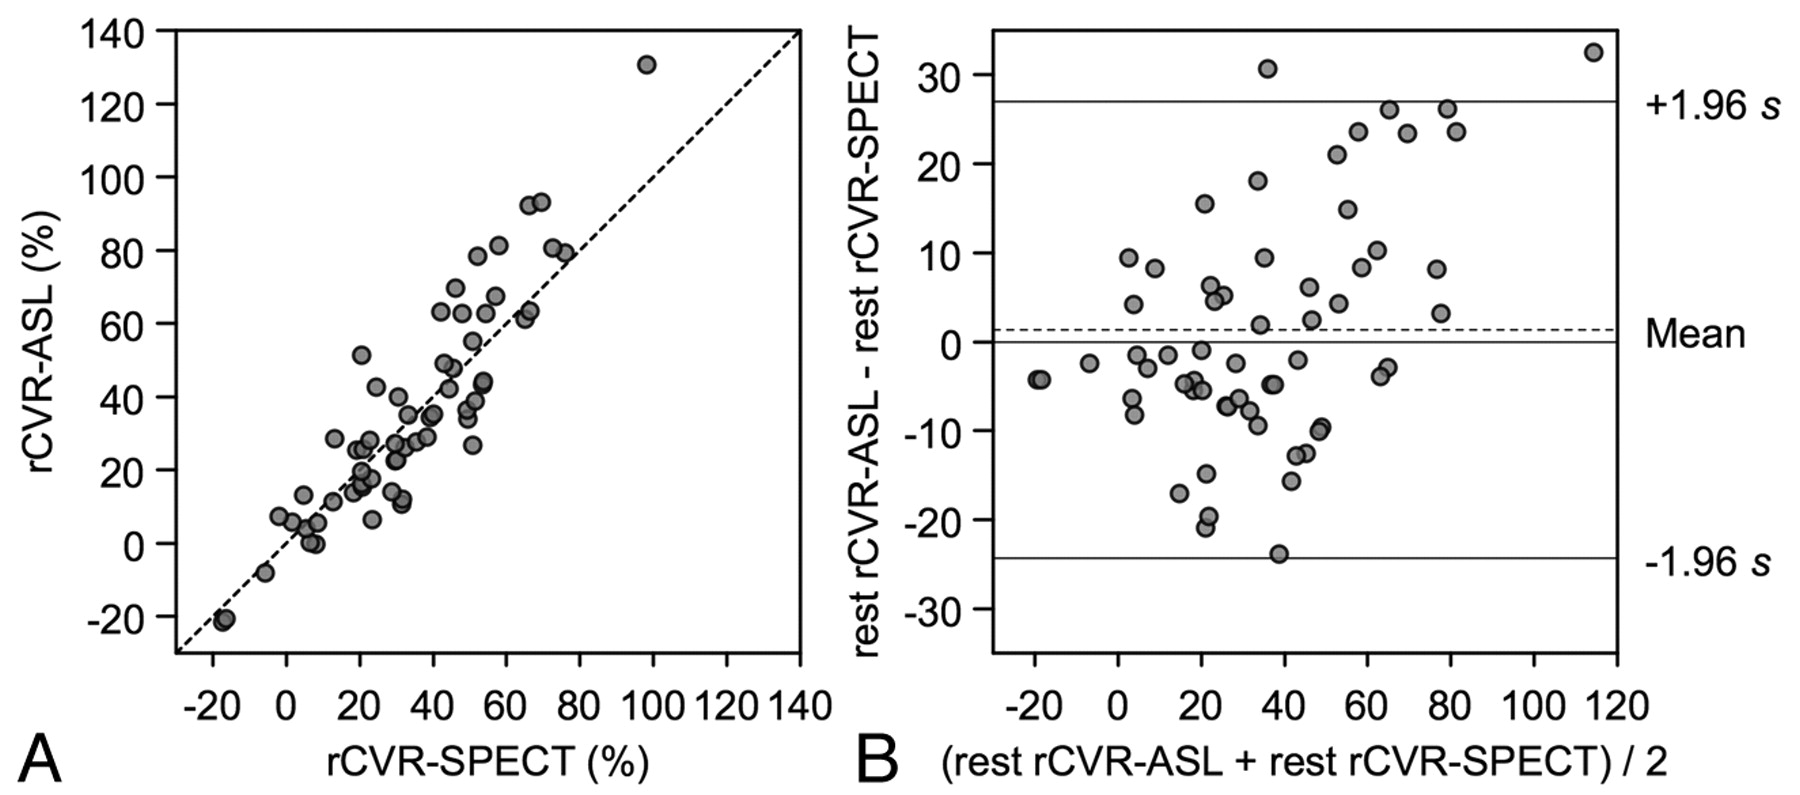
Regional CVR measured by ASL was also significantly correlated with that by SPECT (rs = 0.88, P < .001) (Fig 3 A). Bland-Altman plot showed the mean difference of CVR (D2) (ASL minus SPECT) was 1.3%, and SD of the differences was 13.1%. In total, 96.7% of data points lay between D2 ± 1.96 SD, and the differences seemed to be normally distributed. These findings also indicated good agreement in the CVR analysis (Fig 3B). A scatter diagram with the line of equality and the plot of difference against the average of the 2 CVR measurements showed a trend in the bias, being positive (ie, ASL-CVR higher) for SPECT-CVR measures (Fig 3).

CVR assessments by ASL and SPECT in the ROI study. A, CVR values measured by ASL are plotted against the corresponding CVR values measured by SPECT from bilateral frontal and temporal ROIs. The broken line shows the line of equality. B, Bland-Altman plot of CVR values measured by ASL and SPECT. The broken line shows average of differences, and the solid line indicates ±1.96× SD of differences.
Using CBF reduction and CVR impairment on SPECT as a reference standard, the area under the ROC curve was 0.98 for CBF on ASL and 0.99 for CVR on ASL, indicating excellent discrimination (Fig 4). According to the results of ROC curve, 20% of CBF reduction and 10% of CVR reduction were selected as optimal cutoff values for ASL. In fact, these were the same values as the reference values on SPECT. With the use of the cutoff values, CBF assessment by ASL demonstrated 75% (3/4) sensitivity and 97% (35/36) specificity for detecting ROIs with CBF reduction on SPECT. The positive predictive value was 75% (3/4), and negative predictive value was 97% (35/36). The CVR assessment by ASL demonstrated 90% (9/10) sensitivity and 98% (49/50) specificity for detecting ROIs with CVR impairment on SPECT. The positive predictive value was 90% (9/10), and negative predictive value was 98% (49/50).

A, ROC curves of CBF by ASL for detection of CBF reduction on SPECT. Area under the curve is 0.98. B, ROC curves of CVR by ASL for detection of CVR reduction on SPECT. Area under the curve is 0.99. TPF, true-positive fraction; FPF, false-positive fraction.
Only 1 among 12 patients experienced hyperperfusion phenomenon after surgical treatment. Even in this case, ASL provided equivalent CBF assessment to that of SPECT in perioperative management with detection of a preoperative CBF decrease, impaired CVR, and postoperative hyperperfusion (Fig 5).
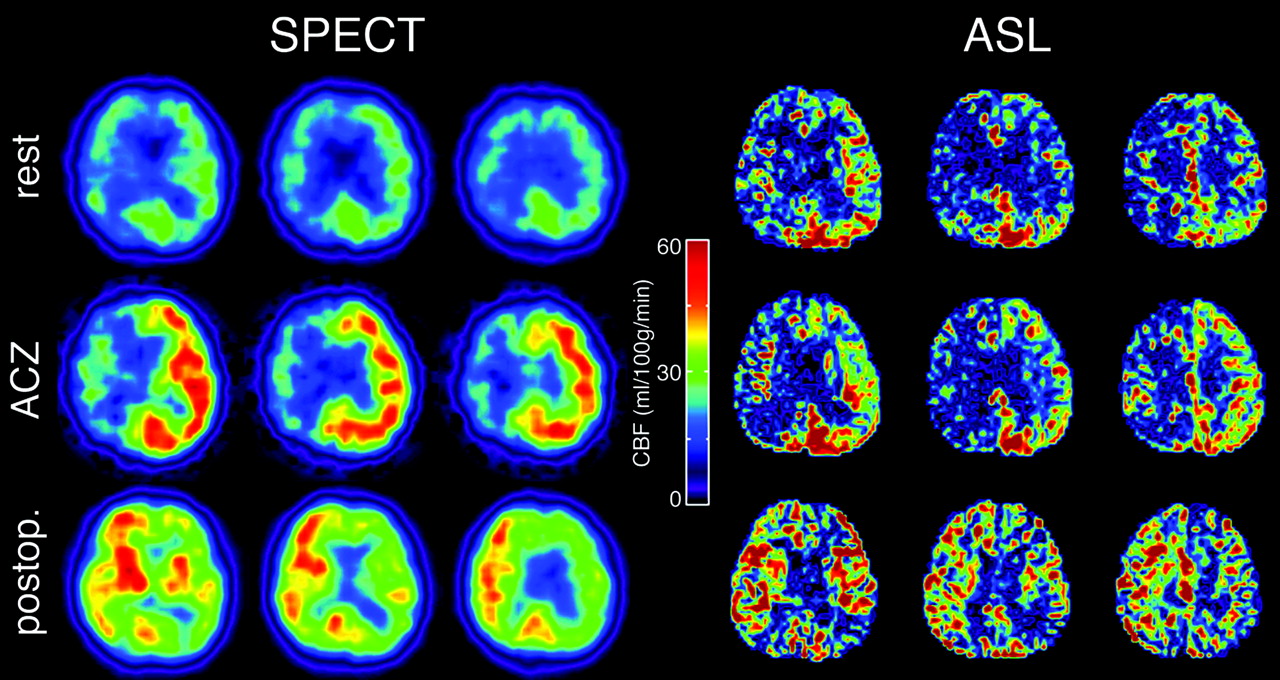
Typical CBF maps obtained by SPECT and ASL in patients with severe right carotid stenosis. Preoperative resting images (top row), preoperative images with ACZ challenge (middle row), and postoperative images (bottom row) are shown. Preoperative hypoperfusion, poor vasoreactivity, and postoperative hyperperfusion in the right internal carotid artery region can be seen in both SPECT and ASL.
Discussion
This study aimed to determine the utility of ASL (QUASAR) for CBF assessment in patients with cerebrovascular diseases. The current results demonstrate excellent agreement between CBF assessment by ASL (QUASAR) and SPECT. This technique is a safe and simple method and has a major advantage in acquisition time compared with SPECT, with <10 minutes required for acquiring a whole-brain perfusion image. Hemodynamic and anatomic information can be revealed simultaneously by using ASL perfusion MR imaging, and CBF measurements can be easily repeated because of its noninvasiveness. These findings suggest that the ASL method could be useful for CBF quantification in patients with cerebrovascular disease for assessment of cerebral hemodynamics.
Validation of MR perfusion measurement by using various invasive and noninvasive methods is a continuous topic of interest. A comparison of CBF measurement by continuous ASL and radioactive microsphere in a rat model showed that ASL tended to underestimate CBF in high-flow regions,22 whereas another recent study showed that ASL overestimated CBF in ischemic regions.12 Another study showed a significant correlation between ASL and SPECT and a high specificity and accuracy of ASL to detect ischemic regions in patients with cerebrovascular diseases.10
Interpretation of the results of such validation studies is somewhat difficult because of different ASL implementations and postprocessing methods. Some of the bigger concerns with ASL regarding the accuracy of the CBF measurement, especially in patients, are transit time effects and vascular artifacts.15 Various solutions to these issues have been proposed. What makes QUASAR appealing for clinical use is that it combines many of these solutions into a single sequence with relatively short acquisition time. Another advantage is the use of a novel model-free and user-independent CBF quantification approach that was shown to have good reproducibility in a large multicenter trial in healthy volunteers.14
The current study demonstrated excellent agreement of CBF assessment by ASL with that by SPECT in normal and ischemic perfusion regions. However, ASL had a subtle tendency to overestimate CBF in high-perfusion regions compared with SPECT. These results might be explained by underestimation of the 123I-IMP radioactivity in high-perfusion regions. As reported previously, 123I-IMP-autoradiography techniques showed underestimations compared with H215O-PET due to poor spatial resolution and lower first-pass extraction.23
One reason for difficulty in accurate comparison of ASL and other techniques is differences of postprocessing methods. Differences in spatial resolutions and section angulations make accurate ROI comparative analysis difficult. To overcome these difficulties, we used a 3D whole-brain gradient-echo image to align SPECT into ASL coordinate space.
Previous studies have shown that patients with a severe decrease in CBF, impaired CVR, or both have a high risk for development of postoperative hyperperfusion.24,25 Only a few studies demonstrated that ASL provided quantitative vasoreactivity values to ACZ or CO2 in human brain.20,26,27 QUASAR ASL is a relatively new method that confirmed good reproducibility in a large population of healthy volunteers. However, there are no prior validation studies against any other established perfusion technique with a vasodilating agent to check the usefulness of QUASAR in patients with cerebrovascular disease.
There are some limitations in the current study. Because of the small number of cases, a larger number of cases would be required to establish the usefulness of CBF quantification by ASL. Another limitation of the current study is the use of SPECT as a reference standard. PET has usually been considered as a standard of CBF quantification. However, some studies showed that SPECT can be an alternative method for CBF assessment in patients with cerebrovascular diseases.4,5 A dual-table autoradiographic method was designed to assess CBF and CVR,28 both of which have been considered as the important measure for perioperative risks.
In the current study, we confirmed that quantitative CBF and CVR values measured by QUASAR were in good agreement with those by SPECT and that the QUASAR method demonstrated a high sensitivity and specificity for detection of a reduction in CBF and CVR of patients with carotid stenosis on SPECT. Furthermore, QUASAR ASL perfusion MR imaging could detect pathologic states throughout the treatment of carotid stenosis. These results suggest that QUASAR ASL perfusion MR imaging provides adequate CBF assessment in patients with carotid stenosis and can be an alternative method to SPECT for these patients. ASL is safe and effective method because it is completely noninvasive and rapid compared with any established method for CBF quantification.
Conclusions
QUASAR ASL perfusion MR imaging can be an alternative to conventional methods for assessment of CBF status in patients with cerebrovascular disease.
Acknowledgments
We thank all the members of the MR imaging and SPECT technical staffs: Hideaki Kawamitsu, Nobukazu Aoyama, Fumiko Sakurai, Hajime Aoki, Kunikazu Kanzawa, Kouya Nishiyama, Tatsuya Yamada, and Tetsuya Yamamoto.
Footnotes
-
This work was funded by Grant-in-Aid for Scientific Research (KAKENHI) (19591674).
-
Paper previously presented at: 17th Annual Meeting of International Society for Magnetic Resonance in Medicine, April 18–24, 2009, Honolulu, Hawaii; and Congress of Neurological Surgeons 2010 Annual Meeting, October 16–21, 2010, San Francisco, California.
-
Disclosures: Ivan Zimine; Research Support (including provision of equipment or materials): Philips Healthcare Details: Employee (until April 15, 2010).
Indicates open access to non-subscribers at www.ajnr.org
References
- Received September 5, 2010.
- Accepted after revision December 8, 2010.
- © 2011 by American Journal of Neuroradiology
In this issue


Jump to section
Related Articles
Cited By...
- Predicting Impaired Cerebrovascular Reactivity and Hyperperfusion Syndrome with BeamSAT MRI in Carotid Artery Stenosis
- Cerebral Blood Flow Improvement after Indirect Revascularization for Pediatric Moyamoya Disease: A Statistical Analysis of Arterial Spin-Labeling MRI
- Correlation of Asymmetry Indices Measured by Arterial Spin-Labeling MR Imaging and SPECT in Patients with Crossed Cerebellar Diaschisis
- Arterial Spin-Labeling Evaluation of Cerebrovascular Reactivity to Acetazolamide in Healthy Subjects