
Abstract
BACKGROUND AND PURPOSE: Hypoxic tissue evaluation in glioma is important for predicting treatment response and establishing antihypoxia therapy. In this preliminary study, 62Cu-ATSM PET was used to determine its validity as a biomarker for distinguishing tumor grade and tissue hypoxia.
MATERIALS AND METHODS: 62Cu-ATSM PET was performed in 22 patients with glioma, and the 62Cu-ATSM SUVmax and T/B ratio were semiquantitatively evaluated. 62Cu-ATSM uptake distribution was qualitatively evaluated and compared with MR imaging findings. HIF-1α expression, a hypoxia marker, was compared with 62Cu-ATSM uptake values.
RESULTS: The 62Cu-ATSM SUVmax and T/B ratio were significantly higher in grade IV than in grade III gliomas (P = .014 and .018, respectively), whereas no significant differences were found between grade III and grade II gliomas. At a T/B ratio cutoff threshold of 1.8, 62Cu-ATSM uptake was predictive of HIF-1α expression, with 92.3% sensitivity and 88.9% specificity. The mean T/B ratio was also significantly higher in HIF-1α-positive glioma tissue than in HIF-1α-negative tissue (P = .001). Using this optimal threshold of T/B ratio, 62Cu-ATSM PET showed regional uptake in 61.9% (13/21) of tumors within the contrast-enhanced region on MR imaging, which was significantly correlated with presence of a necrotic component (P = .002).
CONCLUSIONS: Our results demonstrated that 62Cu-ATSM uptake is relatively high in grade IV gliomas and correlates with the MR imaging findings of necrosis. Moreover, the 62Cu-ATSM T/B ratio showed significant correlation with HIF-1α expression. Thus, 62Cu-ATSM appears to be a suitable biomarker for predicting highly malignant grades and tissue hypoxia in patients with glioma.
ABBREVIATIONS:
- 62Cu-ATSM
- 62Cu-diacetyl-bis (N4-methylthiosemicarbazone)
- 18F-FMISO
- 18F-fluoromisonidazole
- HIF-1α
- hypoxia-inducible factor-1α
- pO2
- partial pressure of oxygen
- ROC
- receiver operating characteristic
- SUV
- standard uptake value
- T/B ratio
- tumor/ background ratio
- WHO
- World Health Organization
Gliomas are common treatment-resistant primary CNS tumors.1 The 2007 WHO classification defines diffusely infiltrative astrocytic tumors with cytologic atypia as grade II, those showing anaplasia and mitotic activity as grade III, and those with microvascular proliferation and/or necrosis as glioblastomas (grade IV).2 Although glioblastomas are highly vascularized human tumors, their microcirculation is functionally insufficient compared with metabolic demand, leading to relative tissue hypoxia and necrosis.3,4 The hypoxic microenviroment confers increased radiation therapy and chemotherapy resistance.4
Several approaches have been attempted to detect tissue hypoxia in glioma. To validate the tissue hypoxia in glioma, direct oxygen measurement is a promising technique. Direct measurement of tumor oxygenation using polarographic electrodes revealed that the oxygen pressure in tumor was lower than that in the surrounding tissue.5 However, this technique is invasive and technically demanding, and only a few studies have been performed.5,6 On the other hand, advances in noninvasive molecular imaging approaches using PET have provided alternatives to assess tumor hypoxia. In hypoxic PET imaging, one of the most popular radiotracers in glioblastoma has been 18F-FMISO.7,8 However, 18F-FMISO has several limitations, such as slow clearance and low tissue uptake, depending on the high lipophilicity and slow kinetics.9 Therefore, alternative radiotracers for hypoxic imaging such as 62Cu-ATSM and FRP-170 1-(2-[18F]fluoro-1-[hydroxymethyl]ethoxy)methyl-2-nitroimidazole, a hydrophilic 2-nitroimidazole analog, have been developed.10
Cu-ATSM has a suitable molecular size and lipophilicity for penetrating tumor cells, and is proposed as a promising hypoxic tracer for PET.11,12 In vivo studies have demonstrated that tissue Cu-ATSM uptake is dependent on oxygen concentration.11,13 Recent human studies on lung, cervical, and head and neck cancers demonstrated the utility of Cu-ATSM PET in hypoxic imaging.14⇓⇓⇓–18 In glioma, Cu-ATSM uptake is also considered to predict tissue hypoxia in an experimental animal model.11,19,20 To our knowledge, however, no clinical studies to assess its significance in glioma have been reported. Therefore, we investigated 62Cu-ATSM PET to evaluate its ability to predict tumor grade, to validate it histologically by HIF-1α immunostaining as a hypoxic imaging tracer, and to compare it with MR findings of necrosis in patients with glioma.
Materials and Methods
Patients
Between December 2010 and October 2011, we performed preoperative 62Cu-ATSM PET and MR imaging in 22 consecutive pathologically confirmed glioma patients (6 men and 16 women aged 23–79 years; mean age, 56.4 ± 16.3 years). Thirteen patients were newly diagnosed and 9 patients had recurrence. Among recurrent cases, 6 of the 9 patients had received radiation therapy. All recurrent lesions were found on the operated side. Tumors were graded according to the 2007 WHO classification as follows: 4 grade II gliomas (2 diffuse astrocytomas and 2 oligoastrocytomas), 7 grade III gliomas (1 anaplastic astrocytoma, 3 anaplastic oligodendrogliomas, and 3 anaplastic oligoastrocytomas), and 11 grade IV gliomas (11 glioblastomas). Table 1 summarizes patient clinical characteristics. Our institutional review board approved the study, and written informed consent was obtained from all patients.
Clinical characteristics of patients with glioma
Preparation of 62Cu-ATSM
62Cu-glycine (no-carrier-added 62Cu) solution was obtained from a 62Zn/62Cu generator system supplied by the National Institute of Radiologic Sciences (Chiba, Japan). 62Cu-ATSM tracer was prepared by mixing 5 mL 62Cu-glycine solution with 0.2 mL ATSM solution (0.5 mmol/L in dimethyl-sulfoxide) in a sterilized vial. Unlabeled Cu-ATSM was used for retention time determination. Radiochemical purities of 62Cu-ATSM samples were confirmed by high-performance liquid chromatography before initial injections.
Image Acquisition
A whole-body PET/CT scanner (Aquiduo PCA-7000B; Toshiba Medical Systems, Tokyo, Japan) with a CT component having a 16-row detector was used. An image quality phantom (NEMA NU 2–2001) was used for cross-calibration, as such phantoms are widely used and can estimate optimum acquisition times. For PET/CT, low-dose CT data were acquired at 120 kVp using an auto-exposure control system, a beam pitch of 0.875 or 1, and a 1.5- or 2-mm × 16-row mode. No iodinated contrast material was administered. After intravenous bolus injection of approximately 740 MBq 62Cu-ATSM, patients were placed in a supine “arm-up” position. Dynamic data acquisition was performed between 0 and 40 minutes. PET/CT images were reconstructed for data acquired during the last 10 minutes (30–40 minutes) to minimize the effect of cerebral blood flow. The following acquisition settings were used: 3D data acquisition mode; 180 seconds/bed; field of view, 500 mm; 4 iterations; 14 subsets; matrix size, 128 × 128; 8-mm Gaussian filter, full width at half maximum; reconstruction, ordered subset expectation maximization.
MR imaging was performed on a 1.5T system (Magnetom Symphony; Siemens, Erlargen, Germany). 3D T1-weighted MR imaging with a magnetization-prepared rapid acquisition of gradient echo sequence was used in this study. Axial T1-weighted images were obtained after administration of 0.2 mL/kg gadolinium-diethylene-triamine pentaacetate using these parameters: field of view, 250 × 250 mm2; matrix size, 512 × 512; TR = 1960 ms; TE = 3.9 ms; TI = 1100 ms; and flip angle, 15°. In total, 120 contiguous 2-mm images were obtained from each patient.
Image Analysis
PET images were analyzed visually and quantitatively by 2 independent reviewers who recorded their findings after reaching a consensus. ROIs were outlined within areas of increased tracer uptake and measured on each section. In extensively heterogeneous lesions, ROIs covered all lesion components. For quantitative interpretations, SUV was determined by a standard formula, with activity ROIs recorded as Bq/mL of injected dose, before being converted to Bq/kg. The T/B ratio was calculated relative to uptake in the contralateral normal brain. 62Cu-ATSM uptake was determined by assessing the maximum SUV (SUVmax), mean SUV (SUVmean), and T/B ratio. PET images were merged with MR images using Dr View version R 2.5 for Linux (AJS, Tokyo, Japan) and visually compared with enhancement on MR imaging based on the optimal threshold of T/B ratio, as described in the results. This optimal threshold uptake was further compared with tumor necrosis on MR imaging, which was defined as a zone with hypointensity surrounded by a contrast-enhanced region on T1-weighted images. Merged PET/MR images were exported to the neuronavigation system (StealthStation; Medtronic, Minneapolis, Minnesota) for precise tissue sampling.
Immunohistochemistry
Tissue specimens were obtained from lesions with the highest 62Cu-ATSM uptake. HIF-1α immunostaining was performed to confirm hypoxia. In brief, resected specimens were immediately submerged into 10% neutral-buffered formalin to decrease postresection changes and embedded in paraffin. Before immunostaining, 5-μm-thick sections were deparaffinized, rehydrated, and heated for 20 minutes at 95°C in Tris-ethylenediaminetetraacetic acid buffer for antigen retrieval. Endogenous peroxidase was inactivated with 0.3% H2O2 for 30 minutes at room temperature. Sections were incubated with 1:200 mouse monoclonal anti-HIF-1α antibody (BD Transduction Laboratories, Lexington, Kentucky) for 30 minutes at room temperature. The signal was amplified by the Catalyzed Signal Amplification II System (Dako, Carpinteria, California) and developed with 3,3′-diaminobenzidine tetrahydrochloride. Finally, sections were counterstained with hematoxylin and mounted. HIF-1α expression was determined by assessing positively stained tumor cells using a BZ-9000 microscope (×200; Keyence, Chicago, Illinois). Specimens with <5% of positive cells were rated as negative HIF-1α expression, whereas those with ≥5% were rated as positive HIF-1α expression, respectively.
Statistical Analysis
All parameters were expressed as mean ± standard deviation. Overall difference among histologic grades was determined by the Kruskal-Wallis test; when significant, the Steel-Dwass test was used for post hoc comparisons. To determine the 62Cu-ATSM T/B ratio for discriminating HIF-1α-positive and HIF-1α-negative tumors, ROC analysis was performed by varying the 62Cu-ATSM T/B ratio cutoff threshold over the entire range of values, and calculating the optimal sensitivity and specificity. The correlation between HIF-1α expression and the 62Cu-ATSM T/B ratio was tested by the Wilcoxon signed rank test. To compare the relationship between 62Cu-ATSM uptake and tumor necrosis on MR findings, statistical analysis was performed using the Fisher exact probability test. P values less than .05 were considered significant. Statistical analyses were performed using JMP 9 statistical software (SAS Institute, Cary, North Carolina).
Results
62Cu-ATSM Uptake in Tumors of Different Grades
Table 2 shows 62Cu-ATSM uptake values in patients. The overall mean 62Cu-ATSM SUVmax and SUVmean in tumors were 1.30 ± 0.83 (range, 0.44–4.33) and 0.75 ± 0.36 (range, 0.30–1.79), respectively. The overall mean 62Cu-ATSM T/B ratio was 2.18 ± 1.88 (range, 0.4–9.7). The mean 62Cu-ATSM SUVmax for grades II, III, and IV were 0.82 ± 0.52, 0.87 ± 0.34, and 1.74 ± 0.92, respectively. The 62Cu-ATSM SUVmax was significantly higher in grade IV than in grade III tumors (P = .014); no significant differences existed between grades III and II tumors (P = .88; Fig 1). Similarly, the 62Cu-ATSM SUVmean was significantly higher in grade IV than in grade III tumors (P = .010); no significant difference was noted between grade III and II tumors (P = .84). Furthermore, the mean 62Cu-ATSM T/B ratios for grade II, III, and IV tumors were 1.20 ± 0.47, 1.37 ± 0.65, and 3.05 ± 2.33, respectively; the ratio was significantly higher in grade IV than in grade III tumors (P = .018), with no significant difference between grade III and grade II tumors (P = .92; Fig 2).
Summary of tumor grades, 62Cu-ATSM uptake values, MR findings, and HIF-1α expression

62Cu-ATSM SUVmax in gliomas of different grades (2007 WHO grading) showing a significant difference in uptake between grades IV and III tumors but not between grades III and II tumors (P = .88, Steel-Dwass test). NS = not significant.

62Cu-ATSM T/B ratio in gliomas of different grades (2007 WHO grading) showing a significant difference between grades IV and III tumors but not between grades III and II tumors (P = .92, Steel-Dwass test).
Correlation between 62Cu-ATSM T/B Ratio and HIF-1α Expression
Overall, positive HIF-1α expression was observed in 13 of 22 gliomas (59.1%), including all 11 grade IV (100%), 1 of 7 grade III (14.3%), and 1 of 4 grade II gliomas (25%), respectively (Table 2). At a T/B ratio cutoff threshold of 1.8, 62Cu-ATSM uptake predicted HIF-1α positivity with 92.3% sensitivity and 88.9% specificity (area under the curve, 0.92; Fig 3A). The mean T/B ratio was 1.20 ± 0.58 (range, 0.4–2.3) in HIF-1α-negative tumors and 2.86 ± 2.18 (range, 1.5–9.7) in HIF-1α-positive tumors (P = .001; Fig 3B).

A, ROC analysis indicating that 62Cu-ATSM uptake is predictive of HIF-1α positivity, with a sensitivity of 92.3% and a specificity of 88.9% for a T/B ratio cutoff threshold of 1.8 (area under the curve = 0.92). B, The 62Cu-ATSM T/B ratio is significantly higher in HIF-1α-positive than in HIF-1α-negative gliomas (P = .001, Wilcoxon signed rank test). Circles above bars represent outliers (1.5×, the interquartile range).
Distribution of 62Cu-ATSM Uptake Compared with MR Findings
In the present study, MR images revealed contrast-enhanced lesions in 95.5% (21/22) of tumors, among which a necrotic component was visualized in 57.1% (12/21). Based on the optimal T/B ratio cutoff threshold of 1.8, as described in the previous section, 62Cu-ATSM uptake was observed in 61.9% (13/21) of contrast-enhanced lesions on MR imaging, which was significantly correlated with the presence of a necrotic component (Table 3, P = .002). This optimal uptake region was confined within contrast-enhanced lesion in all 13 cases, whereas no uptake was found within the necrotic component in any of the cases.
Comparison of 62Cu-ATSM uptake and MR findings in gliomas
Case 2
A 61-year-old woman presented with headache and left hemiparesis. Initial MR imaging revealed an enhanced lesion with a necrotic component in the right temporal lobe (Fig 4A). PET showed marked 62Cu-ATSM uptake (T/B ratio = 9.7, SUVmax = 4.33; Fig 4B), and merged PET/MR imaging revealed 62Cu-ATSM uptake within the contrast-enhanced lesion (Fig 4C). After stereotactic biopsy for precise tissue sampling, the patient underwent gross total resection. The histologic diagnosis was consistent with glioblastoma. In the region of maximum 62Cu-ATSM uptake, intense HIF-1α immunoreactivity was observed (Fig 4D).
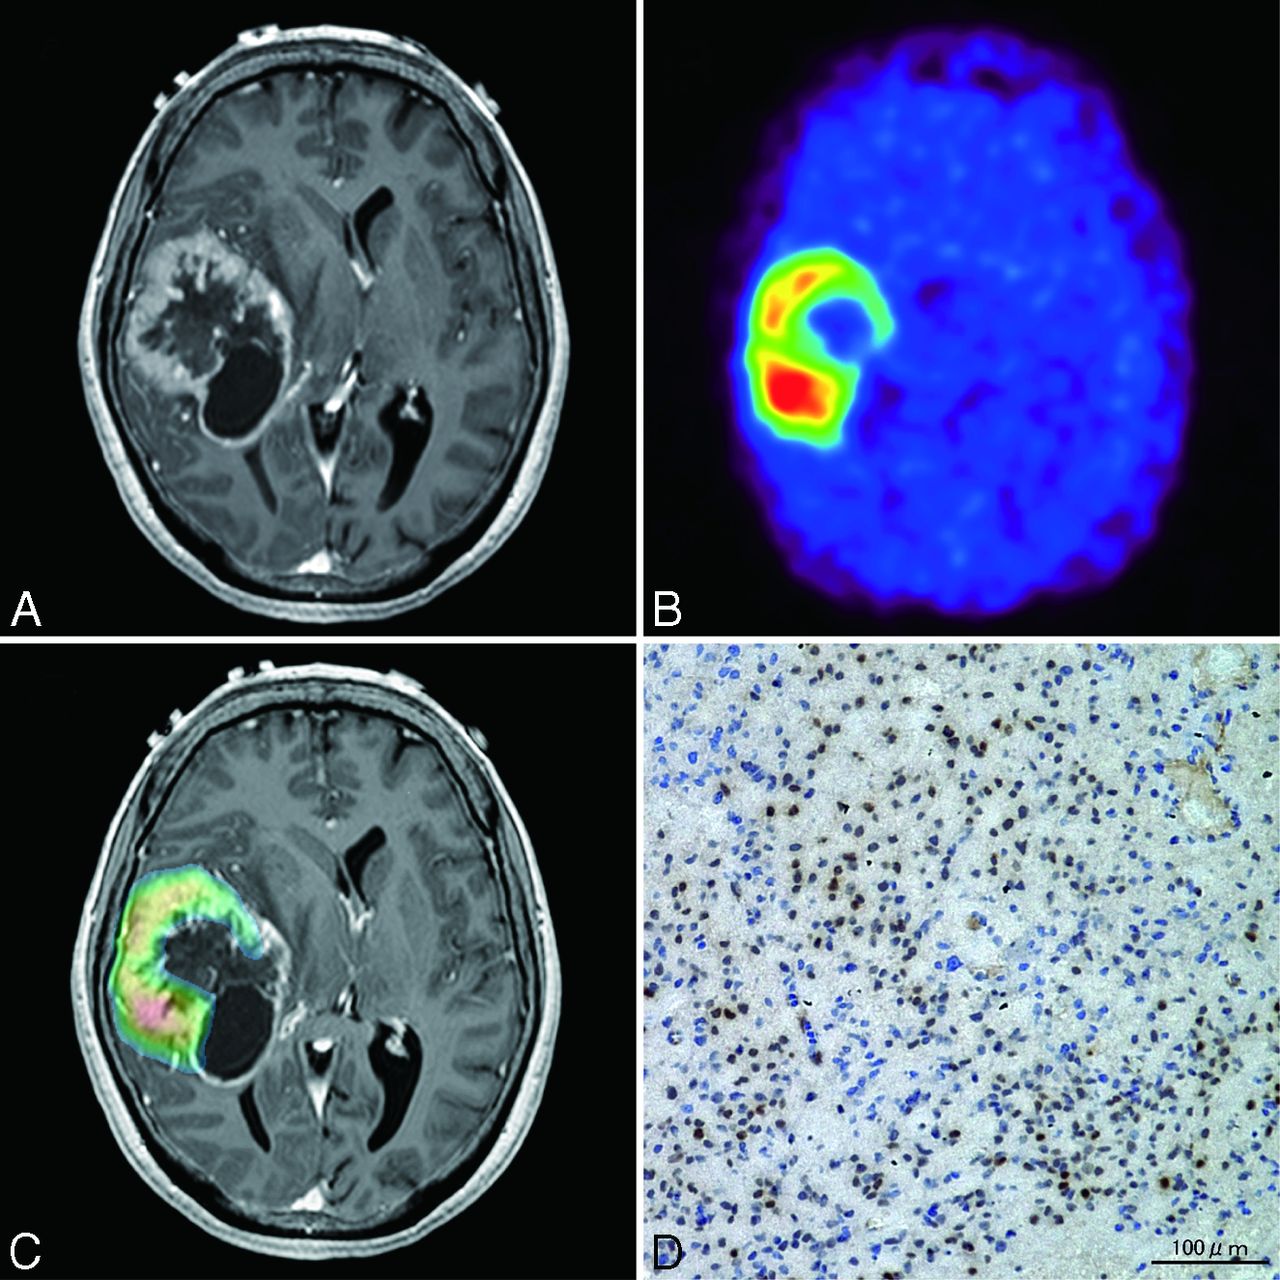
Case 2. A 61-year-old woman with glioblastoma. A, Axial T1-weighted gadolinium-enhanced MR imaging demonstrating an enhanced lesion with necrosis in the right temporal lobe. B, 62Cu-ATSM PET showing high uptake in the lesion. C, PET/MR imaging fusion image showing 62Cu-ATSM uptake (T/B cutoff threshold of ≥1.8) within contrast-enhanced lesion. D, Photomicrographs of tissue with the highest 62Cu-ATSM uptake stained with anti-HIF-1α showing intense HIF-1α immunoreactivity. Original magnification × 200.
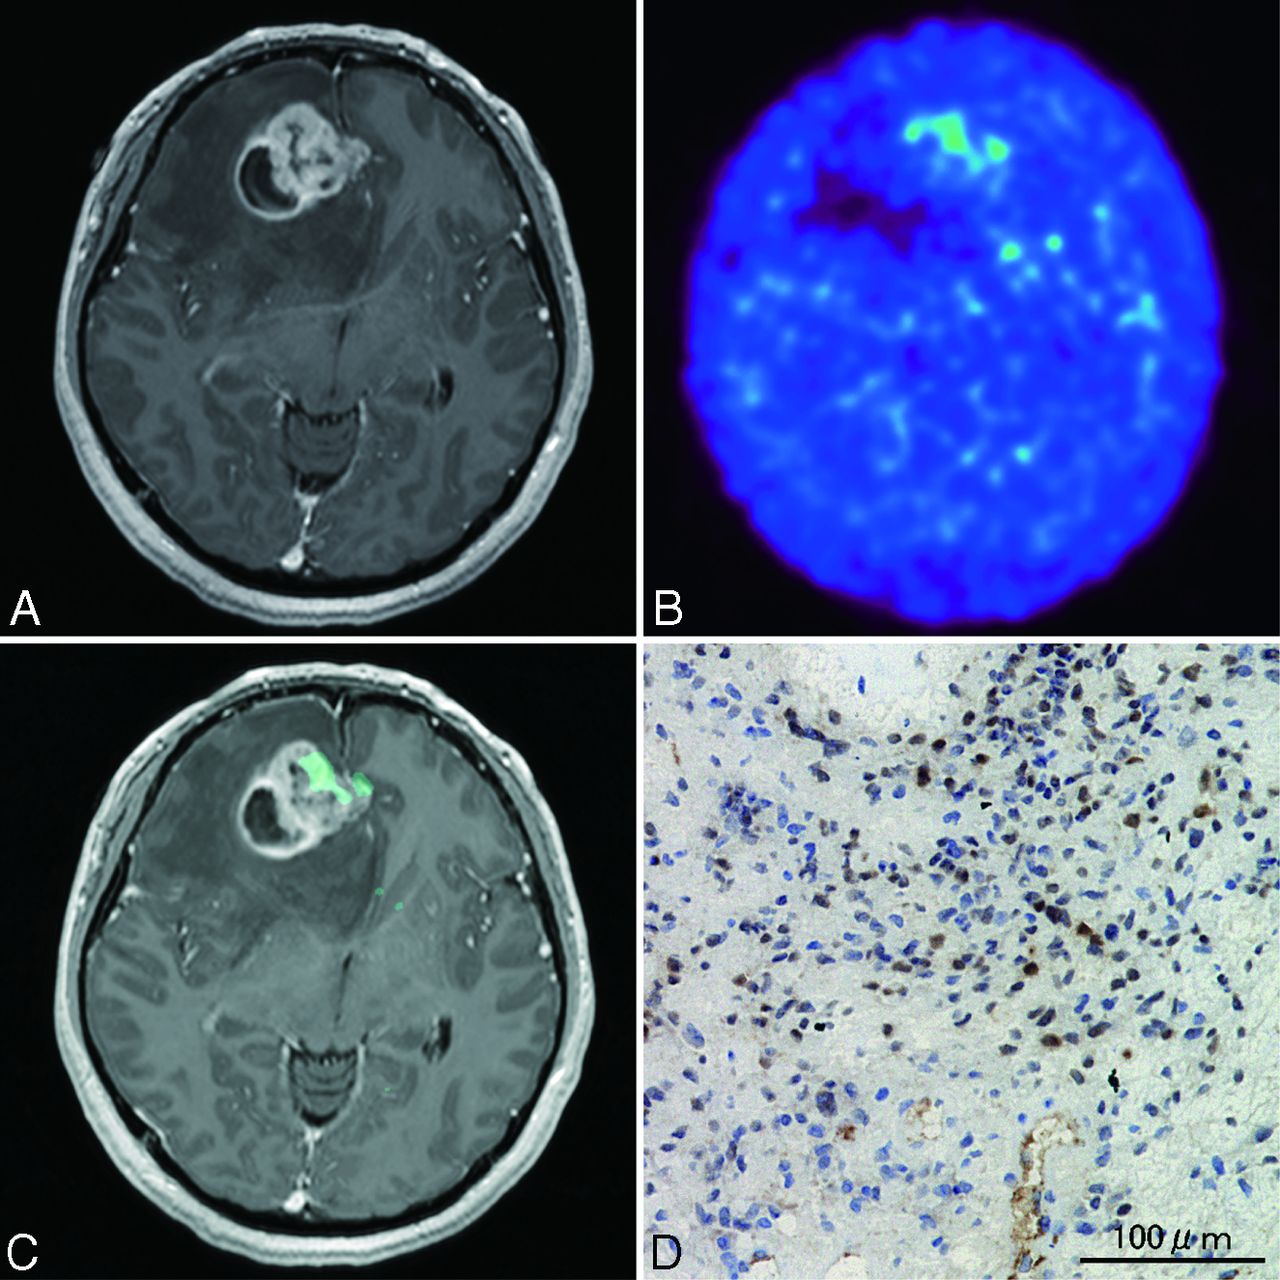
Case 8
A 28-year-old woman presented with headache. MR imaging revealed an enhanced lesion in the right frontal lobe with a necrotic component (Fig 5A). PET showed mild 62Cu-ATSM uptake (T/B ratio = 2.0, SUVmax = 1.15; Fig 5B), and merged PET/MR imaging revealed partial 62Cu-ATSM uptake within the contrast-enhanced region (Fig 5C). The patient underwent total tumor resection. Histologically, a glioblastoma with HIF-1α-positive staining was diagnosed (Fig 5D).

Case 8. A 28-year-old woman with glioblastoma. A, Axial T1-weighted gadolinium-enhanced MR imaging demonstrating an enhanced lesion with necrosis in the right frontal lobe. B, 62Cu-ATSM PET showing mild uptake in the tumor. C, PET/MR imaging fusion image demonstrating 62Cu-ATSM accumulation (T/B cutoff threshold of ≥1.8) within contrast-enhanced lesion. D, Photomicrograph of a tissue sample with 62Cu-ATSM accumulation showing high HIF-1α expression. Original magnification × 200.
Case 13
A 42-year-old woman presented with tumor recurrence 3 years after initial diagnosis of oligoastrocytoma. Current MR imaging revealed a slightly enhanced lesion in the right frontal lobe (Fig 6A). PET imaging (Fig 6B, -C), however, did not reveal clear 62Cu-ATSM accumulation (T/B ratio = 1.3, SUVmax = 0.67). The patient underwent gross total resection. Histologic diagnosis was oligoastrocytoma without malignant transformation (grade II). Very few HIF-1α-positive cells were observed (Fig 6D).

Case 13. A 42-year-old woman with oligoastrocytoma. A, Axial T1-weighted gadolinium-enhanced MR imaging demonstrating a mildly enhanced lesion in the right frontal lobe. 62Cu-ATSM PET image (B) and PET/MR imaging fusion image (C), showing absent 62Cu-ATSM uptake in the tumor. D, Photomicrograph of a lesion tissue sample showing no HIF-1α immunoreactivity. Original magnification × 200.
Discussion
Our study showed that the 62Cu-ATSM SUVmax and T/B ratio were significantly higher in grade IV gliomas than in grade III gliomas (P = .014 and P = .018, respectively), whereas there were no differences between grade III and II gliomas (Figs 1 and 2). We also showed that the 62Cu-ATSM T/B ratio was highly correlated with immunohistologic HIF-1α expression, which is a marker of tissue hypoxia (Figs 3A, -B).
ATSM labeled with a positron-emitting Cu isotope was developed as a hypoxia-selective uptake tracer for ischemic myocardium and hypoxic tumors.21,22 Under hypoxic conditions, the bound Cu++ in Cu-ATSM is reduced to Cu+, which is instantly released from ATSM and trapped exclusively in hypoxic tissue.21 Experimental in vivo studies have demonstrated that this process is dependent on tissue oxygen pressure, thereby validating its usefulness as a hypoxic imaging tracer.11,13 In addition to tissue hypoxia, human cancer studies indicate that Cu-ATSM correlates with the treatment response and poor prognosis.14,15,18 These results suggested that Cu-ATSM uptake might be a predictive biomarker of treatment resistance and poor outcome in human cancer.
Many clinical PET studies have attempted to evaluate the tumor grade of gliomas. These studies have widely used metabolic tracers, such as 18F-fluorodeoxyglucose and 11C-methionine, to distinguish tumor grades.23⇓⇓⇓–27 These clinical studies have demonstrated correlations with histologic grade, but a clear discrimination between grade IV and grade III gliomas has not been conclusively established, particularly in the presence of oligodendroglial tumors where a relatively high uptake has been demonstrated.23,26 In the present study, we detected high regional uptake of 62Cu-ATSM (mean T/B ratio = 3.05 ± 2.33) in grade IV gliomas, which was significantly different from that in grade III gliomas, suggesting that 62Cu-ATSM might be used as a predictive radiotracer for distinguishing highly malignant gliomas. Corroborating our results, similar differentiation between glioblastoma and less-malignant gliomas has been demonstrated by hypoxic PET imaging using 18F-FMISO.8 In this study, most of the grade II and III gliomas were composed of oligodendroglial component (7 oligodendroglial or oligoastrocytic tumors of 9 gliomas).8 However, the present study revealed relatively high 62Cu-ATSM uptake in 1 anaplastic astrocytoma (case 4) and 1 diffuse astrocytoma (case 16), leaving a possibility that 62Cu-ATSM uptake might be relatively high in astrocytic tumors compared with that in oligodendroglial tumors. Given the relatively high proportion of oligodendroglial tumors in the present study as well as in the FMISO study,8 these results might rather suggest that hypoxic PET imaging is a superior radiotracer for distinguishing grade IV gliomas from grade III oligodendroglial tumors. Because of the small number of patients in these studies, further analysis in a large number of patients is needed to conclude whether hypoxic PET imaging can distinguish grade IV gliomas from grade III astrocytic tumors.
In contrast, we found no significant difference in tracer uptake between grade III and II gliomas. Theoretically, tissue hypoxia is caused by an imbalance between oxygen supply (vascularization) and its demand, the latter of which is presumably defined by mitotic activity and cell attenuation. In this regard, grade III gliomas with moderate mitotic activity might be generally accompanied by sufficient neovascularization, whereas grade II gliomas might not need increased oxygen supply when considering their low mitotic activity. In other words, our results might indicate matched oxygen supply and demand in grade II and III gliomas, which is disrupted in grade IV gliomas with higher mitotic activity. Because we also showed that 62Cu-ATSM uptake is highly correlated with evidence of tumor necrosis (a final form of tissue hypoxia) on MR imaging (Table 3), grade II and III might be grouped together to represent tumors without hypoxia and necrosis, which is also a feature of histologic grading. Because the number of cases in these groups is also small, further study would be required to confirm this observation.
We also demonstrated that 62Cu-ATSM imaging was highly correlated with immunohistologic expression of HIF-1α, with 92.3% sensitivity and 88.9% specificity when using a T/B ratio cutoff threshold of 1.8. Although the number of patients was limited, a hypoxic PET imaging study using FRP-170 also reported similar correlation with HIF-1α expression.10 HIF-1 is a dimer of HIF-1α and HIF-1β, and is a critical mediator of the cellular hypoxic response. HIF-1β is constitutively expressed independent of oxygen levels, whereas HIF-1α is rapidly degraded under normoxia.28 However, the ubiquitin-dependent degradation of HIF-1α is suppressed under hypoxia, leading to increased HIF-1α expression.28,29 Indeed, many experimental in vitro studies have demonstrated the increased expression of HIF-1α within an appropriate range of O2 tension.28,30 Recent in vitro31 and in vivo32 studies have used this as a marker of hypoxia to detect a strong correlation between Cu-ATSM uptake and HIF-1α expression. Considering these observations, the HIF-1α expression observed in our study probably indicates the presence of hypoxia in highly malignant gliomas, though mechanisms other than hypoxia cannot be excluded in complex tumor tissues.
In addition to being a hypoxic marker, HIF-1α expression is known to be an independent marker of high malignancy in glioma.4,33⇓⇓–36 Experimental studies have shown that HIF-1α directly induces a microenvironment that is suitable for tumor growth by increasing several factors, such as vascular endothelial growth factor36 and notch,37 and its selective inhibition leads to the inhibition of tumorigenesis and invasiveness.38 Clinical studies based on genome-wide expression analysis have also shown that the HIF-1α-dependent pathway is a highly significant pathway when distinguishing between grade IV and grade III gliomas.39 Moreover, the level of HIF-1α has also been shown to directly correlate with treatment resistance, even among grade IV gliomas.40 Because 62Cu-ATSM imaging was shown to be highly predictive of HIF-1α expression in the present study, it might also provide a valuable noninvasive tool for detecting highly malignant and treatment-resistant lesions in glioma.
Hypoxia is usually defined as decreased O2 availability or pO2 below a critical threshold, which results in metabolic dysfunction.41 A tissue pO2 less than 10 mm Hg is generally associated with intracellular depletion of adenosine triphosphate and acidosis, whereas mitochondrial oxidative phosphorylation and the electron transport system are only disturbed when the pO2 level falls below 0.5 mm Hg.41 The reductive retention of Cu-ATSM theoretically requires an intact electron transport system, such as NADPH-cytochrome b5 reductase,12 and thus its increased uptake suggests moderate hypoxia.42 In fact, the direct measurement of pO2 in glioblastoma is known to be less than 2.5 mm Hg, which is an independent predictor of poor radiation therapy response.6 On the other hand, severe hypoxic condition could not be detected by Cu-ATSM imaging due to a disturbed electron transport system, which presumably leads to tissue necrosis. These findings could account for our observation that 62Cu-ATSM uptake was only confined within enhanced regions but not in the necrotic component. Accordingly, a heterogeneous Cu-ATSM pattern might indicate a heterogeneous oxygen microenvironment as the tumor grows rapidly. Furthermore, a “hot lesion” detected during moderate hypoxia might be a good treatment target, particularly for surgical removal, when we consider that radioresistant glioma stemlike cells or tumor-initiating cells probably induced by hypoxia could preferentially survive in such environments by utilizing glycolytic pathways.43⇓–45
This study has several limitations. First, we did not perform direct measurements of tissue pO2 to validate the utility of our method as a hypoxic tracer. Second, selection bias resulting from a small patient sample size, and inclusion of recurrent cases could not be ruled out. Third, the effect of blood-brain barrier disruption on the uptake could not be completely eliminated either, though the presence of nonuptake region within an enhanced lesion on MR imaging suggested a minor effect. Nonetheless, our preliminary study suggested that 62Cu-ATSM might be a promising tracer for predicting treatment-resistant hypoxic regions within highly malignant gliomas. Although other hypoxic imaging studies are also providing similar preliminary results, as described previously, the short half-life of 62Cu-ATSM (t1/2 = 9.7 minutes) compared with 18F-FMISO and FRP-170 (t1/2 = 110 minutes)46 might be an advantage in obtaining a high signal-to-noise ratio within a shorter interval, as well as in reducing the radiation exposure of the patients. Further research involving large-scale studies would be warranted to validate clinical significances.
Conclusions
62Cu-ATSM PET can help distinguish highly malignant gliomas. In addition, the 62Cu-ATSM T/B ratio may predict HIF-1α expression, suggesting that 62Cu-ATSM is a suitable biomarker for predicting highly malignant grades and tissue hypoxia in patients with glioma.
Acknowledgments
We thank Tsuneo Saga, Masayuki Inubishi, Toshimitsu Fukumura, and Yasuhisa Fujibayashi of the Diagnostic Imaging and Molecular Probe Groups, Molecular Imaging Center, National Institute of Radiologic Sciences, Chiba, Japan; Hidehiko Okazawa of the Department of Radiology, Biomedical Imaging Research Center, Faculty of Medical Sciences, University of Fukui, Fukui, Japan; and Hirofumi Fujii, Functional Imaging Division, Research Center for Innovative Oncology, National Cancer Center Hospital East, Chiba, Japan, for their assistance.
Footnotes
This study was partly supported by the Japan Advanced Molecular Imaging Program (J-AMP) from the Japan Science and Technology Agency, Saitama, Japan.
Indicates open access to non-subscribers at www.ajnr.org
References
- Received February 13, 2012.
- Accepted after revision March 27, 2012.
- © 2013 by American Journal of Neuroradiology
In this issue


Jump to section
Related Articles
Cited By...
- 62Cu-Diacetyl-Bis (N4-Methylthiosemicarbazone) PET in Human Gliomas: Comparative Study with [18F]Fluorodeoxyglucose and L-Methyl-[11C]Methionine PET
- Interrogating Tumor Metabolism and Tumor Microenvironments Using Molecular Positron Emission Tomography Imaging. Theranostic Approaches to Improve Therapeutics