
Abstract
BACKGROUND AND PURPOSE: Contrast-enhanced 3D-turbo spin-echo (TSE) black-blood sequence has gained attention, as it suppresses signals from vessels and provides an increased contrast-noise ratio. The purpose was to investigate which among the contrast-enhanced 3D T1 TSE, 3D T1 fast-spoiled gradient echo (FSPGR), and 3D T2 FLAIR sequences can better detect cranial nerve contrast enhancement.
MATERIALS AND METHODS: Patients with cranial neuritis based on clinical findings (n = 20) and control participants (n = 20) were retrospectively included in this study. All patients underwent 3T MR imaging with contrast-enhanced 3D T1 TSE, 3D T1 FSPGR, and 3D T2 FLAIR. Experienced and inexperienced reviewers independently evaluated the 3 sequences to compare their diagnostic performance and time required to reach the diagnosis. Additionally, tube phantoms containing varying concentrations of gadobutrol solution were scanned using the 3 sequences.
RESULTS: For the inexperienced reader, the 3D T1 TSE sequence showed significantly higher sensitivity (80% versus 50%, P = .049; 80% versus 55%; P = .040), specificity (100% versus 65%, P = .004; 100% versus 60%; P = .001), and accuracy (90% versus 57.5%, P = .001; 90% versus 57.5%, P = .001) than the 3D T1 FSPGR and 3D T2 FLAIR sequences in patients with cranial neuritis. For the experienced reader, the 3D T1-based sequences showed significantly higher sensitivity than the 3D T2 FLAIR sequence (85% versus 30%, P < .001; 3D T1 TSE versus 3D T2 FLAIR, 85% versus 30%, P < .001; 3D T1 FSPGR versus 3D T2 FLAIR). For both readers, the 3D T1 TSE sequence showed the highest area under the curve (inexperienced reader; 0.91, experienced reader; 0.87), and time to diagnosis was significantly shorter with 3D T1 TSE than with 3D T1 FSPGR.
CONCLUSIONS: The 3D T1 TSE sequence may be clinically useful in evaluating abnormal cranial nerve enhancement, especially for inexperienced readers.
ABBREVIATIONS:
- FSPGR
- fast-spoiled gradient echo
- CE
- contrast-enhanced
- GRE
- gradient-echo
- CNR
- contrast to noise ratio
- ROC
- receiver operating characteristic
- AUC
- area under the ROC curve
- TSE
- turbo spin-echo
Cranial neuropathies can have multiple causes, including infectious, neoplastic, inflammatory, traumatic, and idiopathic pathologies.1 Such conditions cause disruption of the blood–nerve barrier, which is sustained by the combined actions of tight junctions in the endothelium of the endoneurial capillaries and of the inner layers of the perineurium.2 Contrast-enhanced (CE) MR imaging plays an important role in the diagnosis of cranial neuritis by visualizing nerve enhancement attributed to leakage forcing spillage and accumulation of contrast material surrounded by CSF.3
To date, no standard protocol has been established for evaluating cranial nerve enhancement, whereas several sequences have been proposed for detecting leptomeningeal enhancement. CE 3D T1 gradient-echo (GRE) sequences have been widely used in the clinical setting to detect leptomeningeal pathology.4⇓⇓-7 Furthermore, the CE 3D FLAIR sequence is advantageous because it can sensitively detect low concentrations of gadolinium.8,9 Recently, a CE 3D turbo spin-echo (TSE) black-blood sequence has gained attention because it provides an increased contrast to noise ratio (CNR) and suppresses diverting signals from vessels.10⇓⇓-13
To the best of our knowledge, no study has explored the value of CE 3D T1 TSE black-blood imaging in the diagnosis of cranial neuritis. Although the CE 3D T1 GRE sequence is generally used for the evaluation of cranial nerve enhancement,3,14 its ability to evaluate the cisternal segment of cranial nerves is limited owing to the surrounding prominent vessel enhancement. Moreover, hyperintensities on FLAIR are also associated with various conditions, such as subarachnoid hemorrhage, sluggish collateral vessels, and supplemental oxygen, which may produce misinterpretations of the cranial nerve enhancement.15 Therefore, the aim of this study was to investigate which sequence among 3D T1 TSE, 3D T1 fast-spoiled gradient echo (FSPGR), and 3D T2 FLAIR can better detect contrast enhancement in patients with cranial neuritis.
MATERIALS AND METHODS
Patients
This retrospective study was approved by the institutional review board of our institution, and the requirement to obtain patients' informed consent was waived. From May 2018 to April 2020, 299 consecutive patients underwent cranial nerve MR imaging for symptoms of cranial nerve disorders at our institution. Among them, 38 met the inclusion criteria and were recruited, ie, patients 1) with a final clinical diagnosis of cranial neuritis based on clinical findings, relief of symptoms after administration of steroids, or electromyography results16 and 2) who had a clinical diagnosis-correlated enhancing cranial nerve lesion on cranial nerve MR imaging. Of these, 18 were excluded for the following reasons: 1) lack of 3D T1 TSE, 3D T1 FSPGR, or 3D T2 FLAIR (n = 11); 2) lesion at the cavernous segment of the oculomotor nerve (n = 5); or 3) potential for perineural metastasis owing to underlying disease (n = 2). Finally, 20 patients were included in this study, and the mean time interval between cranial nerve MR imaging and final clinical diagnosis was 2.75 ± 3.50 days. The detailed information of the patients is provided in the Table. Additionally, 20 patients who underwent cranial nerve MR imaging under suspicion of neurovascular compression syndrome and had no remarkable finding on MR imaging were included as the control group. A flow diagram of patient selection is shown in Fig 1. There was no significant difference in mean age (56.6 years in the patient group; 55.2 years in the control group; P = .782) and sex distribution (5 [25%] women in the patient group; 10 [50%] women in the control group; P = .102).
Detailed description of the included patients

Flowchart algorithm for patient selection.
MR Imaging
All scans were acquired using 1 of 2 3T MR imaging units (Achieva; Philips Healthcare or Signa Architect, GE Healthcare). Each patient underwent the following 3 postcontrast sequences: 3D T1 TSE, 3D T1 FSPGR, and 3D T2 FLAIR. Detailed scan parameters are provided in the Online Supplementary Data. After IV injection of gadobutrol (Gadovist, Bayer Schering Pharma) at a dose of 0.1 mmol/kg of body weight, the 3D T1 TSE and 3D T1 FSPGR images were acquired in a randomized order followed by the 3D T2 FLAIR images.
Image Analysis
A total of 120 sequences (3 sequences for each of the 40 patients) were de-identified and randomly distributed in 3 sessions. Each of the 3 sequences (3D T1 TSE, 3D T1 FSPGR, and 3D T2 FLAIR) acquired from each patient was included in a different session. There was a 2-week interval between sessions. Images were provided with a reconstructed section thickness of 1.2 mm and analyzed on a DICOM viewer (RadiAnt DICOM Viewer). An inexperienced reader (T.-W.B., a third-year resident) and an experienced reader (Y.K., a board-certified neuroradiologist with 8 years of experience), blinded to patient clinical information, independently reviewed these images. Multiplanar reconstruction and axial images were available on the DICOM viewer.
The reviewers made a diagnosis and rated the contrast enhancement based on a 5-point scoring system, with 1 indicating no enhancement; 2, equivocal enhancement; 3, mild but definite enhancement; 4, moderate enhancement, similar to the signal intensity of the anterior genu of the facial nerve; and 5, intense enhancement, greater than that of the anterior genu of the facial nerve. Finally, they measured the time (in seconds) required to reach the diagnosis.
Statistical Analysis
Sensitivity, specificity, and accuracy were calculated and compared using the McNemar test. A receiver operating characteristic (ROC) analysis was used to evaluate the diagnostic performance of the enhancement grade in each sequence to detect neuritis. Areas under the ROC curve (AUCs) were compared using the Z-test. The Wilcoxon rank sum test was used to compare the time to diagnosis. P < .05 was considered statistically significant. All statistical analyses were performed using MedCalc for Windows (version 12.7.1.0) and SPSS Statistics for Windows (version 20.0, IBM).
Clinical Phantom Study
To evaluate the signal intensity according to the contrast agent concentration in the 3D T1 TSE, 3D T1 FSPGR, and 3D T2 FLAIR images, a clinical phantom scan was constructed based on the data of 1 healthy volunteer. The clinical phantom was constructed as shown in the Online Supplementary Data, containing gadobutrol solutions (Gadovist) of varying concentrations (range, 0.0125–3 mmol/L); the head band was set to the volunteer's head, and the volunteer underwent scanning for the 3 sequences in a 3T MR imaging unit (Signa Architect). We compared the signal intensities of various concentrations of gadobutrol solution, divided by the signal intensity of the brain parenchyma, among 3D T1 TSE, 3D T1 FSPGR, and 3D T2 FLAIR.
RESULTS
Comparison of Diagnostic Accuracy among 3D T1 TSE, 3D T1 FSPGR, and 3D T2 FLAIR
For the inexperienced reader, there was significantly higher sensitivity (80% versus 50%; P = .049), specificity (100% versus 65%; P = .004), and accuracy (90% versus 57.5%; P = .001) with 3D T1 TSE than with 3D T1 FSPGR. Likewise, there was significantly higher sensitivity (80% versus 55%; P = .040), specificity (100% versus 60%; P = .001), and accuracy (90% versus 57.5%; P = .001) with 3D T1 TSE than with 3D T2 FLAIR. There was no significant difference in the sensitivity, specificity, and accuracy between 3D T1 FSPGR and 3D T2 FLAIR (all P > .05) (Online Supplementary Data).
For the experienced reader, 3D T1 TSE (85%) and 3D T1 FSPGR (85%) showed the same sensitivity; however, there was a significantly higher sensitivity with the 3D T1-based sequences than with the 3D T2 FLAIR sequences (85% versus 30%, P < .001; 3D T1 TSE versus 3D T2 FLAIR, 85% versus 30%, P < .001; 3D T1 FSPGR versus 3D T2 FLAIR). The specificity did not significantly differ among the 3 sequences (3D T1 TSE, 90%; 3D T1 FSPGR, 85%; and 3D T2 FLAIR, 90%; all P > .05). Meanwhile, there was a significantly higher accuracy with 3D T1 TSE than with 3D T2 FLAIR (87.5% versus 60%; P = .005) and with 3D T1 FSPGR, but the difference was not significant (87.5% versus 82.5%; P = .533). Representative images are shown in Figs 2⇓–4.

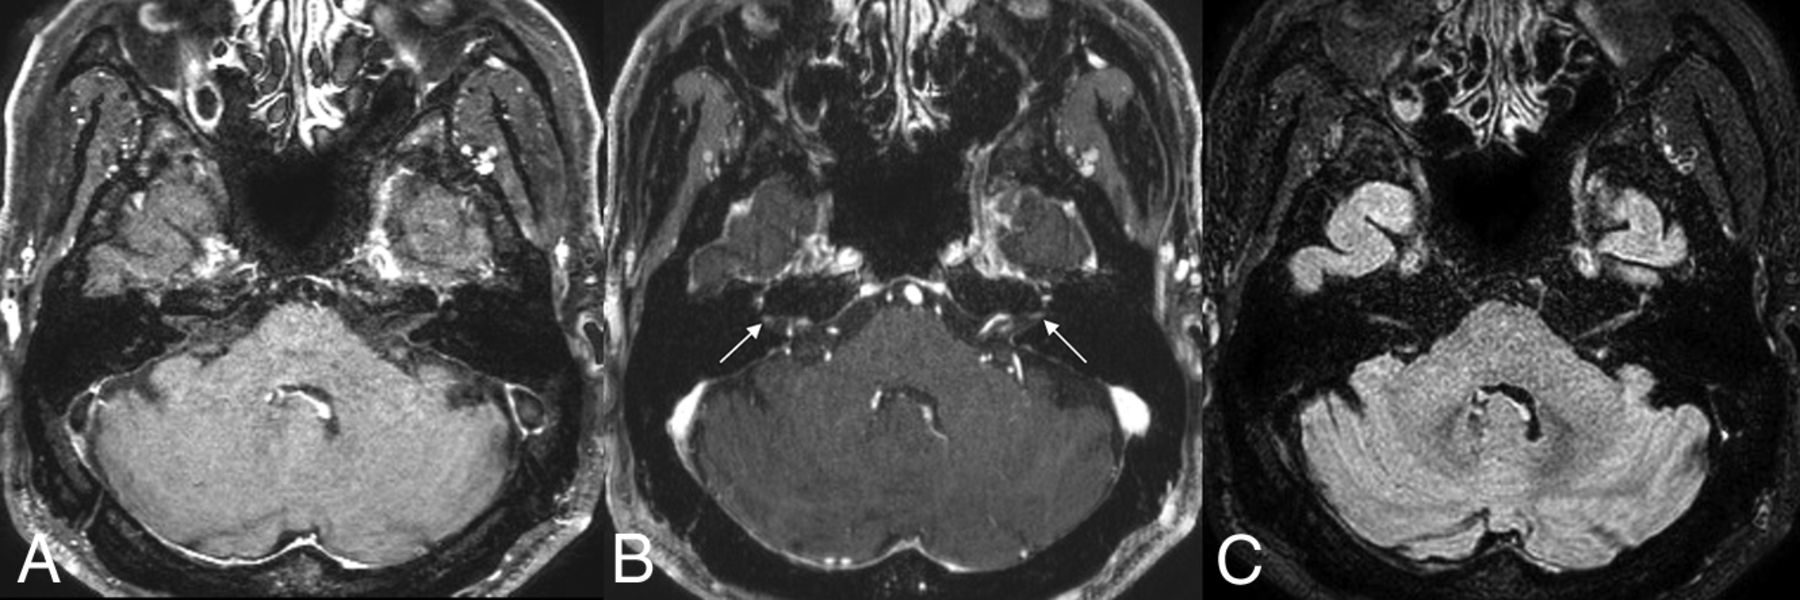
A 71-year-old man with left facial neuritis. Moderate enhancement noted at the left distal meatal segment of the facial nerves on 3D T1 TSE (A), but 3D T1 FSPGR (B) and 3D T2 FLAIR (C) revealed equivocal and mild enhancement, respectively, of the corresponding facial nerve (arrows).

A 60-year-old man with left oculomotor neuritis. On 3D T1 TSE (A), intense enhancement at the distal cisternal portion of left oculomotor nerve was observed, and mild enhancement was observed on 3D T1 FSPGR (B). The 3D T2 FLAIR (C) was negatively interpreted by both reviewers (arrows).
Diagnostic Performance of 3D T1 TSE, 3D T1 FSPGR, and 3D T2 FLAIR Using the AUCs
For the inexperienced reader, the highest AUC was attained with 3D T1 TSE (AUC, 0.91 [95% CI, 0.77–0.97]) with marginal significance compared with 3D T1 FSPGR (AUC, 0.75 [95% CI, 0.58–0.87]; P = .053), but a significant difference was noted when compared with 3D T2 FLAIR (AUC, 0.56 [95% CI, 0.39–0.71]; P < .001) (Online Supplementary Data and Fig 5).
A 65-year-old man in the control group. There is no definite enhancement of the bilateral facial nerves on 3D T1 TSE (A) and 3D T2 FLAIR (C). However, mild enhancement at the distal internal auditory canal (arrows), possibly owing to convergence of dura mater, may lead to misinterpretation as enhancement of the distal meatal segment of the facial nerve on 3D T1 FSPGR (B).

Comparisons of the ROC curves for the inexperienced (A) and experienced (B) readers.
For the experienced reader, the AUCs for 3D T1 TSE, 3D T1 FSPGR, and 3D T2 FLAIR were as follows: 3D T1 TSE, 0.87 (95% CI, 0.73–0.95); 3D T1 FSPGR, 0.86 (95% CI, 0.72–0.95); and 3D T2 FLAIR, 0.71 (95% CI, 0.54–0.84). The AUC of 3D T1 TSE was significantly higher than that of 3D T2 FLAIR (P = .049); however, the difference between 3D T1 TSE and 3D T1 FSPGR was not significant (P = .891).
Time to Diagnosis
For both readers, the time to diagnosis was significantly shorter for 3D T1 TSE than for 3D T1 FSPGR (inexperienced reader: 30.75 versus 40.90 seconds, P = .001; experienced reader: 23.85 versus 35.55 seconds, P = .005).
Clinical Phantom Study
The signal intensity ratios of various concentrations of gadobutrol solution to normal WM on 3D T1 TSE, 3D T1 FSPGR, and 3D T2 FLAIR images were plotted according to the gadobutrol concentration (Online Supplementary Data). The signal intensity ratio of 0.7–2-mmol/L gadobutrol solutions was higher in 3D T1 TSE than in 3D T1 FSPGR and 3D T2 FLAIR.
DISCUSSION
For the inexperienced reader, the 3D T1 TSE sequence showed higher sensitivity, specificity, and accuracy for the conspicuity of cranial nerve enhancement in patients with cranial neuritis than the 3D T1 FSPGR and 3D T2 FLAIR sequences. For the experienced reader, there was higher sensitivity, specificity, and accuracy with 3D T1 TSE than with 3D T2 FLAIR and 3D T1 FSPGR, but the difference was only significant between 3D T1 TSE and 3D T2 FLAIR. For both readers, the AUCs were higher in 3D T1 TSE than in 3D T1 FSPGR and 3D T2 FLAIR. The 3D T1 TSE sequence may improve lesion conspicuity in cranial neuritis; thus, its inclusion should be considered in the protocol for cranial nerve evaluation in patients with suspected cranial neuritis.
Recently, 3D T1 TSE, which entails variable flip-angle modulation, resulting in blood-flow suppression, has been introduced in brain and leptomeningeal metastasis imaging and proved to improve the diagnostic accuracy compared with 3D T1 GRE.10,11,13,17 Oh et al13 reported that 3D T1 TSE black-blood sequences had significantly higher sensitivity and higher interobserver agreement than 3D T1 GRE sequences in patients with leptomeningeal metastasis. Similarly, Sommer et al11 demonstrated higher sensitivity and diagnostic confidence regarding leptomeningeal affection when using a 3D T1-weighted modified volumetric isotropic TSE acquisition (T1 mVISTA) sequence than when using a 3D T1-weighted magnetization-prepared rapid acquisition of gradient echo (T1 MPRAGE) sequence in infectious and neoplastic meningitis. Our findings are in line with the results of these recent studies on leptomeningeal metastases; however, to our knowledge, the diagnostic performance of 3D T1 TSE in cranial neuritis has not been previously compared with that of 3D T1 FSPGR and 3D T2 FLAIR.
In our clinical phantom study, 3D T1 TSE achieved a higher signal intensity than 3D T1 FSPGR at the lower contrast concentration (0.0125–2 mmol/L), which was consistent with previous findings.9,18 We speculate that the cisternal segments of the cranial nerves are in a position inevitably affected by active CSF movement, which results in the dilution of contrast material; thus, these might contribute to higher CNR on 3D T1 TSE in cranial neuritis. Our hypothesis is supported by Gil et al's15 observation that subtle leptomeningeal enhancement was better depicted with 3D T1 sampling perfection with application-optimized contrasts by using different flip angle evolutions (SPACE) than with 2D-T1 GRE and 2D FLAIR. Moreover, we observed that 3D T1 TSE may deter misinterpretation of pseudoenhancement of the distal labyrinthine segments of the facial nerve owing to dural convergence at the distal internal auditory canal; this finding is in line with that of a previous study that revealed more prominent normal dural enhancement with 3D T1 MPRAGE compared with 3D T1 mVISTA.11 We speculate that these advantages contributed toward significantly improved lesion conspicuity with 3D T1 TSE than with 3D T1 FSPGR for the inexperienced reader and significantly shorter time to diagnosis with 3D T1 TSE for both readers. Furthermore, unlike the previous studies of Oh et al13 and Gil et al,15 we randomly shuffled the scan order of 3D T1 TSE and 3D T1 FSPGR; thus, our study may be free from the reported bias that contrast enhancement increases over time.19,20
Our study revealed that there was lower sensitivity, specificity, and accuracy with 3D T2 FLAIR than with 3D T1 TSE for both the inexperienced and experienced readers, with the exception of specificity for the experienced reader. Compared with T1 GRE, T2 FLAIR is considered a more sensitive sequence for the evaluation of meningeal enhancement.8,16,21 Meanwhile, controversial results have been reported regarding the comparison of T2 FLAIR with 3D T1 TSE for the detection of leptomeningeal abnormalities.9,22 Park et al9 revealed that 2D T2 FLAIR could show a greater extent of leptomeningeal metastases than 3D T1 TSE; however, in a subgroup analysis for cranial nerve, there was no significant difference in the ability of detecting cranial nerve enhancement between the 2 sequences. Jeevanandham et al22 concluded that postcontrast 3D T1 SPACE imaging adds significantly more information to postcontrast 3D T2 FLAIR in dural and sulcal space enhancement. At the lower contrast concentration, we observed that the signal intensities were higher with 3D T2 FLAIR than with 3D T1 TSE; however, when dividing the signal intensities by the normal WM, the signal intensity ratio was higher for 3D T1 TSE (from 0.7 mmol/L to 2 mmol/L) than for 3D T2 FLAIR. We speculated that our result (ie, low sensitivity and accuracy demonstrated by 3D T2 FLAIR) may be attributed to its intrinsic high signal intensity for the cranial nerves, which might interfere with the visual assessment of subtle contrast enhancement. According to a previous study involving patients with Bell palsy, a quantitative analysis of the facial nerve on pre- and postcontrast 3D T2 FLAIR showed an increased diagnostic performance to “visual assessment alone” on postcontrast 3D T2 FLAIR; however, the sensitivity, specificity, and accuracy of postcontrast 3D T2 FLAIR images were lower than those of CE T1 spin-echo images in terms of visual assessment.23 In respect to clinically efficient scanning time, we also observed that 3D T1 TSE had advantages over 3D T2 FLAIR, which took >5 minutes, when the same parallel imaging factor was applied. By adding the parallel imaging factor to 3D T1 TSE, the scanning time of 3D T1 TSE was equivalent to that of 3D T1 FSPGR (3D T1 TSE versus 3D T1 FSPGR; 3 minutes 43 seconds versus 3 minutes 44 seconds using Achieva; 3 minutes 55 seconds versus 3 minutes 50 seconds using Signa Architect). Thus, we surmise that 3D T1 TSE, a sequence that allows instinctive assessment of abnormal nerve enhancement on postcontrast images alone, may be a practical sequence in daily clinical work.
This study has several limitations. First, the study population was relatively small. However, cranial neuritis is an uncommon disease entity,24 and we believe that our cohort may have been representative of the targeted patient population. Second, we only assessed the cistern segments of the cranial nerves. When the venous plexus in the cavernous sinus shows prominent enhancement but the nerves are best depicted as black structures, contrast enhancement of the nerves is often evaluated as the loss of the boundary with the surroundings.25 Therefore, we inevitably could only study the cistern segments of the cranial nerves to assess the degree of contrast enhancement based solely on the contrast leakage through the blood-nerve barrier. Third, we did not assess the precontrast image as a reference for contrast enhancement, using instead the genu of the facial nerve to this end. However, we believe that a sequence that allows prompt visual assessment of contrast enhancement on a postcontrast enhanced image is appropriate for daily practice.
CONCLUSIONS
3D T1 TSE black-blood imaging showed significantly greater diagnostic performance for cranial neuritis, especially for the inexperienced reader, than T1 FSPGR and 3D T2 FLAIR imaging. Moreover, for the experienced reader, 3D T1 TSE also showed significantly higher sensitivity, specificity, and accuracy than 3D T2 FLAIR. Our results suggest that 3D T1 TSE is a clinically useful sequence for the evaluation of abnormal cranial nerve enhancement, especially for beginners in neuroradiology or general radiologists, because it improves lesion conspicuity.
ACKNOWLEDGMENTS
The authors thank Seonguk Jin, Bayer Schering Pharma, for providing the contrast concentration phantom and Ho-Joon Lee (coauthor) for volunteering to undergo scanning for the clinical phantom study.
Footnotes
This work was supported by the 2019 Inje University research grant.
Disclosures: Yeonah Kang—RELATED: Grant: Inje University*, Comments: This work was supported by the 2019 Inje University research grant. *Money paid to the individual author.
References
- Received July 25, 2020.
- Accepted after revision November 24, 2020.
- © 2021 by American Journal of Neuroradiology


Jump to section
Related Articles
Cited By...
- No citing articles found.