Abstract
BACKGROUND AND PURPOSE: The role of functional MR (fMR) imaging in the evaluation of patients with epilepsy has not been systematically studied. Our purpose was to identify the fMR correlates of interictal epileptiform discharges.
METHODS: Twenty patients with epilepsy and frequent interictal discharges were studied with concurrent EEG monitoring on a 1.5-T echo-planar magnet to acquire blood-oxygenation-level–dependent (BOLD) images in the baseline (OFF) and immediate post-discharge (ON) states. Analysis was performed using subtraction of average ON and OFF data (method I); cross-correlation analysis between the ON and OFF states (method II); and individual spike analysis (ISA), with which signal intensity in the individual ON states was statistically analyzed using a weighted comparison with the mean and variance of the OFF states (method III). Agreement of fMR activation with EEG localization was determined.
RESULTS: Eighteen of 20 patients had interictal discharges during the monitoring period. Method I yielded visually detectable sites of BOLD signal differences in only one patient. Method II resulted in two patients with sites of BOLD activation. Method III, ISA, resulted in regions of increased BOLD signal corresponding to the EEG focus in nine of 10 patients.
CONCLUSION: fMR studies can often reveal sites of increased BOLD signal that correspond to sites of interictal EEG discharge activity. Because of variable intensity changes associated with discharge activity, ISA resulted in increased sensitivity.
The role of functional MR (fMR) imaging in the evaluation of patients with epilepsy has not yet been systematically studied. Several isolated case reports of hyperperfusion associated with seizures (1–4) and subclinical interictal repetitive discharges (5) have been documented by fMR imaging. One isolated case report documented regional CBF and glucose uptake produced by interictal discharges revealed by positron-emission tomography (6). Although fMR imaging, as well as other techniques for imaging patients with seizures involving rhythmic movements, especially of the head or extremities, would be impractical and unlikely to be of benefit, most epileptic patients have subclinical interictal epileptogenic discharges, and these are more suitable for assessment. Although these interictal discharges are often unassociated with movement, they may implicate the actual site of a seizure focus. The ability to localize these regions in medically refractory epilepsy may eventually benefit patients by allowing precise localization of the seizure focus and by providing insight into the mechanisms and pathways associated with abnormal brain foci. This subgroup of patients frequently does not manifest head movements that would preclude assessment by fMR techniques. In contrast, actual seizure events are rarer than interictal discharges and involve more frequent motor manifestations. These are therefore less amenable to study.
Previous work has shown that concurrent EEG monitoring is possible during MR imaging with minimal artifact, resulting in legible tracings obtainable except during the brief period of data acquisition required by the MR pulse sequence (7). With echo-planar imaging, this period of data acquisition can be minimized to approximately 100 milliseconds. Blood-oxygenation-level–dependent (BOLD) images sensitive to flow-related changes in venous deoxyhemoglobin can be rapidly obtained immediately after the real-time identification of an abnormal EEG discharge to provide an indirect means of assessing perfusion changes. A several-second latency has been noted between the onset of cerebral activation and increased MR signal intensity (8). Consequently, a small period of latency after the EEG discharge may be of benefit. We evaluate the potential for fMR imaging, with acquisitions triggered by interictal epileptiform discharges, to identify corresponding spatial and temporal foci of cerebral activation.
Methods
We studied 20 patients with focal epilepsy predominantly involving the temporal lobe who had frequent interictal discharges, as documented by previous telemetry. Informed consent was obtained before the studies were conducted. The patients ranged in age from 20 to 42 years, with a mean age of 35 years. There were 11 women and nine men.
Concurrent EEG monitoring with Grass gold or silver MR-compatible electrodes using 18-channel recording was performed during the 1- to 2-hour period of MR imaging by a technique previously described (7) and modified to include a fiberoptic cable traversing the MR shielding enclosure. In most cases, the majority of the time is spent with the patient at rest. The imaging time can range from 1% to 50% of the time in the scanner and is dependent on the frequency of the interictal discharges.
The MR studies were performed on a modified 1.5-T Vision magnet with echo-planar capability (Siemens, Erlangen, Germany). A 3D MPRAGE sagittal T1-weighted turbo fast low-angle shot sequence (11.4/4.4 [TR/TE]; flip angle, 15°) was initially obtained to allow anatomic overlay of the fMR images. A matrix size of 256 × 256 and a field of view of 240 mm were used, with an imaging time of 6 minutes 20 seconds. The parameters of the BOLD sequence (>2000/64), a single-shot echo-planar pulse sequence, were as follows: section thickness, 5 to 8 mm; total acquisition, eight to 11 sections; matrix, 128 × 128 mm; and field of view, 240 mm. The total acquisition time was typically 2 seconds.
During the 1- to 2-hour period of monitoring, the EEG tracing was visually assessed for the presence of abnormal discharges, and a manual triggering of data acquisition ensued. Abnormal discharges were defined according to standard electrophysiologic criteria by a board-certified epileptologist (A.B.) or by an experienced electroencephalographer (J.R.I.). Data were obtained immediately after a discharge (with an approximately 2- to 3-second latency period) and during the baseline state, with a quiescent period of 15 seconds or longer without an abnormal EEG discharge (Fig 1). The data were then transferred to a workstation and analyzed off-line.

Diagram illustrating the acquisition of MR data triggered to the presence (ON state) or absence (OFF state) of an EEG discharge.
Patient baseline BOLD data were initially reviewed as a movie, and patients with visually appreciable motion were excluded from subsequent analysis (n = 3). Analysis was performed using three methods. With method I, the mean data for the aggregate of ON and OFF states were computed using Advanced Visual Systems Software software (Advanced Visual Systems, Inc., Waltham, MA), and then difference images were visually evaluated (n = 12). With method II, a cross-correlation analysis between the ON and OFF states was performed using Advanced Visual Systems software with thresholding and subsequent visual assessment of the resultant images (n = 12). With method III, an individual spike analysis (ISA) was conducted. Mean and variance images were computed from the OFF state, and the individual ON state images were analyzed in relationship to these by using a weighted ON state derived image with Modular Software Package/Cube software (Intelligent Solutions, Cambridge, MA) (n = 10). Two patients could not be analyzed because of data archive loss. Method III is mathematically expressed by the following equation:  where Io is the signal intensity in the active voxel, “baseline” is the mean baseline intensity, σ is the standard deviation of the signal intensity in the OFF voxel from the mean, and I is the derived weighted intensity. The derived images were viewed individually and were visually evaluated. Bright regional areas were determined by the concordance of two or more observers (M.R.P., A.B., J.D.P., N.Y., J.R.I.). Statistical evaluation of these regions was concurrently available.
The anatomic scoring was based on localization to a geographic region within a parenchymal portion of the cerebral hemisphere. The EEG interictal discharge was specifically localized to one or more of the following regions: the medial temporal, anterolateral temporal, posterolateral temporal, anterior frontal, posterior frontal, parietal, or occipital lobe. EEG localization is thought to represent a 6-cm2 patch of cortex.
The concordance of these sites of increased BOLD signal with EEG localization was then assessed. Subsequently, computer-generated automated border recognition software was used to define the site of BOLD activation corresponding to the EEG discharge. A color overlay with an anatomic T1-weighted image reconstructed from a 3D T1-weighted MPRAGE acquisition was produced. Regional statistics of the area of activation were also determined, including the maximum and mean positive z score, and the standard error of the mean.
Results
During the 1- to 2-hour monitoring period, two of 20 patients did not have interictal discharges. Of the remaining 18 patients, five had 11 to 20, one had 21 to 30, two had 31 to 40, and two had 51 to 60 interictal discharges each. Three were excluded because of appreciable motion artifact seen on a movie presentation of the BOLD OFF data set. An additional three patients were excluded from analysis after determining that the interictal events were not localizing and were atypical from those revealed by previous telemetry results. In the resultant 12 patients, visual evaluation of the difference image constructed from the mean ON and OFF states (method I) resulted in only one patient with foci of bright signal to suggest BOLD activation. Cross-correlation analysis with visual evaluation and interactive thresholding (method II) yielded positive results in only two of these patients. A summary of the results by the different methods is presented (Table).
fMR BOLD activity correlation with EEG localization
Of the 10 patients available for ISA, with voxel signal-intensity-weighted analysis of the individual ON states, a bright signal was seen in nine and correlated with the site of EEG discharge. For the two patients who were unavailable for ISA, activation was not shown by either subtraction or cross-correlation techniques. Two representative patients follow.
Patient 1 was a 58-year-old right-handed woman with focal onset and secondarily generalized seizures that began at age 42 years, 1 month after she was involved in a motor vehicle accident and suffered a concussion. The EEG revealed left medial and lateral temporal epileptiform discharges. Figure 2 shows the fMR BOLD signal localization to the left temporal lobe.
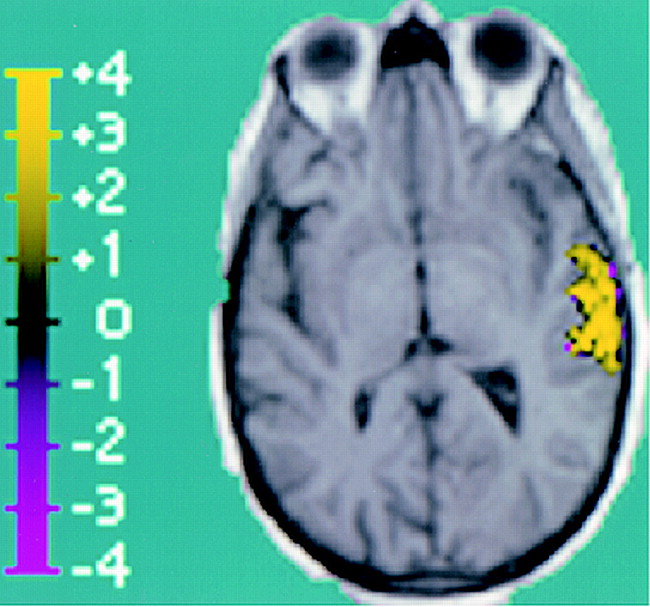
Composite image showing BOLD activation superimposed over T1-weighted anatomic image (reconstructed from 3D MPRAGE acquisition), which corresponds to EEG activity. The region of activation covers a 4.8-cm2 area of the left lateral temporal lobe. This region is distinguished by high positive z scores, with a positive z score maximum of 6.2 and a mean of 2.6 ± 1.1 (standard error, 0.1).
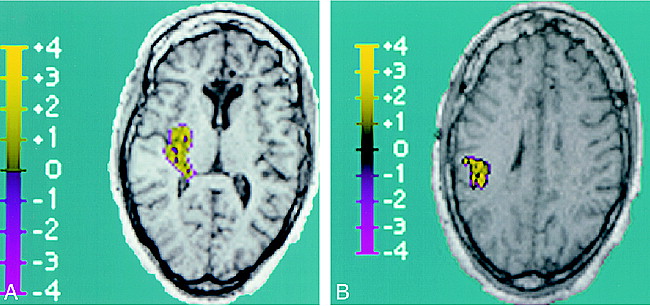
Patient 2 was a 36-year-old right-handed woman with medically intractable epilepsy despite numerous trials of antiepileptic drugs in multiple combinations since she was 9 years old. She underwent a corpus callosotomy in 1989 to help reduce her overall seizure burden and particularly to alleviate atonic events. The EEG revealed right posterior temporal epileptiform activity. Figure 3 illustrates the BOLD fMR localization to the right posterior temporal lobe with a small contiguous focus within the right anterior parietal lobe. Note that these cases also showed a border of negative standard deviations of signal intensity.

Composite images showing BOLD activation superimposed over T1-weighted anatomic image (reconstructed from 3D MPRAGE acquisition), which corresponds to EEG activity.
A, Right posterior temporal lobe BOLD activation is shown. The region of activation covers a 4.4-cm2 area, with a positive z score maximum of 2.9 and a mean of 1.2 ± 0.6 (standard error, 0.06).
B, Additional focus of right parietal BOLD activation is seen, which is in contiguity with the posterior temporal lobe activation above. Within this 3.2-cm2 region of activation, the positive z score maximum was 3.6, with a mean of 1.6 ± 0.8 (standard error, 0.1).
The BOLD fMR signal activation was seen only in a subset of the EEG discharges. This is thought to be partially because of the intrinsic heterogeneity of the EEG discharges, as well as the variable timing of the fMR acquisitions relative to the onset of the EEG discharges. The use of the ISA technique resulted in a sensitivity of 90% of fMR imaging correlation with EEG discharge localization. In one patient, the contralateral temporal lobe was noted to have increased BOLD signal, and this region may represent an additional epileptogenic source.
Discussion
We show that BOLD fMR imaging with simultaneous 18-channel EEG recording can yield a sensitivity of 90% in identifying sites of cerebral activation that correspond to sites of potential epileptogenesis. This requires analysis techniques (ISA) that evaluate each ON state in comparison with the mean and variance of the OFF state signal intensities. Case reports of BOLD fMR cerebral activation with epilepsy have been reported using subtraction (4) or cross-correlation (3, 4) techniques. Our series shows those methods to be insensitive. It is likely that the interictal discharges are not identical, and treating them as an aggregate state diminishes the sensitivity. We show that a single fMR acquisition with a concurrent epileptiform discharge can result in increased BOLD signal that correlates with the EEG focus. We propose that a single event strategy be the method of choice for evaluating BOLD activation associated with an interictal discharge.
The rim of negative standard deviations around activation sites may represent associated diminished activity. We looked for correlates between observed activation and semiologic features, such as post-traumatic origin of seizures, amplitude of EEG activity, and degree of medication usage, but did not discern any differences. The maximum time course of BOLD signal response relative to the onset of the interictal discharge remains to be established, and whether this is analogous among diverse patients and types of discharge is unknown. Also, remaining to be determined is whether there is a sequential spatial activation or recruitment of larger adjacent areas over time. The population is not yet large enough to determine the factors that result in variable responses of BOLD activation.
These fMR techniques may help localize seizure onset to the smallest site of abnormal epileptogenic tissue, thereby offering guidance for surgical cure. We expect that fMR techniques will evolve to provide a means of determining the site of origin and propagation pattern of seizures.
Footnotes
1 This manuscript was presented at the 1998 Annual Meeting of the ASNR, and this work was funded by an RSNA seed grant.
2 Address reprint requests to Mahesh R. Patel, MD, Department of Radiology, SCC-4th Floor, Beth Israel Deaconess Medical Center, Harvard Medical School, 330 Brookline Avenue, Boston, MA 02215.
References
- Received January 14, 1999.
- Copyright © American Society of Neuroradiology