Abstract
BACKGROUND AND PURPOSE: Oxygen-induced CSF hyperintensity on FLAIR MR imaging is often observed in sedated children. This phenomenon can mimic leptomeningeal pathology and lead to a misdiagnosis. The purpose of this study was to investigate whether magnetization-prepared FLAIR MR imaging can reduce oxygen-induced CSF hyperintensity and improve image quality compared with conventional (non-magnetization-prepared) FLAIR MR imaging.
MATERIALS AND METHODS: Bloch simulation for magnetization-prepared and non-magnetization-prepared FLAIR sequences was performed for tissue contrast. We retrospectively reviewed 85 children with epilepsy who underwent MR imaging under general anesthesia with supplemental oxygen (41 with non-magnetization-prepared FLAIR and 44 with magnetization-prepared FLAIR). CSF hyperintensity was scored from 0 to 3 points according to the degree of CSF signal intensity and was compared between the 2 sequences. The contrast-to-noise ratios among GM, WM, and CSF were evaluated to assess general image quality from both sequences. To assess the diagnostic accuracy for hemorrhage, we reviewed an additional 25 patients with hemorrhage.
RESULTS: Bloch simulation demonstrated that CSF hyperintensity can be reduced on magnetization-prepared FLAIR compared with non-magnetization-prepared FLAIR. CSF hyperintensity scores were significantly lower in magnetization-prepared FLAIR than in non-magnetization-prepared FLAIR (P < .01). The contrast-to-noise ratios for GM-WM, GM-CSF, and WM-CSF were significantly higher in magnetization-prepared FLAIR than in non-magnetization-prepared FLAIR (P < .05). Hemorrhage was clearly demarcated from CSF hyperintensity in the magnetization-prepared group (100%, 12/12) and non-magnetization-prepared group (38%, 5/13).
CONCLUSIONS: Magnetization-prepared 3D-FLAIR MR imaging can significantly reduce oxygen-induced CSF artifacts and increase the tissue contrast-to-noise ratio beyond the levels achieved with conventional non-magnetization-prepared 3D-FLAIR MR imaging.
ABBREVIATIONS:
- MP
- magnetization-prepared
- oxy-CSF
- oxygenated CSF
MR imaging is the diagnostic tool of choice in pediatric neurologic diseases because it has no ionizing radiation and is noninvasive. However, sedation is unavoidable if suitable MR images are sought because pediatric patients usually do not cooperate during long-duration scans.
CSF hyperintensity on FLAIR MR images is frequently encountered in sedated children.1⇓⇓⇓–5 These artifacts cause a diagnostic dilemma because they can mimic hemorrhage, infection, and leptomeningeal seeding metastasis, which are all known to generate hyperintense CSF signals on FLAIR MR images.6⇓⇓–9 Initially, CSF hyperintensity was attributed to anesthetic-induced T1-shortening, protein redistribution due to changes in the intravascular membrane permeability, hyperdynamic CSF pulsation due to altered vascular tone, and supplemental oxygen during anesthesia.2⇓–4,10 However, several studies have revealed that the most plausible cause of hyperintense CSF artifacts in FLAIR imaging is the administration of supplemental oxygen during anesthesia.1,2,4,5,10
Oxygen is a weak paramagnetic substance, which has 2 unpaired electrons that can cause a moderate increase in the T1 relaxation rate.11,12 Studies have shown that the diffusional transfer of oxygen from blood to CSF and a consequent FLAIR MR signal increase depend on the inhaled oxygen concentration1,2,4,13 and oxygen delivery methods.3,10
3D-FLAIR imaging is based on the 3D TSE imaging technique that modulates a refocusing flip angle at the TSE echo-train to maintain relatively steady signal levels during a long train of echo signals, which can provide improved image sharpness, helpful in detecting small structures. Consequently, the relaxation-induced image blurring, partial volume effect, and specific absorption rate can be reduced allowing high-resolution 3D data acquisition at isotropic voxels during clinically feasible scan durations.14 3D-FLAIR also provides increased SNR and reduces CSF pulsation artifacts compared with 2D FLAIR.5,15⇓⇓–18 In magnetization-prepared (MP) 3D-FLAIR imaging, a dedicated magnetization preparation is implemented before typical inversion recovery, followed by TSE imaging, which is known to reduce unwanted T1-weighting and image TR.19,20 Therefore, the purpose of this study was to compare magnetization-prepared 3D-FLAIR imaging with conventional (non-MP) 3D-FLAIR imaging in terms of the ability to reduce oxygen-induced CSF hyperintensity and improve image quality in sedated pediatric patients.
Materials and Methods
Study Population
We retrospectively screened consecutive children with epilepsy who were referred to our pediatric neurology outpatient clinic from June 2014 to June 2015. This retrospective study was approved by the institutional review board of Severance hospital. We included patients who underwent MR imaging by using a routine seizure protocol in the hospital and excluded patients with a history of brain operations due to the possibility of metal artifacts. We identified 85 pediatric patients (51 boys and 34 girls; age range, 0–12 years; mean age, 6 years). Detailed demographic characteristics and MR imaging findings are described in Table 1.
Demographic characteristics and MRI findings
To assess the diagnostic accuracy for hemorrhage, we additionally included in the study 25 patients (17 boys and 8 girls; age range, 0–10 years; mean age, 5 years) who underwent neurosurgery due to epilepsy in our hospital from June 2014 to June 2015. These patients underwent immediate postoperative brain CT and MR imaging sequentially within 3 days after the operation. Hemorrhage was detected on their brain CTs. Patients were excluded if hemorrhage was not detected on the brain CT scan. In most cases, the preoperative MR imaging findings were normal (11/25, 44%); however, cortical malformation (9/25, 36%), ischemia (3/25, 12%), tumor (6/25, 24%), and hippocampal sclerosis (1/25, 4%) were also observed. The most frequent type of operation performed was callosotomy (13/25, 52%), followed by lesionectomy (6/25, 24%), lobectomy (4/25, 16%), and hemispherectomy (2/25, 8%).
MR Imaging
All pediatric patients were examined with 1 of 2 3T MR imaging scanners (Achieva; Philips Medical System, Best, the Netherlands). One MR imaging scanner was operated with the conventional (non-MP) 3D-FLAIR imaging protocol, and the other MR imaging scanner was operated with the MP 3D-FLAIR imaging protocol due to the difference in the MR imaging scanner software versions. Patients were randomly assigned to 1 of the 2 MR imaging scanners according to a patient schedule and the availability of the scanners. The scan parameters for FLAIR imaging were optimal for suppression of CSF signals and are used for nonsedated adult patients in our institution. Detailed imaging and sequence timing parameters are shown in Table 2.
Imaging and sequence timing parameters for non-MP and MP 3D-FLAIR
In our pediatric neurology clinic, general anesthesia was recommended to achieve a suitable diagnostic quality in the acquired MR images. Parent consent was obtained by the anesthesiologist before each procedure. Anesthesia was induced at an infusion rate of 125–250 μg of propofol per kilogram of body weight per minute, and all patients breathed spontaneously with supplemental 70%–80% oxygen via a nasal cannula during anesthesia.
Simulation
The magnetization behavior was simulated by using Bloch equations for the current MR imaging sequence and parameters as shown in Fig 1 and Table 2, respectively. The magnetization preparation used in 3D-FLAIR included nonselective radiofrequency pulses that consisted of a 90° block pulse for excitation, followed by 4 hyperbolic secant adiabatic refocusing pulses and a −90° flip-up pulse (FU). This was followed by inversion recovery, fat-saturation, and TSE readout with a variable refocusing flip angle scheme available in the scanner.19 The longitudinal magnetization after magnetization preparation and inversion recovery before TSE readout can be represented as follows:
 where M0 is the equilibrium magnetization, Mz is the longitudinal magnetization, and τ1, τ2, τ3, and τ4 are the sequence timing parameters, as shown in Fig 1 and Table 2. The superscript “minus sign” represents the time before radiofrequency irradiation. When τ3 is negligible, Equation 1 can be reduced to
 and Equation 2 becomes Mz.19,20 When magnetization preparation is not used, longitudinal magnetization can be represented as follows:
 and Equation 3 becomes Mz for inversion recovery.13,19 The evolution of magnetization with and without magnetization preparation was simulated to determine T1-weighting and signal contrast among brain tissues. In the simulation, the imaging and sequence timing parameters used are shown in Table 2, and the tissue relaxation parameters are demonstrated in Table 3.13,21⇓⇓–24 Because there was no significant difference in the T2 relaxation constant between CSF and oxygenated CSF (oxy-CSF),10,13 the T2 relaxation constant for oxy-CSF was assumed to be equal to that of the CSF. The simulation was performed with effective TE, where the T2 contrast in the pure T2-weighting sequence was equivalent to the T2 contrast in a sequence with a long refocusing train of radiofrequency with a variable flip angle.19,25
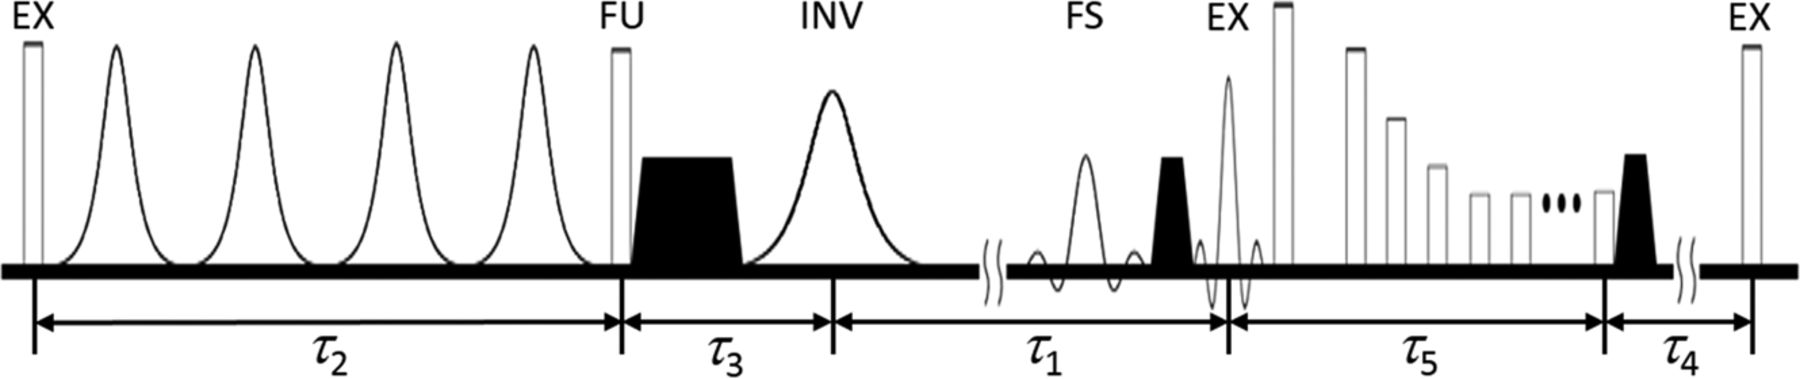
Pulse sequence diagram for MP 3D-FLAIR imaging. Magnetization preparation is implemented during τ2 with radiofrequency pulses for 90° excitation (EX), followed by T2-preparation and −90° flip-up (FU). FLAIR inversion recovery is achieved during τ1 with radiofrequency pulses for inversion (INV), followed by spectral fat saturation (FS) and TSE readout with 90° excitation (EX), followed by a train of refocusing pulses during τ5. τ3 and τ4 are the times for gradient spoiling and to the end of the current TR period, respectively. Black shaded trapezoids represent spoiling gradients to eliminate transverse magnetization.
Tissue relaxation parameters
Image Analysis
Two experienced neuroradiologists (S.J.A. with 4 years of experience in neuroimaging and J.K. with 10 years of experience in neuroimaging) were blinded to the patient information and imaging sequences. In the first session, the investigators independently evaluated CSF hyperintensity on non-MP 3D-FLAIR and MP 3D-FLAIR images, modifying a previous method.5 Imaging data were randomly assigned to each reader. CSF hyperintensity artifacts were scored from 0 to 3 according to the degree of the CSF signal intensity: 0, no visual CSF signal; 1, homogeneous diffuse minimal CSF signal; 2, CSF signal similar to that of the pons; 3, CSF signal higher than that of the pons (On-line Fig). The premedullary, prepontine, suprasellar, basal, ambient, quadrigeminal cistern, and sulci regions of the cerebral convex were evaluated. The averaged values of CSF hyperintensity from each neuroradiologist were used for further analysis.
To assess tissue contrast on 2 sequences, a third neuroradiologist (S.W.O. with 2 years of experience in neuroimaging) independently drew 4 circular ROIs (area = 10 mm2) in the caudate nucleus of the right basal ganglia and averaged the values representing GM. He was blinded to the patient information and sequences. Averaged values for the ROIs from the right frontal subcortical WM and adjacent lateral ventricle at the same plane represent WM and CSF, respectively. To ensure identical placement of the ROIs on both sequences, he carefully positioned the ROIs by hand in the same region of both images. Contrast-to-noise ratios were calculated among the GM, WM, and CSF. A contrast-to-noise ratio was defined on the basis of the signal intensity (SI) and SD in the ROI as follows:
 where the subscripts i and j for SI and SD represent tissue types, such as GM, WM, or CSF.
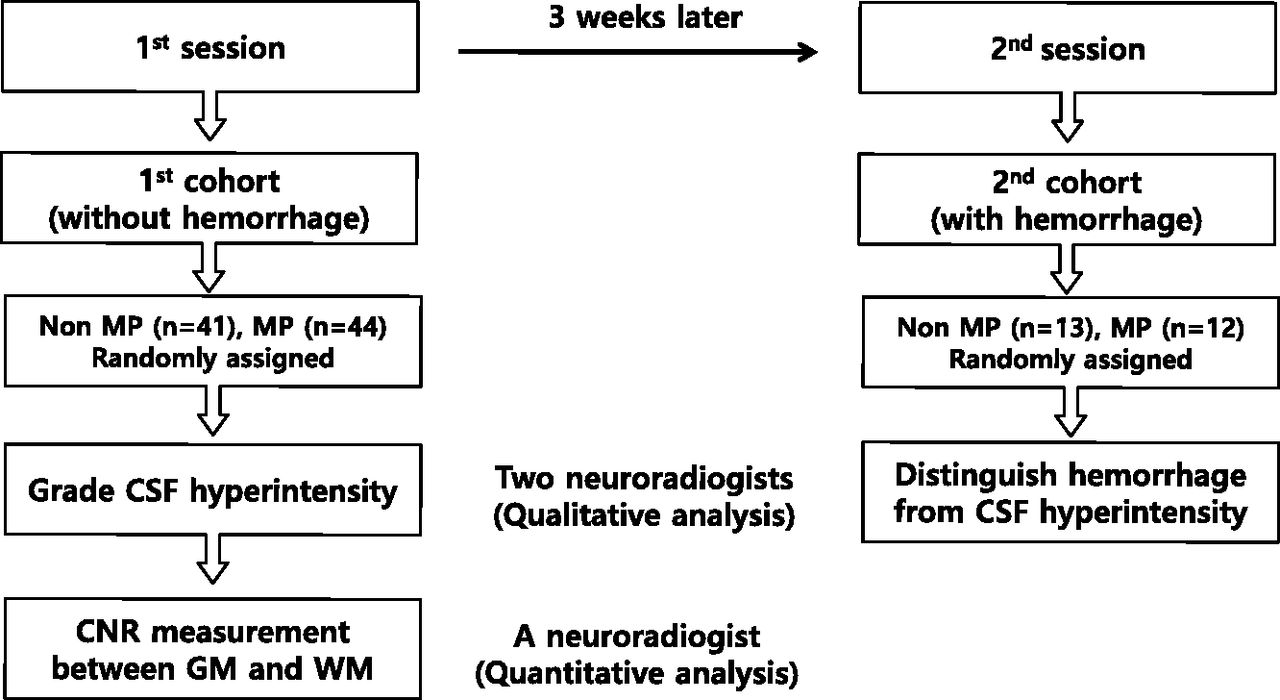
Three weeks later, in the second session, the first 2 radiologists assessed whether the intracranial hemorrhage that occurred after neurosurgery could be clearly demarcated from CSF hyperintensity in the second study population. The decision for discrepant cases was established by consensus between the 2 neurologists. The flow chart for image analysis is summarized in Fig 2.

Flow chart for image analysis. CNR indicates contrast-to-noise ratio.
Statistical Analysis
CSF hyperintensity artifact scores for the premedullary, prepontine, suprasellar, basal, ambient, quadrigeminal cistern, and sulci regions of the cerebral convex were compared between non-MP 3D-FLAIR and MP 3D-FLAIR images by using the Student t test. Interobserver agreement for CSF hyperintensity was analyzed by using κ statistics. The contrast-to-noise ratios (GM/WM, GM/CSF, and WM/CSF) were compared between the 2 FLAIR MR imaging sequences. Statistical analyses were performed by using commercial software (MedCalc for Windows, Version 10.1.2.0; MedCalc Software, Mariakerke, Belgium). A P value < .05 was statistically significant.
Results
Figure 3 shows the simulation results for the evolution of steady-state magnetization for the non-MP and MP sequences by using imaging and sequence timing parameters and tissue relaxation constants. Magnetization preparation (τ2) induced lower T1-weighting than the non-MP sequences. Finally, oxygen-induced CSF hyperintensities were markedly reduced, and the contrast between GM and WM was enhanced at the TE on MP FLAIR images compared with non-MP FLAIR images (see magnified view in Fig 3).
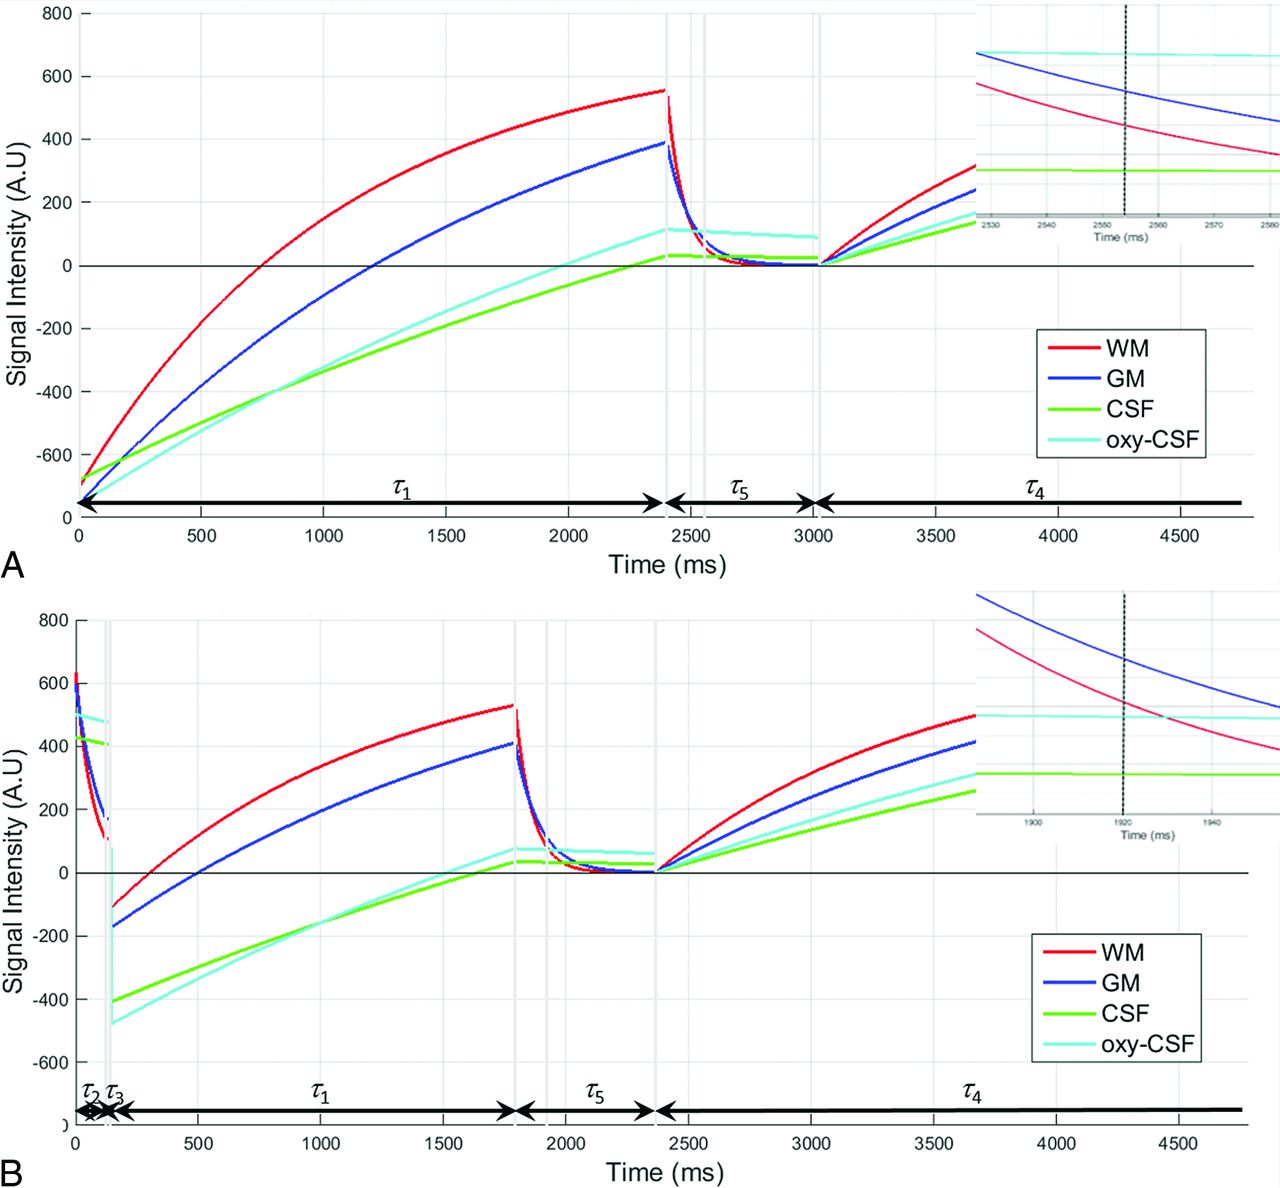
Simulation results for the evolution of steady-state magnetization for each type of tissue (WM, GM, CSF, and oxy-CSF) are presented for non-MP (A) and MP (B) FLAIR sequences. Imaging and sequence timing parameters (Table 2) and tissue relaxation constants (Table 3) were used in simulation. Sequence timing parameters (τ1 ∼ τ5) are presented along with the time axis at each figure. An inset within each figure presents a magnified segment of the evolution of magnetization around the TE (dotted black vertical line). A.U. indicates arbitrary unit.
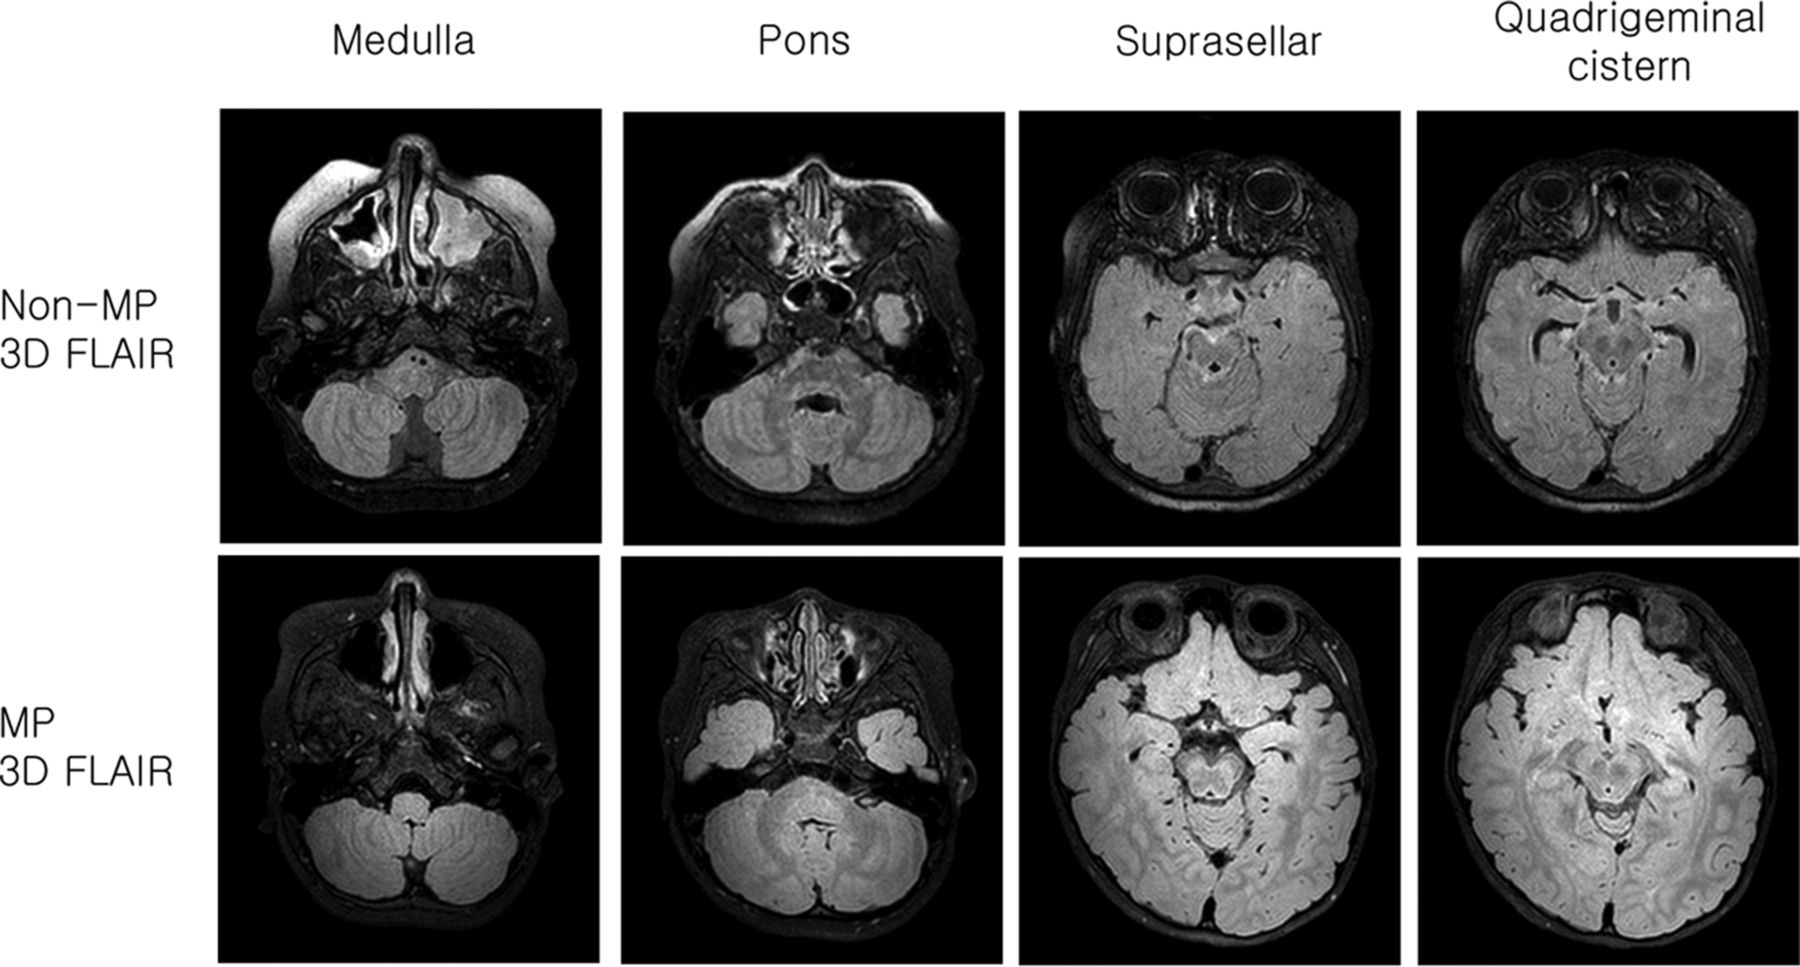
CSF hyperintensity artifact scores for the premedullary, prepontine, suprasellar, basal, ambient, quadrigeminal cistern, and sulci regions of the cerebral convex were significantly lower in MP 3D-FLAIR than in non-MP 3D-FLAIR (Fig 4 and Table 4). The interobserver agreement between the 2 readers was excellent for CSF hyperintensity artifact scores (κ > 0.85).

The non-MP 3D-FLAIR sequences of a 3-year-old boy with epilepsy (upper row). CSF hyperintensity artifact scores totaled 17 (premedullary cistern, 2; prepontine cistern, 2; suprasellar cistern, 3; basal cistern, 3; ambient cistern, 3; quadrigeminal cistern, 3; sulci of cerebral convex, 1). MP 3D-FLAIR sequences of a 4-year-old boy with epilepsy (lower row). CSF hyperintensity artifact scores totaled 4 (premedullary cistern, 0; prepontine cistern, 0; suprasellar cistern, 1; basal cistern, 1; ambient cistern, 1; quadrigeminal cistern, 1; sulci of the cerebral convex, 0).
Hyperintense CSF artifact scores and CNR between GM and WM
The contrast-to-noise ratio values for GM-WM, GM-CSF, and WM-CSF were significantly higher on MP 3D-FLAIR than on non-MP 3D-FLAIR (Table 4).
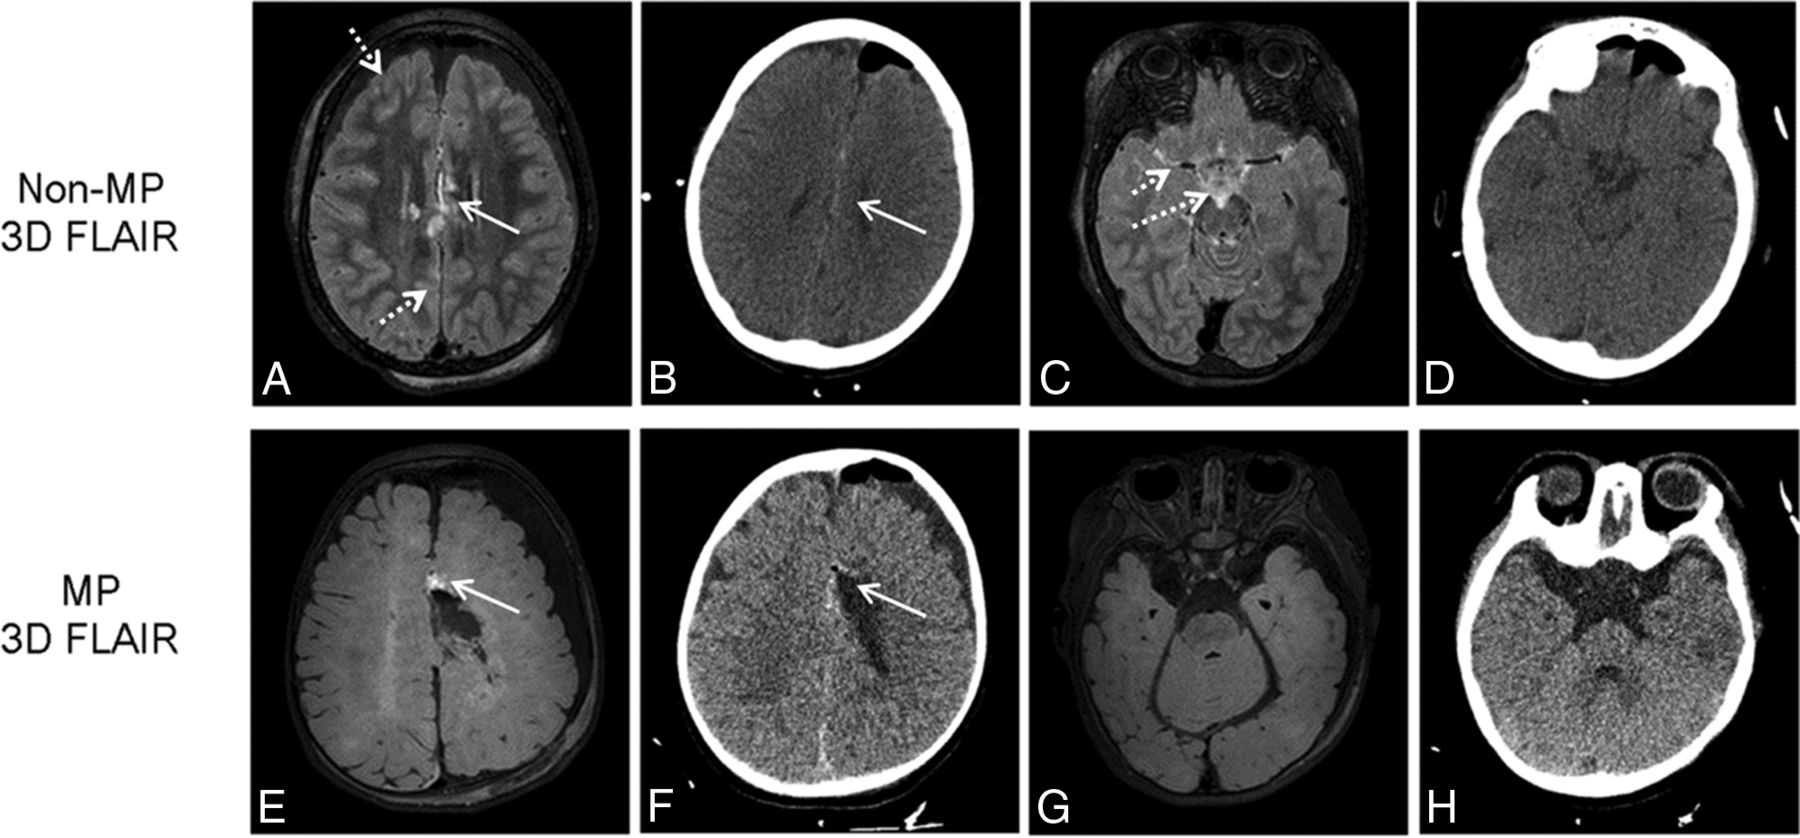
Hemorrhage was clearly demarcated from CSF hyperintensity in all 12 patients who underwent the MP sequence but in only 5 of 13 patients (38%) who underwent the non-MP sequence (Fig 5). There were no instances of discrepancy between the investigators.

The subdural hemorrhage (solid arrow) is suspected in the non-MP 3D-FLAIR (upper row) of a 5-year-old girl after a callosotomy, which is also observed in the immediate postoperative CT scan. However, it is not clearly demarcated from CSF hyperintensity artifacts (dotted arrow). Hemorrhage (solid arrow) is clearly demarcated in the MP 3D-FLAIR (lower row) of an 8-month-old boy after lesionectomy, which is also observed in the immediate postoperative CT scan because CSF hyperintensity artifacts are suppressed.
Discussion
In this study, we found that oxygen-induced CSF hyperintensity was significantly reduced in MP 3D-FLAIR compared with non-MP 3D-FLAIR. Moreover, MP 3D-FLAIR provided higher contrast-to-noise ratios among GM, WM, and CSF than non-MP 3D-FLAIR. The clinical implications of this observation are important because supplemental oxygen-induced hyperintense CSF artifacts can reduce the diagnostic accuracy of CSF pathology in sedated pediatric patients.1,10 Therefore, MP 3D-FLAIR can improve the diagnosis rate of CSF abnormalities and provide enhanced contrast among GM, WM, and CSF.
Previous studies hypothesized that CSF hyperintensity is associated with anesthetic-induced T1 shortening or redistribution of proteins due to changes in intravascular membrane permeability. However, subsequent studies have revealed that this hypothesis might not be valid. For example, Deliganis et al2 investigated the impact of the T1 relaxation constant on different anesthetic solutions with varying anesthetic concentrations that ranged from low-to-high clinical dose levels. They found no major differences in T1 over diverse anesthetic concentrations. Anzai et al10 showed, in a phantom study, that no noticeable FLAIR signal changes were observed over various albumin concentrations, except at a very high concentration (>1250 mg/dL). The normal CSF protein content is 22–52 mg/dL26: 15–45 mg/dL in adults and 20–120 mg/dL in children.3 Vascular pulsation might partially explain CSF hyperintensity, but these effects can be reduced further by using 3D-FLAIR imaging in place of 2D FLAIR imaging.15⇓⇓–18 Additionally, pulsation artifacts can be easily distinguished by analyzing the signal-intensity pattern distributions throughout the brain.2
Studies claim that the most reliable explanation for CSF hyperintensity in sedated pediatric patients is attributable to the T1-shortening effect caused by the high concentration of paramagnetic supplemental oxygen administered during anesthesia. Moreover, various experimental factors (eg, inhaled oxygen concentrations and oxygen delivery methods) during supplemental oxygen administration are known to influence CSF hyperintensity. Deliganis et al2 found that a patient who received 50% supplemental oxygen did not demonstrate any CSF hyperintensity, whereas patients with 100% supplemental oxygen showed noticeable signal increases in FLAIR images. This finding was confirmed in the study by Frigon et al,4 in which CSF hyperintensity was observed in patients with 100% supplemental oxygen but only partial or no CSF hyperintensity was observed in patients with 30% oxygen inhalation. In a study with healthy volunteers, Anzai et al10 observed CSF hyperintensity with 100% supplemental oxygen but no visible CSF hyperintensity in room air conditions (21% oxygen inhalation). The oxygen delivery method affects the efficiency of oxygen transport from the blood to the CSF. Oxygen delivery methods (eg, loose oxygen mask, nonrebreathing oxygen mask, or nasal cannula) were also reported to be important factors that influence CSF hyperintensity.3,10
Oxygen distribution within the CSF is facilitated by diffusion of dissolved free oxygen from the blood into the CSF because there are no oxygen-carrying molecules such as hemoglobin or myoglobin in the CSF. Although dissolved free oxygen occupies only a small fraction of blood (<0.3%), a relatively large amount of inhaled oxygen can increase the concentration and facilitate oxygen transport into the CSF.2,10 The primary locations of oxygen entry into the CSF have been reported to be regions where large arterial vessels are lined with abundant pia-arachnoid surface areas.2,10 According to our results, CSF hyperintensity was more prominent in the suprasellar, basal, ambient, and quadrigeminal cistern than in the premedullary, prepontine cistern, and sulci regions of the cerebral convex on both MP and non-MP FLAIR sequences. These regional differences in the appearance of CSF hyperintensity can be explained by the following factors: First, the amount of CSF that surrounds the suprasellar, basal, ambient, and quadrigeminal cisterns is relatively small; therefore, there would be relatively less dilution of dissolved oxygen than in the premedullary and prepontine cisterns, which contain larger CSF pools.10 Second, the pituitary and pineal glands are circumventricular organs that have leaky blood-brain barriers, and they might facilitate the transport of dissolved oxygen into the CSF in the basal, suprasellar, ambient, and quadrigeminal cisterns.27 However, this regional differential appearance of CSF hyperintensity requires further investigation.
In this study, Bloch simulations were used to compare MP and non-MP FLAIR sequences with previously reported tissue relaxation properties and sequence timing parameters. The behavior of the simulated FLAIR signals was compatible with that in our in vivo observations, in which the magnitude of MR signals was oxy-CSF > GM > WM in non-MP FLAIR and GM > WM > oxy-CSF in MP FLAIR. The tissue magnetizations experienced inversion recovery in non-MP FLAIR, while they behaved more like saturation recovery in MP FLAIR,19 providing an oxy-CSF MP FLAIR longitudinal magnetization of only 67% to the non-MP FLAIR longitudinal magnetization before excitation (τ1). Therefore, superior suppression of CSF hyperintensity might be achieved in MP FLAIR compared with non-MP FLAIR. Because magnetization preparation reduces T1 shortening, it is possible that the sensitivity of the detection of leptomeningeal pathology also decreases. However, according to our results, hemorrhage was clearly demarcated from CSF hyperintensity on MP FLAIR, whereas it was difficult to differentiate hemorrhage from CSF hyperintensity on non-MP FLAIR. Reducing T1 shortening might not be enough to suppress the signal intensity of hemorrhage. In addition, suppression of CSF artifacts makes it easier to assess the extent of hemorrhage on MP 3D-FLAIR compared with non-MP FLAIR.
The magnetization preparation provided additional benefits other than reducing CSF hyperintensity. The desired T2 contrast can be compromised because of reducing unwanted T1-weighting. MP 3D-FLAIR imaging provided better T2-weighted contrast among GM, WM, and CSF than non-MP 3D-FLAIR imaging. The improved contrast between GM and WM is crucial for identifying and characterizing epileptogenic lesions.28 Therefore, MP 3D-FLAIR might also be helpful for detecting epileptic foci, which can be verified in a future study.
There were some limitations in this study. First, on FLAIR images, WM progressed from hyperintense to hypointense relative to adjacent GM during the first 2 years of life, which is slightly delayed compared with the observations on T2-weighted images.29,30 Therefore, young children with incomplete myelination may have different GM-MW contrast enhancements from those in older children. Our cohort was heterogeneous, ranging in age from 0 to 12 years, which might have affected the contrast-to-noise ratios. However, our Bloch simulation also supports our GM-WM contrast findings. Therefore, our results might be applicable to patients with complete myelination. Future studies with larger and more homogeneous populations are necessary to validate and extend these results. Second, in the simulation, we used an oxy-CSF T1 constant of 3510 ms on the basis of a study that used 1.5T MR imaging13 because the oxy-CSF T1 constant at 3T MR imaging was not available. However, the simulated FLAIR signal was comparable with that our in vivo observations. Accurate measurement of the oxy-CSF T1 constant at 3T MR imaging is required for more effective sequence design and in vivo application.
Conclusions
MP 3D-FLAIR imaging yields fewer CSF hyperintensity artifacts and provides superior contrast between GM and WM compared with non-MP 3D-FLAIR imaging. Therefore, we propose that MP 3D-FLAIR imaging provides better diagnostic accuracy in CSF pathologies and epileptogenic lesions in sedated pediatric patients who receive supplemental oxygen.
Footnotes
Disclosures: Ha-Kyu Jeong—RELATED: Employment: Philips Korea (regular salary).
This study was supported by the Dongkook Pharmaceutical Co, Ltd, Korea. The authors have no conflicts of interest that are directly relevant to the contents of this study.
References
- 1.
- 2.
- 3.
- 4.
- 5.
- 6.
- 7.
- 8.
- 9.
- 10.
- 11.
- 12.
- 13.
- 14.
- 15.
- 16.
- 17.
- 18.
- 19.
- 20.
- 21.
- 22.
- 23.
- 24.
- 25.
- 26.
- 27.
- 28.
- 29.
- 30.
- Received December 16, 2015.
- Accepted after revision January 5, 2016.
- © 2016 by American Journal of Neuroradiology