Abstract
BACKGROUND AND PURPOSE: The accuracy of preoperative blood oxygen level–dependent fMRI remains controversial. This study assessed the association between the anatomic location of a tumor and the accuracy of fMRI-based motor function mapping in diffuse lower-grade gliomas.
MATERIALS AND METHODS: Thirty-five patients with lower-grade gliomas involving motor areas underwent preoperative blood oxygen level–dependent fMRI scans with grasping tasks and received intraoperative direct cortical stimulation. Patients were classified into an overlapping group and a nonoverlapping group, depending on the extent to which blood oxygen level–dependent fMRI and direct cortical stimulation results concurred. Tumor location was quantitatively measured, including the shortest distance from the tumor to the hand knob and the deviation distance of the midpoint of the hand knob in the lesion hemisphere relative to the midline compared with the normal contralateral hemisphere.
RESULTS: A 4-mm shortest distance from the tumor to the hand knob value was identified as optimal for differentiating the overlapping and nonoverlapping group with the receiver operating characteristic curve (sensitivity, 84.6%; specificity, 77.8%). The shortest distances from the tumor to the hand knob of ≤4 mm were associated with inaccurate fMRI-based localizations of the hand motor cortex. The shortest distances from the tumor to the hand knob were larger (P = .002), and the deviation distances for the midpoint of the hand knob in the lesion hemisphere were smaller (P = .003) in the overlapping group than in the nonoverlapping group.
CONCLUSIONS: This study suggests that the shortest distance from the tumor to the hand knob and the deviation distance for the midpoint of the hand knob on the lesion hemisphere are predictive of the accuracy of blood oxygen level–dependent fMRI results. Smaller shortest distances from the tumor to the hand knob and larger deviation distances for the midpoint of hand knob on the lesion hemisphere are associated with less accuracy of motor cortex localization with blood oxygen level–dependent fMRI. Preoperative fMRI data for surgical planning should be used cautiously when the shortest distance from the tumor to the hand knob is ≤4 mm, especially for lower-grade gliomas anterior to the central sulcus.
ABBREVIATIONS:
- BOLD
- blood oxygen level–dependent
- DCS
- direct cortical stimulation
- DD
- deviation distance for the midpoint of the hand knob on the lesion hemisphere
- D-min
- the shortest distance from the tumor to the hand knob
The sensorimotor area is divided by a central sulcus. Because the anterior structure is responsible for motor function, brain tumors in this area cause transient motor function deficits and even permanent paralysis.1 It is crucial to identify the motor cortex accurately, especially areas relevant to hand movement. Previous studies have investigated various ways of localizing the motor cortex. The hypothesis that the hand knob (hand motor cortex), whose shape resembles the Greek letter Ω the in axial plane, represents the hand motor cortex is well-recognized.2 However, due to morphologic deviations, tumor infiltration, and edema, hand knobs cannot be localized through typical structural landmarks.3⇓–5 Hence, a novel method is needed to localize the motor cortex to achieve higher accuracy and reliability.
Blood oxygen level–dependent (BOLD) fMRI is a reliable preoperative method for mapping functional regions of the brain that allows assessment of the function of cortical and subcortical regions.6 BOLD fMRI helps neurosurgeons determine surgical strategy before an operation.7,8 Recently, fMRI was applied to help guide intraoperative direct cortical stimulation (DCS), the criterion standard for mapping the functional cortex.9,10 Motor cortical mapping was considered more accurate compared with language mapping via BOLD fMRI.11⇓⇓⇓–15 However, inaccurate localizations may sometimes misguide the process of motor functional preservation.11,16,17 In individual cases, BOLD fMRI identified the motor cortex on the posterior central gyrus18 or failed to localize the motor cortex.19 Here, we investigated the factors that affect the accuracy of motor area localization with BOLD fMRI.
Previous studies have suggested that inaccurate BOLD fMRI results are associated with certain tumor locations, neurovascular uncoupling, and functional reorganization.3,20⇓⇓–23 That tumor locations affect BOLD fMRI signals has been verified.21,24 Unfortunately, how tumor locations impact BOLD fMRI accuracy has not been quantified, to our knowledge. Tumors localized posterior to the central sulcus may not invade the precentral gyrus because of the barrier formed by the central sulcus and the ascending branch of the cingulate sulcus.25 It is unclear whether tumor location (anterior or posterior to the central sulcus) influences the accuracy of BOLD fMRI mapping.
This study investigated the association of tumor locations with the accuracy of BOLD fMRI–based localization using quantitatively assessed radiographic characteristics. Two parameters were assessed, namely the shortest distance from tumor to the hand knob (D-min) and the deviation distance for the midpoint of the hand knob on the lesion hemisphere (DD). We hypothesized the following: 1) Smaller D-min and larger DD would be associated with relatively poor BOLD fMRI accuracy, and 2) tumors anterior to the hand knob would notably decrease BOLD fMRI accuracy.
Materials and Methods
Patients
Thirty-five patients with lower-grade gliomas whose tumor involved motor areas were enrolled in this retrospective study. All patients underwent preoperative fMRI evaluations and awake craniotomy with intraoperative brain mapping between January 2014 and February 2016 at the Glioma Therapy Center at Beijing Tiantan Hospital. The criteria for inclusion were the following: 1) age older than 18 years, 2) no history of surgical treatment or radiation therapy, 3) no preoperative paralysis, 4) no contraindications to MR imaging, 5) distance from the tumor to the hand knob area of <20 mm, and 6) pathologically confirmed diffuse lower-grade gliomas. Subjects were subdivided into group A (the glioma was located anterior to the central sulcus) or group P (the glioma was located posterior to the central sulcus). We recruited 16 healthy subjects as the control group. This study was approved by the ethics committee of the Beijing Tiantan Hospital. Informed consent was obtained from all participants included in this study.
Anatomic Images: fMRI
MR imaging was performed with a Magnetom Prisma 3T scanner (Siemens, Erlangen, Germany). Anatomic images of each lesion were collected with T1 magnetization prepared rapid acquisition of gradient echo (TR, 2300 ms; TE, 2.3 ms; flip angle, 8°; FOV, 240 × 240 mm2; voxel size, 1.0 × 1.0 × 1.0 mm3; sections, 192; section thickness, 1 mm) and T2-weighted imaging (TR, 5000 ms; TE, 105 ms; flip angle, 150°; FOV, 240 × 240 mm2; voxel size, 0.5 × 0.5 × 3 mm3; sections, 33; section thickness, 3 mm).
Each subject received training for grasping before BOLD fMRI scans within 3 days of the scan. During the fMRI scan, subjects performed a motor task 4 times (twice with the ipsilateral hand and twice with the contralateral hand). The subjects grasped their hands at 1 Hz for 30 seconds, then rested for 30 seconds, and repeated this sequence 3 times during each scan. Before each scan, the magnetic field required 8 seconds to stabilize (On-line Fig 1). The subject relaxed for 20 seconds before each scan. The echo-planar imaging sequence collected the fMRI data (TR, 2000 ms; TE, 30 ms; flip angle, 90°; FOV, 240 × 240 mm2; voxel size, 3.0 × 3.0 × 3.0 mm3; sections, 30; section thickness, 3 mm).
DCS during Awake Craniotomy
Within 3 days after BOLD fMRI scans, all patients underwent awake craniotomy and intraoperative brain mapping with DCS to identify the hand motor cortex by one of the authors, who has considerable experience in awake craniotomy. The procedure was similar to that in previously published reports.16,26 We used an Ojemann Cortical Stimulator (Integra Life, Plainsboro, New Jersey) to stimulate the cortical and subcortical structures 3 times (intensity, 2–6 mA; frequency, 60 Hz; square wave and duration, 1 ms). We recorded unconscious hand movements during stimulation as positive controls. If at least 2 of the 3 stimulations induced hand movement, we labeled that position as a positive hand motor area, which should be protected during tumor removal. Each positive site was recorded by intraoperative photographs. Patients were anesthetized again after brain mapping and tumor resection. During DCS, no seizures occurred.
BOLD fMRI Data Processing
All BOLD fMRI data were processed with SPM8 software (http://www.fil.ion.ucl.ac.uk/spm/). The processing sequence was as follows: 1) realignment, 2) section timing, 3) smoothing, and 4) coregistering individual T1 images. In the smoothing step, a Gaussian kernel was used with a full width at the half maximum of 6 mm. The BOLD data were analyzed with a general linear model (family-wise error, P < .05). Up to 300 voxels were selected from the BOLD fMRI results to represent the hand motor area.
Anatomic Structure Data Analysis
Two parameters were established for this study. The first, D-min, represented the shortest distance from the tumor to the midpoint between both ends of the hand knob. The other, DD, represented the distance deviation between the hand knob midpoint in the lesion hemisphere and the equivalent hand knob midpoint in the healthy, contralateral hemisphere.
MRIcron (http://www.mccauslandcenter.sc.edu/mricro/mricron) was used to define the reference plane. In the axial plane, the reference plane was defined as the point where both sides of the hand knob were completely visible. Both D-min and DD were calculated at the reference plane.
D-min (Fig 1A), the midpoint of the hand knob (point C) in the lesioned hemisphere, was calculated on the basis of both of the hand knob end point coordinates (ie, points A and B). Subsequently, the point nearest on the tumor boundary (point D) to the midpoint of the hand knob (point C) was identified. Finally, D-min was calculated according to the coordinates of points C and D (calculative details are in the On-line Appendix, Part 1).
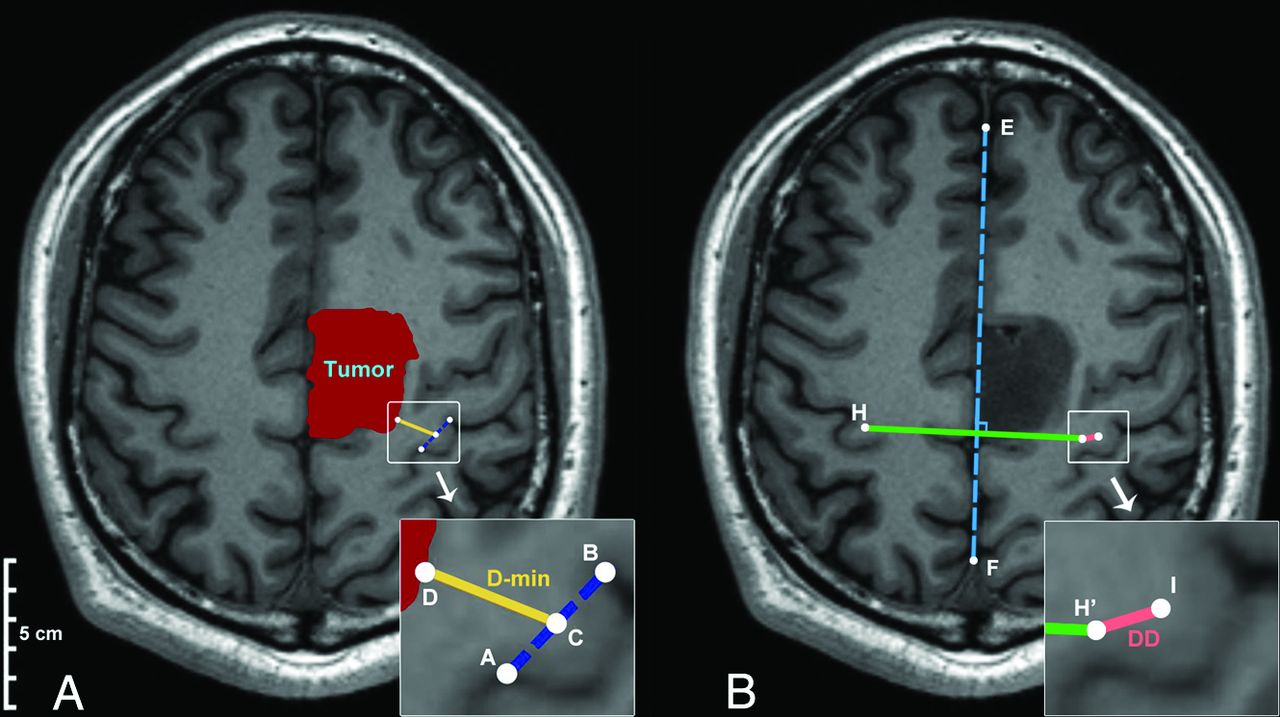
The mathematic model used to quantify the anatomic characteristics (the original magnification of the smaller pictures was ×200%). A, Representation of the calculation of D-min. Points A and B represent the ends of the hand knob. Point C represents the midpoint of the hand knob on the lesion hemisphere. Point D is a point on the tumor boundary that is closest to the Point C. D-min is shown as the gold line. B, The WAN model was used to calculate the DD. The dotted blue line indicates the midline of the brain. Points H and I are the midpoints of the hand knobs on the healthy and lesion hemispheres, respectively. Point H′ is the point that mirrors H on the basis of the midline of the brain (dotted blue line). The pink line represents the DD.
A mathematic model called WAN was generated to calculate the DD (Fig 1B). In the model, the coordinates of the midpoint in the healthy hemisphere (point H) and the midpoint in the lesioned hemisphere (point I) were calculated on the basis of both of their hand knob end point coordinates. The midline (blue dotted line) was calculated on the basis of points E and F, which were located on either side of the falx cerebri intersection. In addition, the midpoint (point H′) that mirrored point H was calculated on the basis of the line EF. Finally, the DD was calculated according to the coordinates of point H′ and point I (calculative details are in the On-line Appendix, Part 2).
DCS Results and Overlap Index Calculation
To characterize the region of positive stimulation by DCS, a global region of 5-mm diameter was defined on the basis of each positive site. This region was manually drawn by 2 neuroradiologists independently according to intraoperative photographs (Fig 2A). If their selections varied from each other by >5%, another neuroradiologist with 20 years of experience made the final decision regarding the region location.
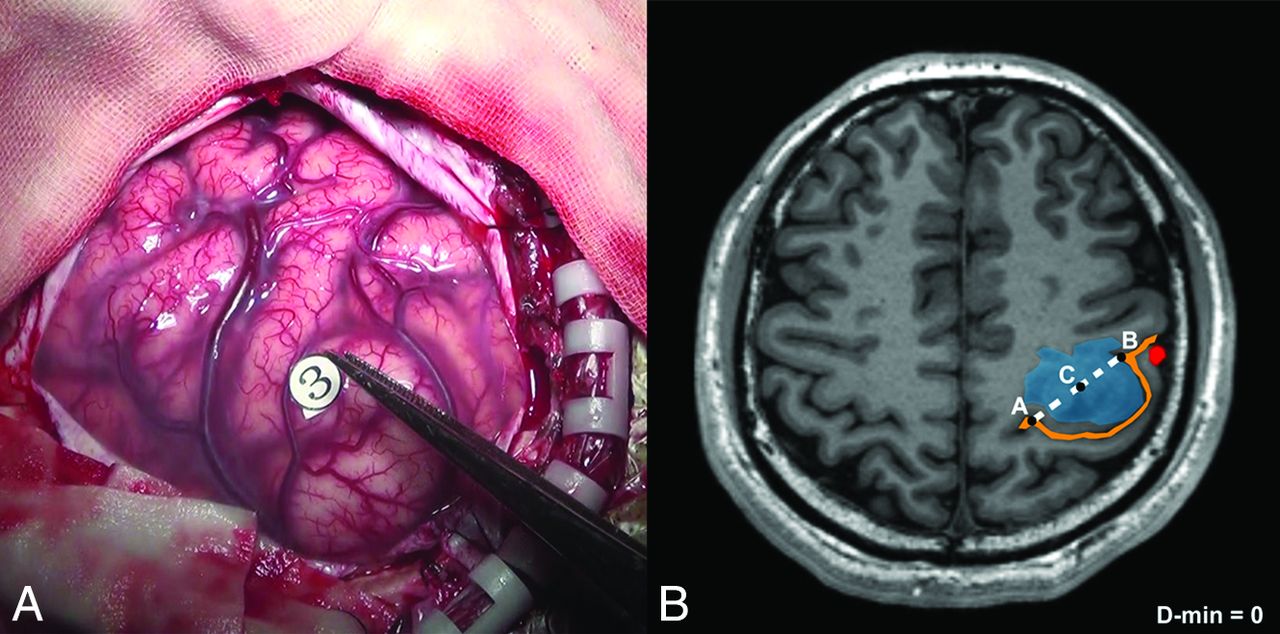
Example of the DCS-positive site and D-min (patient No. 9). A, The hand motor area is identified by intraoperative brain mapping. The marker 3 represents thumb buckling when stimulated in this region. B, Points A and B represent the ends of the hand knob. The midpoint of the hand knob (point C) in the lesion hemisphere is shown (midpoint of line AB). In this case, the shortest distance from the tumor to the hand knob is zero. The blue region is the tumor, the orange line is the central sulcus (with the Ω sign), and the red region is blood oxygen level—dependent functional MR imaging results.
The number of overlapping voxels between BOLD fMRI results and DCS regions was calculated via Matlab 2014a (MathWorks, Natick, Massachusetts). The overlap index was calculated via the formula (in this study, the total voxels of BOLD = 300):

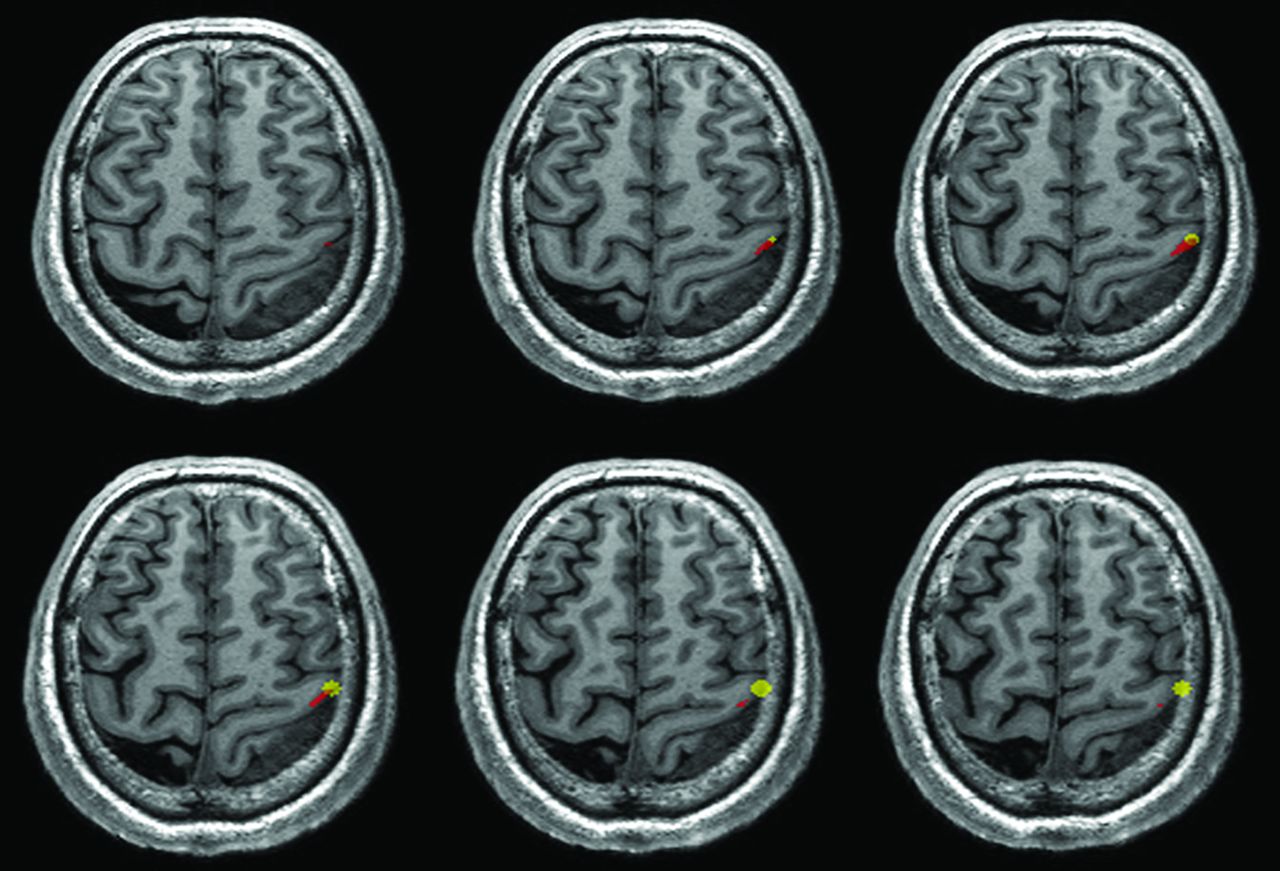
The nonoverlap phenomenon was defined as the overlap index equal to zero (Fig 3). In contrast, the overlap phenomenon was defined as the overlap index greater than zero (Fig 4).
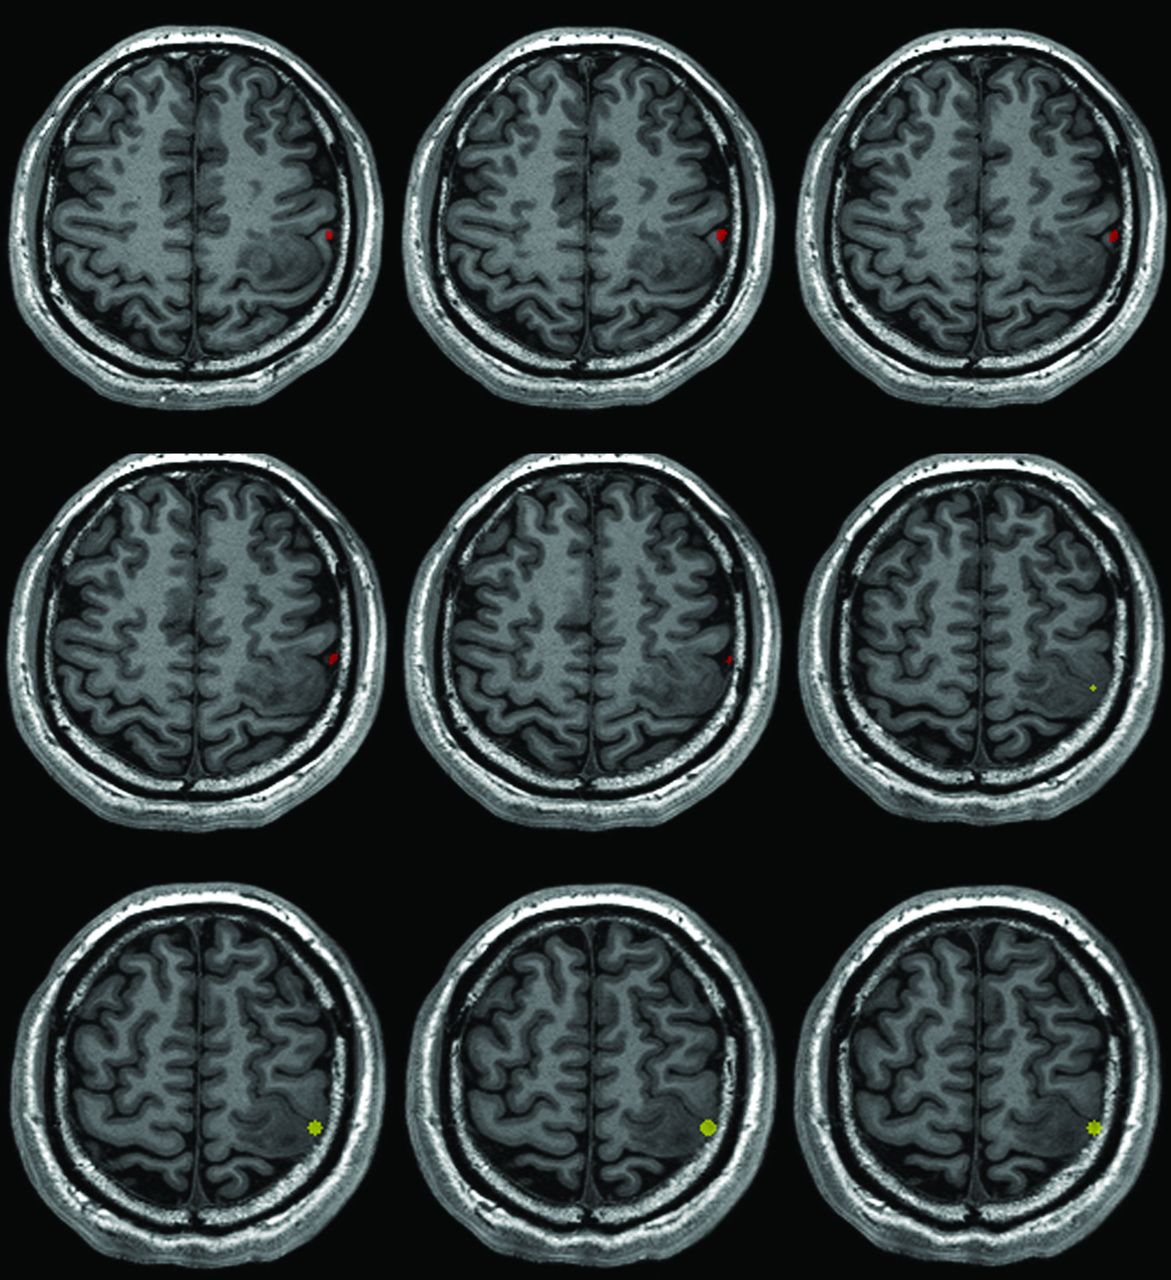
An example of the nonoverlapping phenomenon (patient No. 9). There was no region overlapping between the BOLD fMRI and DCS results. The red region is the BOLD fMRI results. The yellow region is the DCS results.

An example of the overlapping phenomenon (patient No. 16). There were some overlapping regions between the BOLD fMRI and DCS results. The red region is the BOLD fMRI results. The yellow region is the DCS results.
Statistical Analysis
A χ2 test was performed for the distribution of several attributes (including sex, age, lesion hemisphere, World Health Organization grade, and preoperative epilepsy history). A Student t test was used to analyze the differences in D-min and DD between the 2 patient groups. All results are presented as mean ± SD. The receiver operating characteristic curve was generated with GraphPad Prism 6.0c software (GraphPad Software, San Diego, California). The level of significance was .05 (2-tailed) for each statistical test.
Results
Patients
Thirty-five patients met our inclusion criteria (Table 1). Eighteen of them were older than 40 years of age. All were right-handed. Fourteen patients (40%) had a preoperative seizure history. Twenty-six (74.3%) had grade II gliomas, and the others had grade III gliomas. There were no statistical differences in general characteristics with respect to overlapping or nonoverlapping phenomena.
General characteristics for the patient group
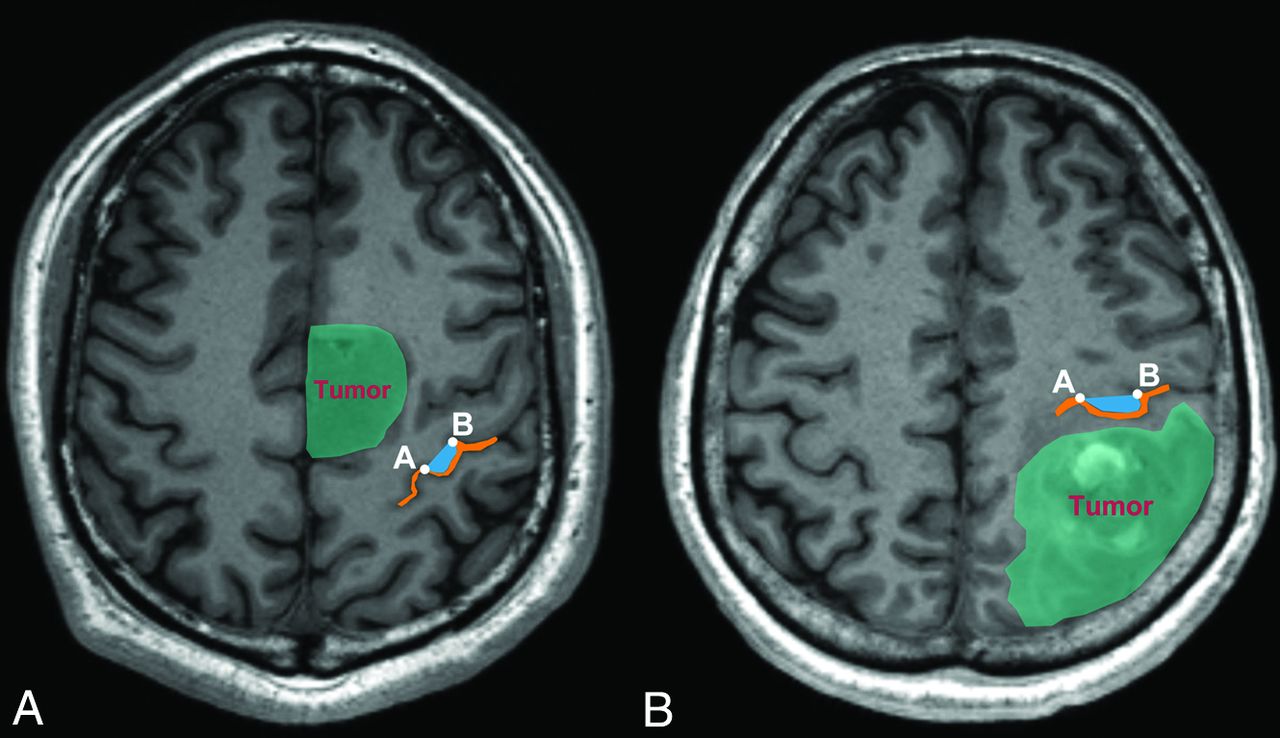
In terms of anatomic characteristics (Table 2), 20 gliomas were anterior to the hand knob and 15 gliomas were posterior to it (Fig 5). The mean tumor volume was 50.76 ± 25.12 mm3, the mean D-min was 7.50 ± 5.28 mm, and the mean DD was 9.38 ± 1.36 mm.
Anatomic characteristics of the patient group
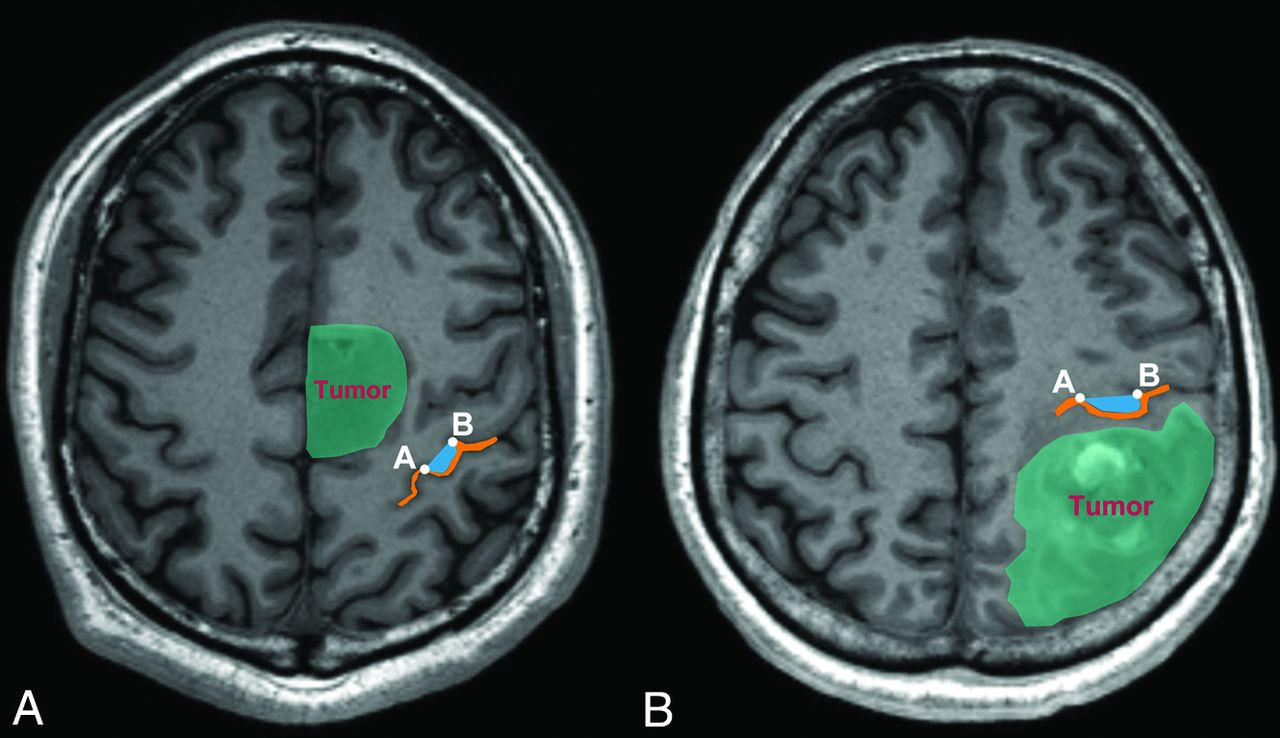
An example of tumor and hand knob locations. A, The tumor was anterior to the hand knob. B, The tumor was posterior to the hand knob. The orange line is the central sulcus, and the blue region is the hand knob. Points A and B represent both ends of the hand knob.
There were 16 subjects (1 women, 15 men) in the control group. Their mean age was 25.6 ± 1.0 years, and only 2 patients were right-handed.
Association between D-min and Motor Area Localization
The mean D-min for the nonoverlapping group was smaller than that for the overlapping group (3.02 ± 0.88 mm versus 9.07 ± 1.01 mm, respectively; P = .002, t test; Fig 6A). The receiver operating characteristic curve analysis indicated that 4 mm was the optimal cutoff value (84.6% sensitivity; 77.8% specificity; area under the curve, 0.844) to predict nonoverlapping phenomena (Fig 6B).

The relationship between D-min and the nonoverlapping phenomena of BOLD fMRI and a comparison with DCS results. A, The boxplot shows that D-min is significantly different between the overlapping and nonoverlapping groups (t test). The middle line in each box is the mean value; the horizontal boundaries of the boxes are the first and third quartiles. The topmost line is the maximum value, and the bottommost line is the minimum value. B, Receiver operating characteristic curves are used to assess whether the BOLD fMRI and DCS results overlap. The results for sensitivity are plotted against 1-specificity to compare BOLD fMRI versus DCS. The gray line is the reference line. The red point represents the optimal point for which the best cutoff value was 4 mm, with a sensitivity of 84.6% and a specificity of 77.8%. AUC indicates area under the curve.
Overlap Index between BOLD fMRI and DCS Results
In group A, a significant difference in the overlap index was identified between the D-min ≤4-mm group and the D-min >4-mm group (17.2% ± 7.5% versus 59.1% ± 10.5%, respectively; P = .005, On-line Fig 2B). Conversely, no difference was found between the D-min ≤4-mm group and the D-min >4-mm group in group P (33.5% ± 22.5% versus 56.6% ± 9.4%, respectively; P = .275, On-line Fig 2C).
Hand Knob Deviation and Nonoverlapping Phenomena
In the WAN model, we evaluated the symmetry of the bilateral hand knob in patient and control groups by measuring the DD. The DD of the patient group was significantly larger than that of the control group (9.38 ± 1.36 mm versus 4.16 ± 0.74 mm; P = .015, t test; On-line Fig 3).
The DD for the patient group was larger in the nonoverlapping group than in the overlapping group (17.59 ± 4.00 mm versus 7.06 ± 0.71 mm, respectively; P = .003, t test; On-line Fig 4A). In group A, a statistical difference in DD was found between the overlapping group and the nonoverlapping group (nonoverlapping group, 20.88 ± 5.45 mm; overlapping group, 6.30 ± 0.90 mm; P = .001, t test; On-line Fig 4B), whereas no significant difference existed in group P (overlapping group, 7.95 ± 1.12 mm; nonoverlapping group, 10.99 ± 3.21 mm, respectively; P = .280, t test; On-line Fig 4).
Discussion
Identifying the hand motor cortex accurately is crucial when planning surgery for gliomas involving the functional motor cortex. At present, BOLD fMRI is the prevalent noninvasive preoperative method used to localize the motor cortex. However, the accuracy of BOLD fMRI remains contested. Previous studies have concluded that unreliable BOLD fMRI results are associated with neurovascular uncoupling, particular tumor locations, tumor grades, cooperation of patients, task selection, and functional reorganization.9,27⇓⇓–30 Although the BOLD fMRI signals are affected by tumor locations,21,24 the impact of tumor location on BOLD fMRI accuracy has not been quantified. Thus, in our study, we investigated how tumor location affected BOLD fMRI accuracy via some locational characteristics such as D-min and DD.
On the basis of the regression model, the calculated voxel values were positively related to the degree of activation. A previous study31 considered the top 2% of the highly activated voxels as the functional area. Similarly, we allowed a maximum of 300 voxels from the BOLD fMRI results, to exclude a large number of irrelevant voxels.
BOLD fMRI takes advantage of variations in blood hemoglobin levels to identify the relevant functional cortex.32 The mechanism relies on neurovascular coupling. When neurons are activated, the oxygen-hemoglobin level increases rapidly and remains high until activation ceases in relevant areas. Coincidentally, the oxygen-hemoglobin exhibits a type of diamagnetism that acts as an endogenous contrast medium, thus revealing relevant activated areas.33
Due to limitations of BOLD fMRI,34 false-negative results may appear in the presence of neurovascular uncoupling. Thus, the actual functional area may not be displayed completely, and the BOLD fMRI results may be unreliable.28,35,36 Alterations in hemodynamics and the microenvironment are the primary reasons.21,33,37 First, gliomas impair cerebral vascular reactions and reduce CBV and CBF.21,34 This process raises the level of deoxygenated hemoglobin that is paramagnetic and reduces BOLD signals.22 Second, gliomas change the microenvironment of surrounding tissues.33,38 Abnormal astrocyte proliferation decreases potassium reabsorption, which reduces the oxygen supply and elevates deoxygenated hemoglobin levels.39 Previous studies illustrated that gliomas induce neurovascular uncoupling.35,36 Furthermore, the higher-grade gliomas are associated with a greater probability of neurovascular uncoupling.15,17,21,22 Our results demonstrated that if D-min were ≤4 mm, nonoverlapping phenomena occurred more frequently than when D-min was >4 mm. We speculate that this outcome is due to neurovascular uncoupling. A previous study verified that gliomas caused a decline in BOLD fMRI activation by neurovascular uncoupling when the glioma was near the primary motor cortex.40 Our results were consistent with this theory to some extent. However, another study suggested that the distance between the tumor and primary motor cortex was no more likely than tumor type in influencing BOLD fMRI activation.41 This finding may be because all patients in that study had glioblastomas rather than lower-grade gliomas. On the basis of previous studies,15,17,21,22 we believe that the degree of neurovascular uncoupling in our patients was not greater than that in patients with glioblastomas. Hence, we believe that D-min significantly affects BOLD fMRI accuracy in lower-grade gliomas.
Distortion and movement of hand knobs may decrease the accuracy of BOLD fMRI results. Hand knobs will be moved and become distorted when gliomas grow and invade surrounding structures.3⇓–5 By comparing DD, we found that hand knobs moved more obviously in the patient group than in the control group. Hand knob distortion decreased the number of true-positive voxels in relevant regions. However, the number of positive voxels stimulated by DCS was unchanged.26 Hence, the overlap indexes decreased. This result could explain the significant difference in overlap between the group with a D-min of <4 mm and the group with a D-min of >4 mm. This finding may also explain the larger DD in the nonoverlapping group than in the overlapping group. Hence, we believe that distortion and movement of hand knobs may decrease the accuracy of BOLD fMRI results.
We found that the accuracy of BOLD fMRI results was associated with glioma location. The structure of the primary motor cortex is unique. The cingulate sulcus and the central sulcus constitute an obstruction that divides the precentral and posterior central gyri completely.25 A prior study showed that the pre- and postcentral sulci were only linked by the paracentral lobule, which was responsible for foot movement.42 Because of its special structure, it is easier for gliomas to invade the precentral gyrus from anterior areas. In contrast, it is difficult for gliomas that grow on the posterior central gyrus to invade the precentral gyrus directly. Hence, we hypothesized that gliomas that grow anterior to the central sulcus compared with those growing posterior to it would influence the BOLD fMRI accuracy more. To test our theory, we divided patients into group A or P. We found significant differences in both D-min and DD in group A, but not in group P. This finding corresponded with our hypothesis. Thus, we concluded that anterior gliomas influenced the BOLD fMRI accuracy more obviously than posterior gliomas. The limited number of samples in our study made it difficult to verify this finding. In the future, we will recruit more patients to verify our hypothesis.
Besides neurovascular uncoupling and tumor locations, there are other factors that may cause the inaccuracy of BOLD fMRI mapping, including task selection, the cooperation of patients, and cognitive status.12,33 Grasping is one of the traditional tasks used to identify the motor cortex and has been used in many previous studies.16,43,44 Poor cooperation and impaired cognitive status of the patient could reduce the quality of BOLD fMRI.33,45 To reduce the above influences, we enrolled patients without preoperative paralysis, and each patient was trained to achieve good performance in hand grasping before the BOLD fMRI scans.
Conclusions
This study suggests that D-min and DD are predictive of the accuracy of BOLD fMRI results. A smaller D-min and larger DD are associated with less accuracy of motor area localization with BOLD fMRI. One should be cautious in the use of preoperative fMRI data for surgical planning when D-min is smaller than 4 mm, especially for a lower-grade glioma located anterior to the central sulcus.
Acknowledgments
We thank Stefan Huwer from Siemens for support with image collection.
Footnotes
S. Fang, J. Liang, and T. Qian contributed equally to this article.
Disclosures: Tianyi Qian—UNRELATED: Employment: Siemens.
This study was supported by funds from the National High Technology Research and Development Program of China (863 program) (2015AA020504), the National Basic Research Program of China (No. 2015CB755500), and the National Natural Science Foundation of China (No. 81601452).
Indicates open access to non-subscribers at www.ajnr.org
References
- 1.
- 2.
- 3.
- 4.
- 5.
- 6.
- 7.
- 8.
- 9.
- 10.
- 11.
- 12.
- 13.
- 14.
- 15.
- 16.
- 17.
- 18.
- 19.
- 20.
- 21.
- 22.
- 23.
- 24.
- 25.
- 26.
- 27.
- 28.
- 29.
- 30.
- 31.
- 32.
- 33.
- 34.
- 35.
- 36.
- 37.
- 38.
- 39.
- 40.
- 41.
- 42.
- 43.
- 44.
- 45.
- Received March 13, 2017.
- Accepted after revision June 4, 2017.
- © 2017 by American Journal of Neuroradiology