
Abstract
BACKGROUND AND PURPOSE: Proton MR spectroscopy of the brain allows noninvasive in vivo assessment of metabolites, which may be useful in understanding the biology of malformations of cortical development. The aim of this study was to determine the MR spectroscopic characteristics of polymicrogyria and heterotopia compared with those of normal frontal lobe white matter.
METHODS: We recruited 22 patients with radiographic findings characteristic of polymicrogyria, nine patients with radiographic findings characteristic of heterotopia, and 10 control subjects into the study. The MR imaging technique consisted of high-spatial-resolution axial dual-echo and gradient-echo 3D volume imaging. A single-voxel point-resolved technique (1600/135 [TR/TE]) was used to acquire spectra from the region of neocortical malformation and from frontal lobe white matter in control subjects. The differences in N-acetyl moieties (NA)/creatine (Cr), NA/choline (Cho), and Cho/Cr ratios among patients with heterotopia, those with polymicrogyria, and control subjects were compared by using the Kruskal-Wallis test followed by the Mann-Whitney U (Wilcoxon) test.
RESULTS: No statistically significant differences were noted in the NA/Cr, NA/Cho, and Cho/Cr ratios between the polymicrogyria group and controls, the heterotopia group and controls, or the polymicrogyria and heterotopia groups.
CONCLUSION: Both heterotopia and polymicrogyria are malformations of cortical development that occur at a relatively late stage of brain development. The neurons and glia in these lesions are mature, and the metabolites appear to be similar to those of normal adult frontal white matter.
MR imaging has had a profound effect on the detection and classification of disorders of neocortical formation and has contributed to a coherent classification system of those malformations (1, 2). Disorders of neocortical malformations can be characterized by the stage at which cortical development was first perturbed (2). The three categories are malformations due to abnormal neuronal and glial proliferation (such as microlissencephaly), malformations due to abnormal migration (such as heterotopia), and malformations due to abnormal cortical organization (such as polymicrogyria).
Proton MR spectroscopy allows noninvasive in vivo assessment of certain metabolites in the brain. In proton MR spectroscopy of normal brain, three prominent resonances representing the N-acetyl groups (NA), choline (Cho), and creatine (Cr) can be resolved. In a previous study, we showed that MR spectroscopic abnormalities occur in cortical tubers found in tuberous sclerosis complex (3). In this study, we used proton MR spectroscopy to investigate two disorders of neocortical malformations, heterotopia and polymicrogyria, which form at a later stage of cortical development than do cortical tubers. Our aim was to determine if there is any significant difference between the spectra from these two groups of patients compared with spectra from control subjects.
Methods
During a 3-year period, we consecutively studied all patients with newly diagnosed polymicrogyria or heterotopia from both our adult and pediatric MR facilities. These cases consisted of 22 patients with polymicrogyria and nine with heterotopia. All patients successfully underwent MR imaging and MR spectroscopy, and the same MR spectroscopic protocol was performed in 10 young to middle-aged adults for comparison. The demographic data of the 41 participants are given in Table 1. The main indications for imaging in both patient groups were seizures, developmental delay, and learning difficulties.
Demographic data of the control subjects and patients
All MR data were acquired at 1.5 T (Eclipse/Infinion; Philips Medical Systems, Cleveland, OH). Standard proton-density- and T2-weighted images were acquired by using an axial dual-echo technique (8040/15, 75 [TR/TE]; section thickness, 2.5 mm; field of view, 23 cm; matrix size, 256 × 256). Whole-head, high-spatial-resolution anatomic images were acquired by using a 3D radio-frequency spoiled gradient-echo technique (15/4.4; flip angle, 25°; voxel size, 0.8 × 0.8 × 0.8 mm). The images were reviewed by two neuroradiologists (P.D.G., E.W.).
All patients and control subjects underwent MR spectroscopy after MR imaging. A point-resolved spectroscopic technique (1600/135; averages, 256) was used to acquire data from a single 2 × 2 × 2-cm3 voxel. In patients with polymicrogyria, the voxel was placed over abnormal gray matter and in the subjacent white matter, whereas in those with heterotopia, the voxel was placed in the region of heterotopia, carefully avoiding the skull and CSF spaces in all cases. White matter from the right frontal lobe was sampled for MR spectroscopic analysis in the control subjects.
The spectroscopic data were analyzed by an MR physicist with considerable experience in proton spectroscopy (I.D.W.). After spectroscopic data acquisition, a Lorentzian-Gaussian function was fitted to the three prominent peaks representing Cho at 3.2 ppm, Cr at 3.0 ppm, and NA at 2.0 ppm. Spectroscopic results are expressed as the ratios of the areas under those three resonances: Cho/Cr, NA/Cr, and NA/Cho. The differences in NA/Cr, NA/Cho, and Cho/Cr ratios among the heterotopia, polymicrogyria, and control groups were compared by using a nonparametric analysis of variance (Kruskal Wallis) followed by a paired post hoc Mann-Whitney U (Wilcoxon) test.
Results
MR imaging showed that in the nine patients with gray matter heterotopia, six had subependymal heterotopia, two had subcortical heterotopia, and one had band heterotopia. In the 22 patients with polymicrogyria, the distribution was frontal lobe in 12, parietal lobe in four, temporal lobe in four, and occipital lobe in two. At proton MR spectroscopy in the 10 control subjects, all had normal structural examinations and metabolite ratios that were comparable to those reported in the literature when similar methods were used (Table 2). Areas of polymicrogyria showed no statistically significant difference in NA/Cr (P > .05), NA/Cho (P > .05), and Cho/Cr (P > .05) ratios compared with those ratios from frontal lobe white matter of the control group. Similarly, regions of heterotopia also did not demonstrate any statistically significant difference in NA/Cr (P > .05), NA/Cho (P > .05), and Cho/Cr (P > .05) ratios compared with control data. Also, no difference was noted in the NA/Cr (P > .05), NA/Cho (P > .05), and Cho/Cr (P > .05) ratios between the heterotopia and polymicrogyria groups. Lactate, signified as an inverted doublet centered at 1.3 ppm, was not detected in any areas of heterotopia or polymicrogyria. Figures 1–3 show a typical spectrum from a control subject and spectra from an area of polymicrogyria and an area of heterotopia.

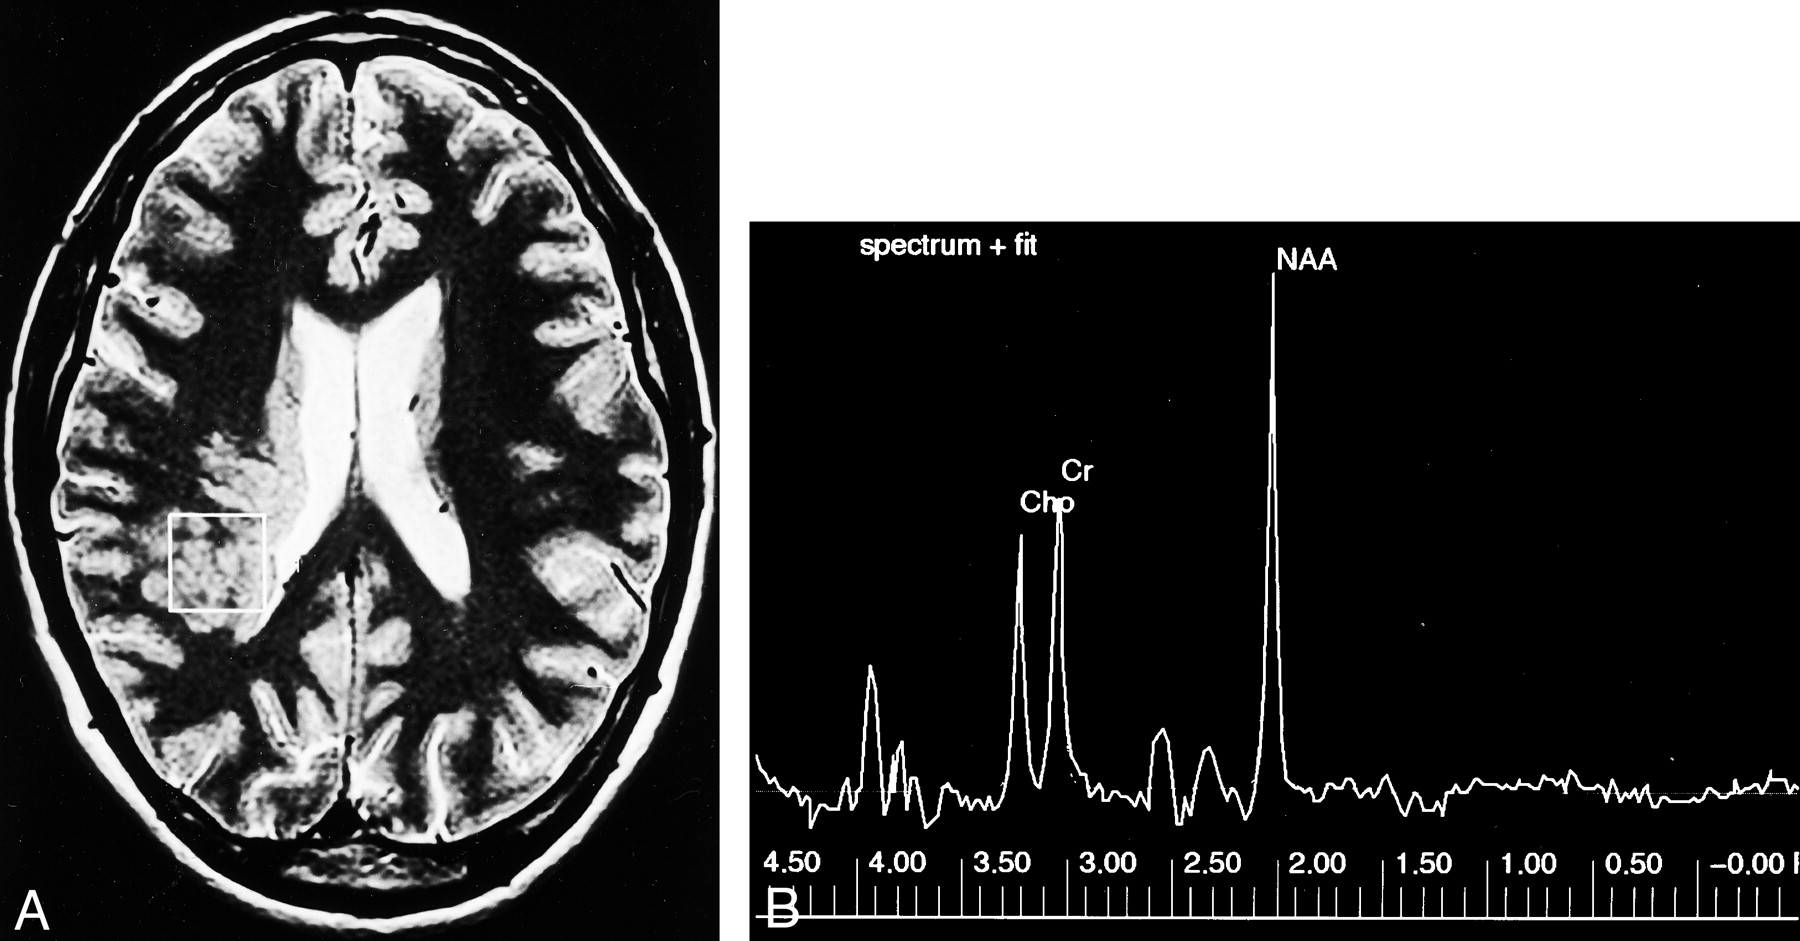
Control case.
A, Axial T2-weighted MR image shows the single 2 × 2 × 2-cm voxel (box) localized in frontal lobe white matter from which the proton spectrum was acquired.
B, MR spectrum shows that the Cho and Cr peaks are roughly equal in height, and the N-acetylaspartate (NAA) peak is approximately 1.6 times the height of the Cr peak.

Subcortical heterotopia.
A, Axial T2-weighted MR image shows the sampled region of interest (box) over the area of subcortical heterotopia.
B, MR spectrum shows that the NAA, Cho, and Cr peaks are similar to that of the control case in Figure 1.

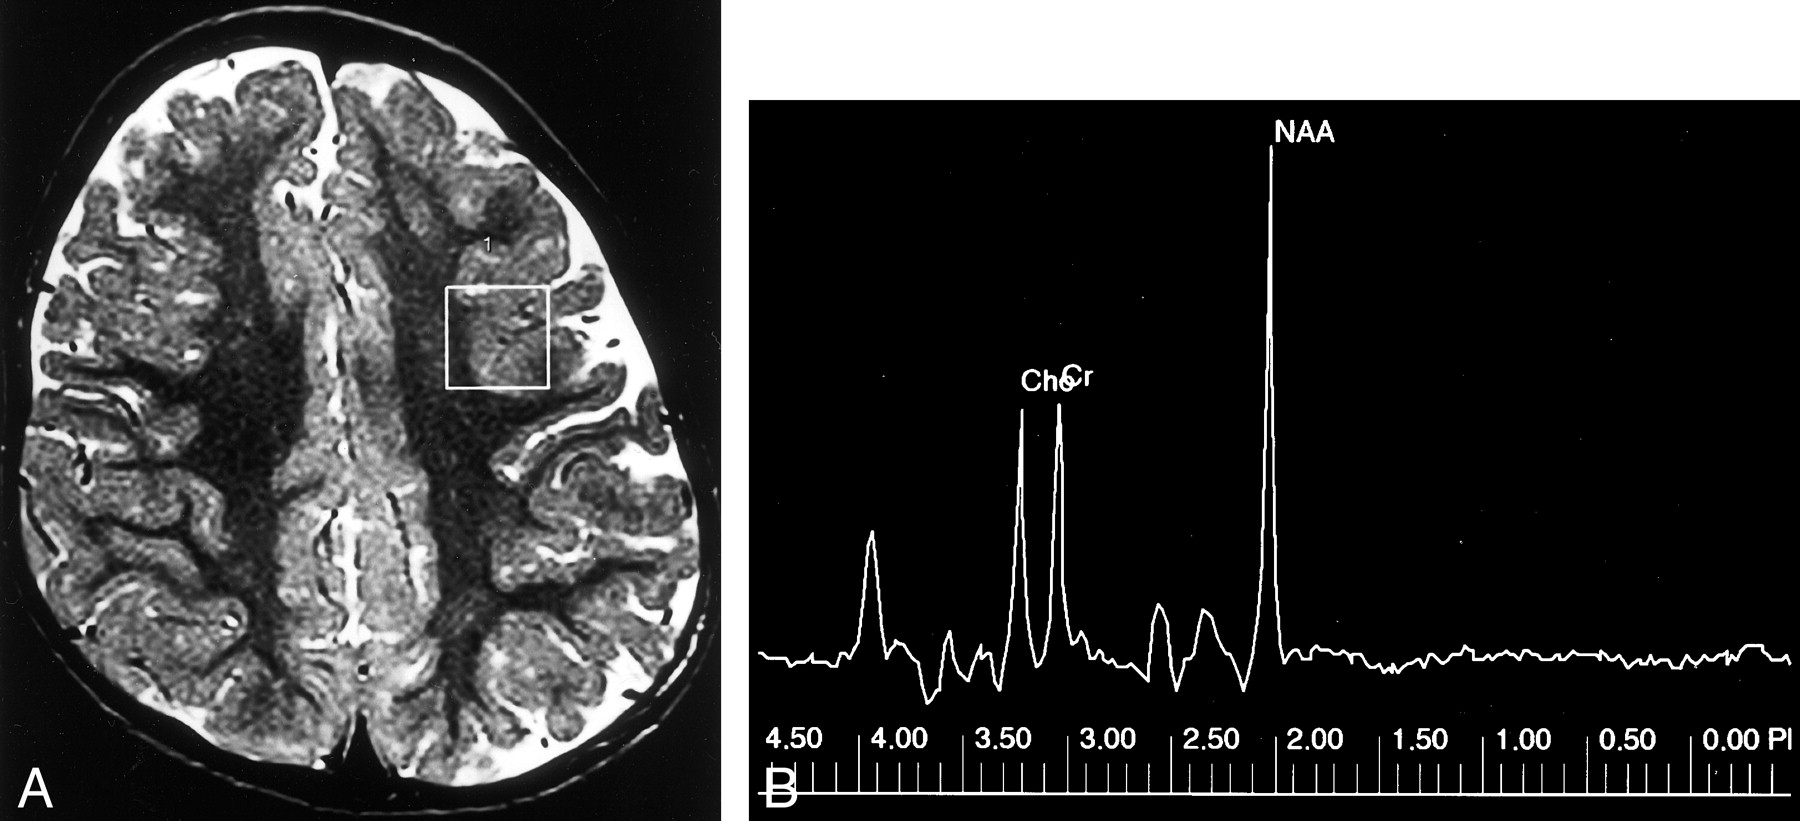
Polymicrogyria.
A, Axial T2-weighted MR image shows a region of interest (box) for spectroscopic analysis centered over the area of polymicrogyria in the left frontal lobe.
B, MR spectrum of this lesion shows that the NAA peak is similar to that of normal brain.
Results of proton MR spectroscopy in the three groups
Discussion
MR spectroscopy is a powerful adjunct to MR imaging because of its ability to probe the biochemical environment of the brain. The NA groups (particularly N-acetylaspartate) are largely confined to neurons and neuronal processes and reflect the quantity and function of the bodies, axons, dendrites, and synapses of neurons (4, 5). NA is therefore generally considered a marker for neuronal disease, and NA is usually reduced in abnormalities that damage neurons such as ischemic stroke or tumors (6, 7). Cr concentration reflects cell metabolic status (8, 9), and Cr is more concentrated in glia than in neurons. Cr levels remain relatively unchanged in a wide range of pathologic conditions. It is therefore often used as a putative internal reference against which the other metabolites are compared (10). Cho is a component of phosphoglyceride and is therefore a major component of cell membranes. Cho concentration provides information primarily about membrane turnover (11), the degree of myelination (8), and cell density (12). The signal from Cho detected at MR spectroscopy therefore increases in conditions associated with increased cell membrane turnover such as tumors (10, 13). Lactate is not shown normally but may be found where anaerobic respiration is present, such as in tumors or areas of acute vascular ischemia or infarction (7).
Gray matter heterotopia is a collection of neurons and glia in abnormal locations secondary to arrest of migration of neurons. Histologic study shows normal-appearing neurons and evidence of active synapses (14). At fluorodeoxyglucose positron emission tomographic study, gray matter heterotopia demonstrates glucose uptake similar to that of normal cortex (15). One previous study of large areas of heterotopia with use of proton MR spectroscopy showed a relative increase in NA levels (16). In other studies, however, NA levels were found to be variable in the heterotopia, either normal or reduced. Kuzniecky et al (17) did not find any significant difference in NA/Cr ratio between heterotopia and normal brain in three of their patients. Kaminaga et al (18) measured the NA level quantitatively in three patients and found that the NA level in heterotopia was reduced. Li et al (19) and Simone et al (20) in their studies of 12 and eight patients, respectively, also found that heterotopia showed reduced NA/Cr ratio compared with that of normal brain. The variability in NA level reported in the literature may be explained by the fact that heterotopia consists of neurons at different stages of maturation, some being less mature and improperly connected, and therefore possibly expressing less NA (21). In our study, we found no significant difference in NA/Cr ratios in areas with gray matter heterotopia compared with this ratio in the control subjects. We used single-voxel MR spectroscopy, which relies on sampling a relatively large parenchymal volume. The sensitivity of the test may be limited by any partial voluming between targeted and adjacent tissue types. If the sampled voxel contained more than one type of heterotopia (subependymal, subcortical, or band heterotopia) and if there are spectroscopic discrepancies between these abnormalities, partial voluming may also result in increased variance in the heterotopia group.
In our previous work in which we performed MR spectroscopy in adults with tuberous sclerosis complex (3), we showed a significant reduction in NA/Cr ratios in cortical tubers compared with that of control subjects. Reduced NA in cortical tubers may arise from several causes, one of which is reduced expression of NA in embryologically immature structures. Cortical tubers are thought to result from a generalized abnormality of neuronal proliferation, which occurs earlier than neuronal migration and organization.
Polymicrogyria is a malformation due to abnormal late neuronal migration and cortical organization (1). Polymicrogyria has a range of histologic appearances, all having in common a derangement of the normal six-layered lamination of the cortex (2). At imaging, polymicrogyria appears as an area of thickened cortex with a wavy and indistinct gray-white matter interface and often with abnormal subjacent white matter (2). Quantitative glial and neuronal cell counts revealed no statistically significant differences between patients with polymicrogyria and control subjects (17). The timing of the insult in polymicrogyria is postmigrational, and the neurons are thought to be mature, with normal cellular structure and presence of synaptic integrity.
Previous reports of up to three cases indicate no significant difference in the NA/Cr ratio in areas with polymicrogyria compared with that of normal brain (17, 19). Simone et al (20) reported reduced NA/Cr and NA/Cho ratios in areas with polymicrogyria. It could be that the neurons in areas of polymicrogyria are not as functionally competent as those of normal brain and therefore do not express NA as efficiently. Our study of 22 patients with polymicrogyria showed no significant reduction in the NA/Cr ratio in polymicrogyria compared with that of normal brain. We used a relatively large voxel size of 2 × 2 × 2 cm3 in our study, which may have resulted in the inclusion of “normal” adjacent brain. However, “normal”-appearing brain adjacent or contralateral to malformations of cortical development has been shown to contain abnormal metabolites (19, 20). The mean age of the subgroup of patients with polymicrogyria in our study was 16 years. In the study by Simone et al (20), the mean age of the five patients with polymicrogyria was 32 years. Metabolite levels change with normal growth and development. The variations are most marked in the first 3 years of life, but are still present up to age 16 years and consist mainly of an increase in NA/Cr and a decrease in Cho/Cr levels with age (17, 22, 23). The difference in the mean ages of the study populations may possibly account for the difference in the results.
Metabolite levels and ratios vary significantly in different regions of the brain (24). Variations in metabolite concentrations between the different regions are probably related to differences in myelination pattern (22). In our study, we sampled different regions of the brain in the heterotopia and polymicrogyria groups, depending on the location of the abnormality. In the control group, we sampled the frontal lobe white matter. This may have a confounding influence on technique sensitivity. However, approximately half of the areas of polymicrogyria and heterotopia in our study patients were located in the frontal lobe.
The other potential confounding factor in our study is that we sampled white matter in the control group and abnormal gray matter in the polymicrogyria and heterotopia groups. Whether metabolite levels are different in gray and white matter is unclear (25). NA is largely confined to neurons. In white matter, the NA signal arises from within the axons, and since the axonal component does not constitute a large fraction of the white matter space (26), cerebral gray matter should perhaps produce a stronger NA signal than that of white matter. However, Tedeschi et al (24) and Hetherington et al (25) found higher levels of NA in white matter than in gray matter, after correction for T1 and T2 effects. The reason for this is unclear. In contrast, Simone et al (20) found no significant difference in NA/Cr, NA/Cho, or Cho/Cr between gray and white matter of normal brain.
Conclusion
In this study, we found no statistically significant differences in the NA/Cr, NA/Cho, and Cho/Cr ratios in areas of polymicrogyria and gray matter heterotopia compared with those ratios in normal frontal lobe white matter. Heterotopia is due to abnormality of migration, whereas polymicrogyria is due to failure of cortical organization. These two groups of malformations of cortical development occur at a later stage of cortical development, and the neurons in these lesions are mature. Although there are more neurons in heterotopia, the neurons are dysfunctional, which may explain the reduced NA relative to the number of neurons.
Acknowledgments
The authors would like to acknowledge all of the neuroradiologists, neurologists, and neurosurgeons who assisted in supplying radiologic and clinical information for the patients reported on in this article. We are also grateful to the MR radiographers from the University of Sheffield and would also like to thank Dr. J. Murdoch, research scientist (Philips Medical Systems), for his help with setting up the spectroscopy service.
References
- Received February 24, 2003.
- Accepted after revision June 11, 2003.
- Copyright © American Society of Neuroradiology


