Advertisement

Main menu

  • Home
  • Content
    • Current Issue
    • Accepted Manuscripts
    • Article Preview
    • Past Issue Archive
    • Video Articles
    • AJNR Case Collection
    • Case of the Week Archive
    • Case of the Month Archive
    • Classic Case Archive
  • Special Collections
    • AJNR Awards
    • Low-Field MRI
    • Alzheimer Disease
    • ASNR Foundation Special Collection
    • Photon-Counting CT
    • View All
  • Multimedia
    • AJNR Podcasts
    • AJNR SCANtastic
    • Trainee Corner
    • MRI Safety Corner
    • Imaging Protocols
  • For Authors
    • Submit a Manuscript
    • Submit a Video Article
    • Submit an eLetter to the Editor/Response
    • Manuscript Submission Guidelines
    • Statistical Tips
    • Fast Publishing of Accepted Manuscripts
    • Graphical Abstract Preparation
    • Imaging Protocol Submission
    • Author Policies
  • About Us
    • About AJNR
    • Editorial Board
    • Editorial Board Alumni
  • More
    • Become a Reviewer/Academy of Reviewers
    • Subscribers
    • Permissions
    • Alerts
    • Feedback
    • Advertisers
    • ASNR Home

User menu

  • Alerts
  • Log in

Search

  • Advanced search
American Journal of Neuroradiology

American Journal of Neuroradiology

ASHNR American Society of Functional Neuroradiology ASHNR American Society of Pediatric Neuroradiology ASSR
  • Alerts
  • Log in

Advanced Search

  • Home
  • Content
    • Current Issue
    • Accepted Manuscripts
    • Article Preview
    • Past Issue Archive
    • Video Articles
    • AJNR Case Collection
    • Case of the Week Archive
    • Case of the Month Archive
    • Classic Case Archive
  • Special Collections
    • AJNR Awards
    • Low-Field MRI
    • Alzheimer Disease
    • ASNR Foundation Special Collection
    • Photon-Counting CT
    • View All
  • Multimedia
    • AJNR Podcasts
    • AJNR SCANtastic
    • Trainee Corner
    • MRI Safety Corner
    • Imaging Protocols
  • For Authors
    • Submit a Manuscript
    • Submit a Video Article
    • Submit an eLetter to the Editor/Response
    • Manuscript Submission Guidelines
    • Statistical Tips
    • Fast Publishing of Accepted Manuscripts
    • Graphical Abstract Preparation
    • Imaging Protocol Submission
    • Author Policies
  • About Us
    • About AJNR
    • Editorial Board
    • Editorial Board Alumni
  • More
    • Become a Reviewer/Academy of Reviewers
    • Subscribers
    • Permissions
    • Alerts
    • Feedback
    • Advertisers
    • ASNR Home
  • Follow AJNR on Twitter
  • Visit AJNR on Facebook
  • Follow AJNR on Instagram
  • Join AJNR on LinkedIn
  • RSS Feeds

AJNR Awards, New Junior Editors, and more. Read the latest AJNR updates

Research ArticleHead and Neck Imaging

MR Imaging of the Enlarged Endolymphatic Duct and Sac Syndrome by Use of a 3D Fast Asymmetric Spin-echo Sequence: Volume and Signal-intensity Measurement of the Endolymphatic Duct and Sac and Area Measurement of the Cochlear Modiolus

Shinji Naganawa, Tokiko Koshikawa, Eriko Iwayama, Hiroshi Fukatsu, Tsuneo Ishiguchi, Takeo Ishigaki, Mitsuru Ikeda, Tsutomu Nakashima and Nobuyasu Ichinose
American Journal of Neuroradiology October 2000, 21 (9) 1664-1669;
Shinji Naganawa
  • Find this author on Google Scholar
  • Find this author on PubMed
  • Search for this author on this site
Tokiko Koshikawa
  • Find this author on Google Scholar
  • Find this author on PubMed
  • Search for this author on this site
Eriko Iwayama
  • Find this author on Google Scholar
  • Find this author on PubMed
  • Search for this author on this site
Hiroshi Fukatsu
  • Find this author on Google Scholar
  • Find this author on PubMed
  • Search for this author on this site
Tsuneo Ishiguchi
  • Find this author on Google Scholar
  • Find this author on PubMed
  • Search for this author on this site
Takeo Ishigaki
  • Find this author on Google Scholar
  • Find this author on PubMed
  • Search for this author on this site
Mitsuru Ikeda
  • Find this author on Google Scholar
  • Find this author on PubMed
  • Search for this author on this site
Tsutomu Nakashima
  • Find this author on Google Scholar
  • Find this author on PubMed
  • Search for this author on this site
Nobuyasu Ichinose
  • Find this author on Google Scholar
  • Find this author on PubMed
  • Search for this author on this site
  • Article
  • Figures & Data
  • Info & Metrics
  • Responses
  • References
  • PDF
Loading

Abstract

BACKGROUND AND PURPOSE: In enlarged endolymphatic duct (EED) and sac (EES) syndrome, deformity of the EED and EES is congenital; however, hearing loss is acquired. To investigate the pathophysiology of progressive sensorineural hearing loss in EED and EES syndrome, we measured the volume of the EED and EES, the diameter of the EED and EES, the area of the cochlear modiolus, and the signal intensity of the EES and compared our findings against degree of hearing loss.

METHODS: Thin-section MR images of 33 ears in 17 patients with EED and EES syndrome were studied. All studies were obtained on a 1.5-T MR unit using a quadrature surface phased-array coil. Heavily T2-weighted 3D fast asymmetric spin-echo images were obtained with a voxel size of 0.3 × 0.3 × 0.8 mm without zero-fill interpolation. Two radiologists traced the areas of the EED and EES manually, and the volume was calculated. The area of the cochlear modiolus, diameter of the EED and EES, and signal intensity of the EES were also measured by drawing regions of interest manually. The signal intensity ratio of EES/CSF was calculated. These measured values were compared against audiographic data, and the degree of linear correlation was determined.

RESULTS: The volume of the EED and EES, the area of the modiolus, the diameter of the EED and EES, and the signal intensity of the EES did not show significant correlation with degree of hearing loss.

CONCLUSION: These findings suggest that there is a microscopic area of damage or fragility in the inner ear not visible even with thin-section heavily T2-weighted MR imaging.

Large vestibular aqueduct syndrome, or enlarged endolymphatic duct (EED) and sac (EES) syndrome, is an inner ear malformation that manifests as progressive sensorineural hearing loss starting in infancy or childhood (1–3). The deformity of the EED and EES is congenital (4); however, hearing loss in this syndrome is acquired (4, 5). A distinct feature is that hearing loss in EED and EES syndrome is triggered by minor head trauma (3). Although the true pathogenesis of the hearing loss in this syndrome is still unknown, several theories as to its pathophysiology have been proposed (5–11). In one recent CT study (9), all ears with a large vestibular aqueduct had associated cochlear modiolar deficiencies. On the basis of this finding, the authors suggested the theory that progressive hearing loss in the presence of a large vestibular aqueduct is caused by the transmission of subarachnoid pressure forces in the internal auditory canal into the labyrinth through a deficient cochlear modiolus, resulting in damage to the hair cells. On the other hand, a recent MR study reported that the presence of a large EED and EES was frequently associated with cochlear modiolar deficiencies, but that some patients had a normal modiolus, even when hearing loss developed (12). The findings of this MR study do not necessarily support the previously suggested pressure wave theory. Rather, they support another previously suggested theory that hyperosmolar proteins in the EES reflux into the cochlear duct through a widely patent EED, causing osmotic damage to the neuroepithelium (6–8, 13). Another recent CT study reported that the degree of modiolar deficiency did not consistently correspond to the severity of hearing loss, although the morphology and thickness of the vestibular aqueduct did correlate strongly with the degree of hearing loss (14). Still another study reported that the diameter of the EED did not correspond to the degree of hearing loss (2). To clarify these controversial points, we investigated the relationship between severity of hearing loss, as determined by air-conduction audiographic data, and EED and EES volume, area of the cochlear modiolus, and signal intensity of the EES, as determined by 3D Fourier transformation thin-section MR imaging.

Methods

All studies were performed on a 1.5-T MR system using a quadrature surface phased-array coil. A pair of these quadrature surface coils was used as a phased array, with one coil placed over each ear. The heavily T2-weighted 3D fast asymmetric spin-echo pulse sequence was obtained with the following parameters: TR/TE/excitations = 4000/240/1, echo train length = 79, field of view = 16 cm, slice thickness = 0.8 mm, axial slab matrix = 512 × 512 × 40, voxel size = 0.3 × 0.3 × 0.8 mm without zero-fill interpolation, and scan time = 11 minutes 48 seconds. This equipment and pulse sequence have been described in detail earlier (12, 15, 16).

Thin-section MR images were obtained in 33 ears in 17 patients with EED and EES syndrome (one patient had unilateral disease). Seven patients were male and 10 were female; ages ranged from 4 to 33 years (mean age ± SD, 15.0 ± 9.4 years). The EED and EES are considered to be dilated when the diameter at the midpoint between the common crus and its external aperture is 1.5 mm or more on thin-section MR images (17). Two radiologists traced the area of the EED and EES as a single area manually on the MR console for each slice, and the volumes were obtained by summing each measured area multiplied by the slice thickness (Fig 1). The area of the cochlear modiolus and the signal intensity of the EES were also measured by drawing regions of interest manually. The area of the cochlear modiolus was measured in the axial slice in which the cochlear modiolus was visualized at its maximum size on thin-section T2-weighted images (Fig 2). The signal intensity ratio of the EES relative to that of adjacent CSF was calculated. The region of interest was drawn as large as possible in the EES. When the EES showed nonuniform signal, the signal intensity measurements were obtained from a region of interest drawn in the area of lower signal intensity (Fig 3). The signal intensity of adjacent CSF was measured by drawing a region of interest in the internal auditory canal, where the distance from the surface coil is similar to that of the EES and pulsatile motion of the CSF is relatively small (18). For modiolar area measurements, the area of low signal intensity with a distinctly triangular or trapezoidal shape at the axis of the basal turn or the basal and middle turn of the cochlea was outlined, excluding the free, thin part of the osseous spiral lamina and interscalar septum (9, 12). The diameter of the EED and EES was measured at the midpoint between the common crus and its external aperture (Fig 4). At the console, the window width was set to 100% of the range from the lowest to the highest pixel values in the image, and the window center level was set to the midpoint between the lowest and highest pixel values. Each radiologist performed each measurement twice, and the average of the two measurements was obtained. The final value was established by averaging the values obtained by the two observers. Interobserver and intraobserver variability were also assessed.

Figure
  • Download figure
  • Open in new tab
  • Download powerpoint

fig 1. Axial T2-weighted fast spin-echo image (4000/240/1; 0.8-mm thick) in an 18-year-old woman with EED and EES syndrome. The area of the EES is outlined (arrow). fig 2. Axial T2-weighted fast spin-echo image (4000/240/1; 0.8-mm thick) in a 20-year-old man with EED and EES syndrome. The area of the cochlear modiolus is outlined (arrow)

fig 3.
  • Download figure
  • Open in new tab
  • Download powerpoint
fig 3.

Axial heavily T2-weighted image (4000/240/1; 0.8-mm thick) in a 19-year-old man with EED and EES syndrome. A septumlike structure (arrow) is seen in the intraosseous EES. The signal of the posterior, dural portion of the EES (arrowheads) is lower than that of the intraosseous portion. fig 4. Axial T2-weighted fast spin-echo image (4000/240/1; 0.8-mm thick) in a 20-year-old man with EED and EES syndrome. The diameter of the EED and EES is indicated with a white line (arrow) at the midpoint between the common crus and its external aperture. In this case, the diameter is 2.4 mm

All patients were examined during the period from April 1996 to April 1999. The study protocol was approved by our institutional medical ethics committee, and informed consent to participate in the study was obtained from all patients or their legal guardians.

All ears showed progressive sensorineural hearing loss. The average hearing level was determined on the basis of the average of the air-conduction audiographic data obtained at 500, 1000, and 2000 Hz. Audiograms were obtained within 1 month of the MR examinations. These measured values and the patients' ages were compared against audiographic data at each frequency (250, 500, 1000, 2000, 4000 Hz) and against the average hearing level. The linear correlation was determined by simple regression analysis.

Results

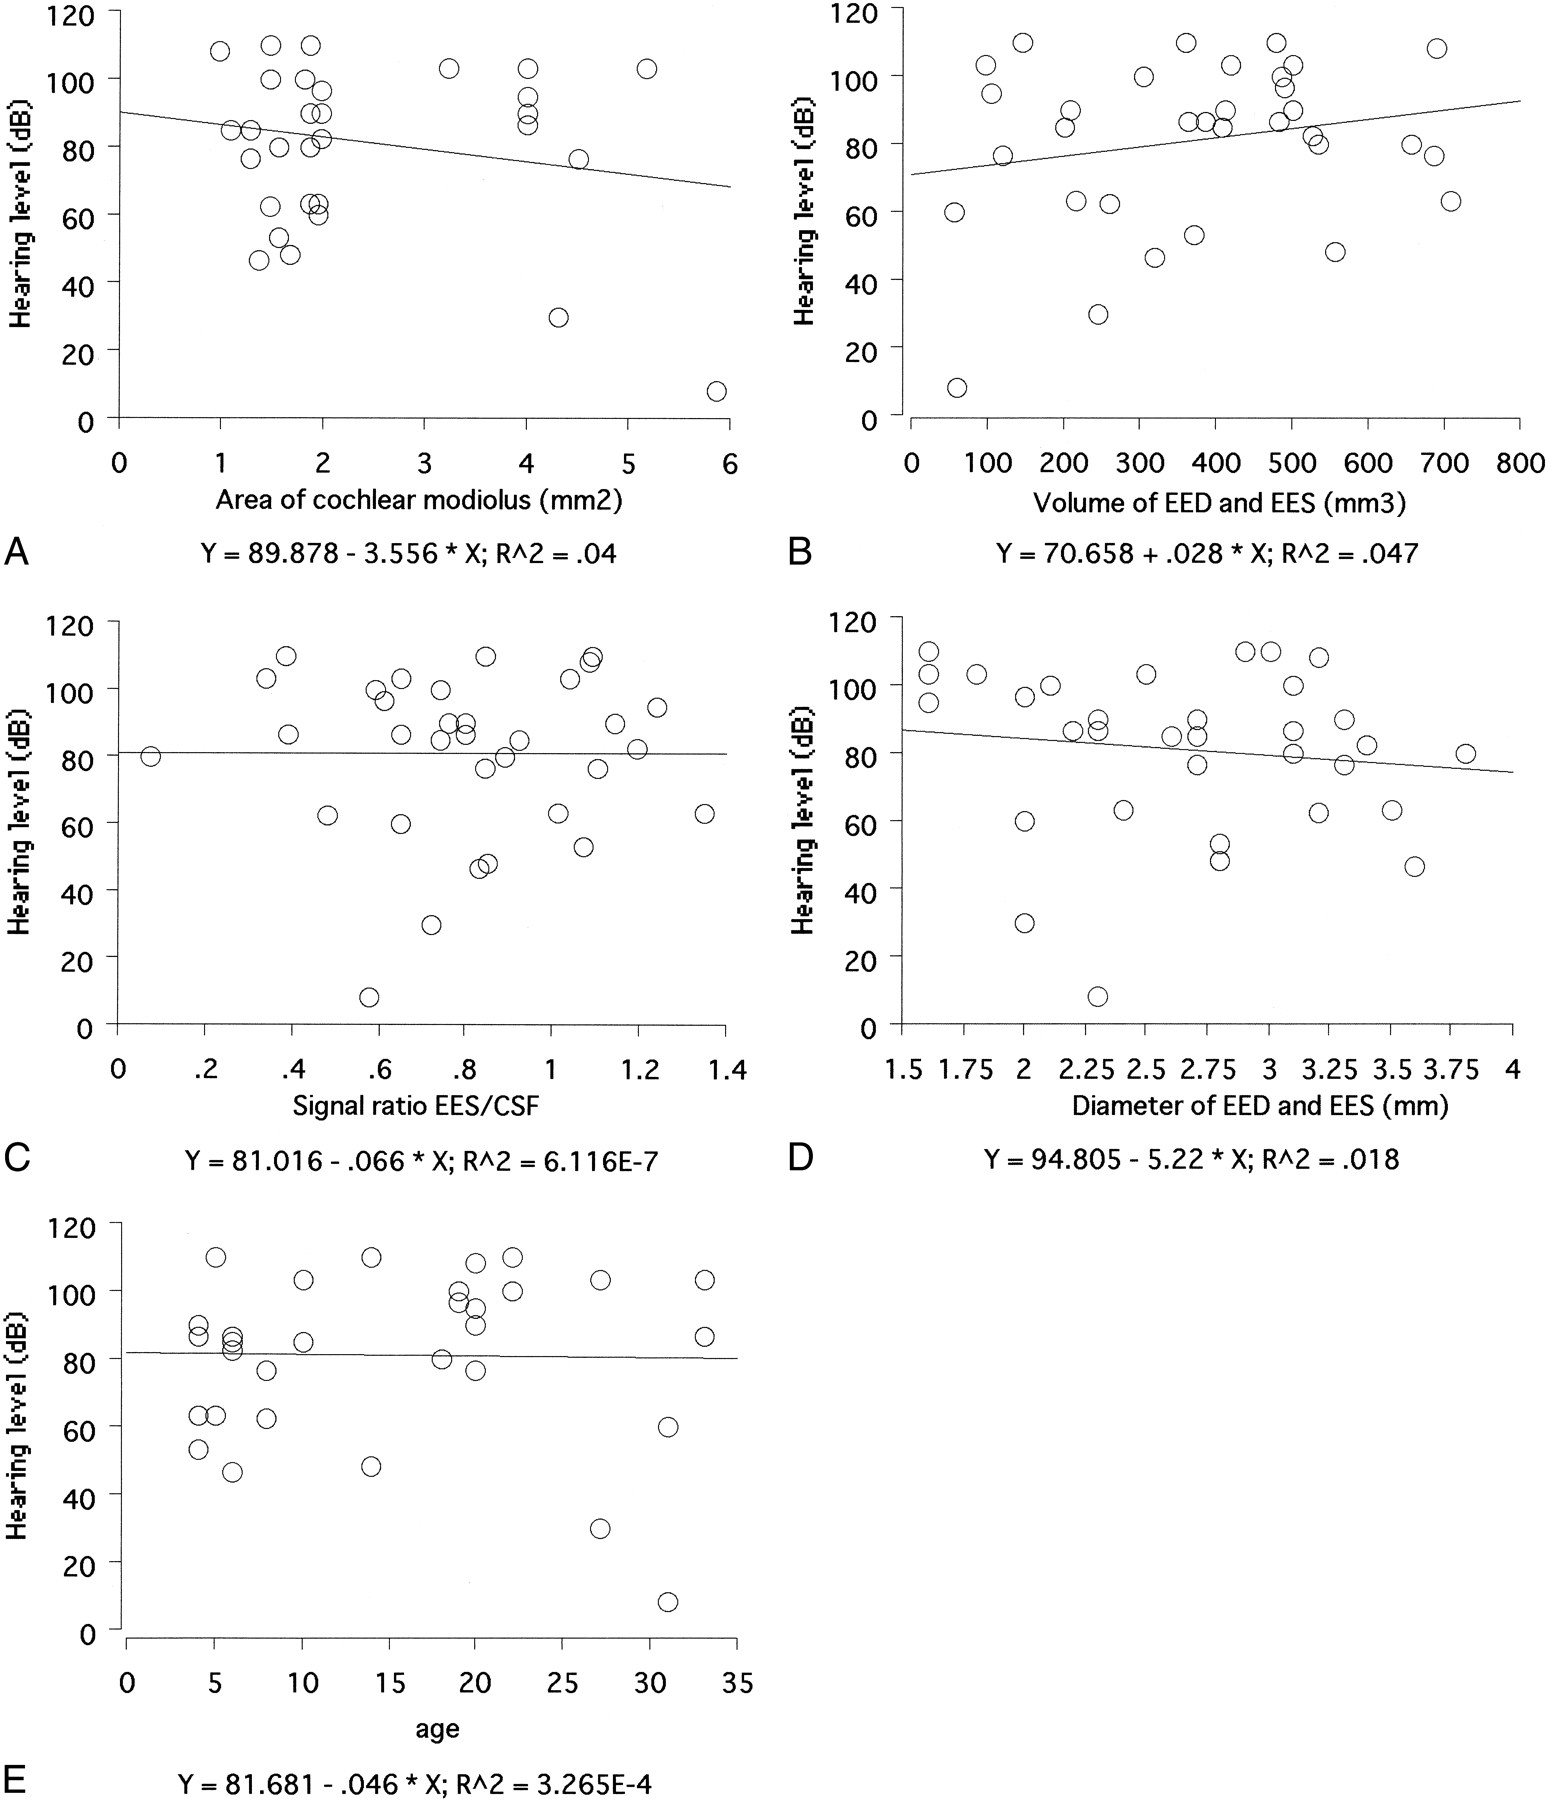
Patient data and results of each observer's measurements are summarized in Table 1. No significant correlation was found between volume of the EED and EES, area of the modiolus, signal intensity of the EES, diameter of the EED and EES, or patient age and the degree of hearing loss at any frequency and average hearing level. The correlation coefficients are listed in Tables 2 and 3. Scatter plots of the average hearing level versus each value are shown in Figure 5. Intraobserver variability for both observers and interobserver variability were less than 15% for all measurements.

View this table:
  • View inline
  • View popup
  • Download powerpoint
TABLE 1:

Summary of patient data and results of the measurements

View this table:
  • View inline
  • View popup
  • Download powerpoint
TABLE 2:

Correlation coefficient (r), r2, and P value

View this table:
  • View inline
  • View popup
  • Download powerpoint
TABLE 3:

r2 values at each frequency

fig 5.
  • Download figure
  • Open in new tab
  • Download powerpoint
fig 5.

A–E, Scatter plots of the average hearing level versus area of the cochlear modiolus (A), volume of the EED and EES (B), signal intensity ratio of EES/CSF (C), diameter of the EED and EES (D), and patient age (E). None of these values correlated with hearing level.

Discussion

The volumetric measurement of inner ear fluid has been reported by Melhem et al (19). These authors used 3D T2-weighted fast spin-echo images for measuring total labyrinthine fluid and obtained reproducible results using a voxel size of 0.6 × 0.6 × 0.6 mm. In the present study, a voxel size of 0.3 × 0.3 × 0.8 mm was used, and showed relatively small intraobserver and interobserver variability. We therefore believe that the values obtained in the present study are reliable.

According to the findings of a previous study using CT, a deficient modiolus is said to allow the transmission of CSF pressure waves into the labyrinth, resulting in damage to the hair cells in the organ of Corti (9). A recent MR study confirmed that a large EED and EES were frequently associated with modiolar deficiency but that some patients had a normal modiolar area (12). One recent CT study reported that the degree of modiolar deficiency did not consistently correspond to the severity of hearing loss; however, the morphology and thickness of the vestibular aqueduct were strongly correlated with the degree of hearing loss (14). The results of the present study also showed that the degree of cochlear deficiency did not correspond to hearing level, suggesting the possibility that a microscopic area of damage or fragility in the inner ear is not seen even on high-resolution MR images.

Another theory suggests that hyperosmolar proteins in the enlarged EES reflux into the ductus cochlearis (scala media) through a widely patent EED, causing osmotic damage to the neuroepithelium (6–8, 13, 20). It has been reported that the protein concentration in the EES is quite high (1000–3000 mg/dL) even in healthy subjects (8). In one patient with EED and EES syndrome, the protein concentration in the EES was reported to be 660 mg/dL (21). However, the signal intensity of the EES varied from patient to patient, suggesting that the protein concentration also varies from patient to patient (22). The signal intensity of the EES was reported to be higher than that of CSF on T1-weighted images and lower on T2-weighted images in eight of 10 ears in patients with EED and EES syndrome, suggesting a high protein content within the EES (7, 8). In the present study, the signal intensity values of the EES did not correspond to hearing level. The results of the present study do not directly support the latter theory. Signal intensity on T2-weighted images of the EES may differ from that at the time the insult to the neuroepithelium occurred. The fluid with high protein concentration shows lower signal intensity on heavily T2-weighted images (23). However, sludge or extravasated blood also can cause the signal reduction. Thus, signal intensity may not directly correlate with protein concentration.

In the present study, only five of 17 patients experienced vertigo during the follow-up period. The EED is connected with the labyrinth at the vestibule, and symptoms of vestibular disturbance would be expected to appear if pressure waves or hyperosmolar fluid reflux through the EED were responsible for the hearing loss.

EED and EES syndrome has a genetic component (22, 24), and patients with this syndrome have simply been advised to avoid contact sports. Recently, however, the use of cochlear implants in patients with EES and EED syndrome has been advocated, although there is the risk of a perilymph gusher (25). EES and EED syndrome is sometimes associated with fixation of the stapes or abnormality of the round window, resulting in stapes gusher or perilymph fistula (26–28). High-resolution MR imaging is useful as a presurgical examination to evaluate cochlear patency in cochlear implant candidates (29).

Conclusion

The modiolar area and volume of the EED and EES do not correlate with the severity of hearing loss. These results suggest that there is a microscopic area of damage or fragility in the inner ear not visible even with current high-resolution T2-weighted MR imaging.

Footnotes

  • ↵1 Address reprint requests to Shinji Naganawa, MD, Department of Radiology, Nagoya University School of Medicine, 65 Tsurumai-cho, Shouwa-ku, Nagoya 466-8550, Japan.

References

  1. ↵
    Mafee MF, Charlette D, Kumar A, Belmount H. Large vestibular aqueduct and congenital sensorineural hearing loss. AJNR Am J Neuroradiol 1992;13:805-819
    FREE Full Text
  2. ↵
    Dahlen RT, Harnsberger HR, Gray SD, et al. Overlapping thin section fast spin echo MR of the large vestibular aqueduct syndrome: comparison with CT. AJNR Am J Neuroradiol 1997;18:67-75
    Abstract
  3. ↵
    Okumura T, Takahashi H, Honjo I, Takagi A, Mitamura K. Sensorineural hearing loss in patients with large vestibular aqueduct. Laryngoscope 1995;105:289-294
    PubMed
  4. ↵
    Emmett JR. The large vestibular aqueduct syndrome. Am J Otol 1985;6:387-415
    PubMed
  5. ↵
    Valvassori GE, Clemis JD. The large vestibular aqueduct syndrome. Laryngoscope 1978;88:723-728
    PubMed
  6. ↵
    Wilson DF, Hodgson RS, Talbot JM. Endolymphatic sac obliteration for large vestibular aqueduct syndrome. Am J Otol 1997;1:101-107
  7. ↵
    Okamoto K, Ito J, Furusawa T, Sakai K, Tokiguchi S. Large vestibular aqueduct syndrome with high CT density and high MR signal intensity. AJNR Am J Neuroradiol 1997;18:482-484
    Abstract
  8. ↵
    Okamoto K, Ito J, Furusawa T, Sakai K, Horikawa S, Tokiguchi S. MRI of enlarged endolymphatic sacs in the large vestibular aqueduct syndrome. Neuroradiology 1998;40:167-172
    CrossRefPubMed
  9. ↵
    Lemmerling MM, Mancuso AA, Antonelli PJ, Kubilis PS. Normal modiolus: CT appearance in patients with a large vestibular aqueduct. Radiology 1997;204:213-219
    PubMed
  10. Okumura T, Takahashi H, Honjo I, et al. Vestibular function in patients with a large vestibular aqueduct. Acta Otolaryngol Suppl (Stockh) 1995;520:323-326
  11. Okumura T, Takahashi H, Honjo I, Takagi A, Azato R. Magnetic resonance imaging of patients with large vestibular aqueducts. Eur Arch Otorhinolaryngol 1996;253:425-428
    PubMed
  12. ↵
    Naganawa S, Ito T, Iwayama E, et al. MR imaging of the cochlear modiolus: area measurement in normal subjects and in patients with a large endolymphatic duct and sac. Radiology 1999;231:819-823
  13. Levenson MJ, Parisier SC, Jacobs M, Edelstein DR. The large vestibular aqueduct syndrome in children: a review of 12 cases and the description of a new clinical entity. Arch Otolaryngol Head Neck Surg 1989;115:54-58
  14. ↵
    Antonelli PJ, Nall AV, Lemmerling MM, Mancuso AA, Kubilis PS. Hearing loss with cochlear modiolar defects and large vestibular aqueducts. Am J Otol 1998;19:306-312
    PubMed
  15. Naganawa S, Ito T, Fukatsu H, et al. Three-dimensional fast spin echo MR of the inner ear: ultra-long ETL and half-Fourier technique. AJNR Am J Neuroradiol 1998;19:739-741
    Abstract
  16. Naganawa S, Ito T, Fukatsu H, et al. MR imaging of the inner ear: comparison of a three-dimensional fast spin-echo sequence with use of a dedicated quadrature-surface phased array coil with a gadolinium-enhanced spoiled gradient recalled sequence. Radiology 1998;208:679-685
    PubMed
  17. ↵
    Harnsberger HR, Dahlen RT, Shelton C, Gray SD, Parkin JL. Advanced techniques in magnetic resonance imaging in the evaluation of the large endolymphatic duct and sac syndrome. Laryngoscope 1995;105:1037-1042
    PubMed
  18. ↵
    Iwayama E, Naganawa S, Ito T, et al. High-resolution MR cisternography of the cerebellopontine angle: 2D versus 3D fast spin-echo sequences. AJNR Am J Neuroradiol 1999;20:889-895
    Abstract/FREE Full Text
  19. ↵
    Melhem ER, Shakir H, Bakthavachalam S, et al. Inner ear volumetric measurements using high-resolution 3D T2-weighted fast spin-echo MR imaging: initial experience in healthy subjects. AJNR Am J Neuroradiol 1998;19:1819-1822
    Abstract
  20. Hirsch BE, Weissman JL, Curtin HD, Kamerer DB. Magnetic resonance imaging of the large vestibular aqueduct. Arch Otolaryngol Head Neck Surg 1992;118:1124-1127
  21. ↵
    Jackler RK, Cruz ADL. The large vestibular aqueduct syndrome. Laryngoscope 1989;99:1238-1243
    PubMed
  22. ↵
    Phelps PD, Coffey RA, Trembath RC, et al. Radiological malformations of the ear in Pendred syndrome. Clin Radiol 1998;53:268-273
    CrossRefPubMed
  23. ↵
    Sai J, Ariyama J. MRCP: Early Diagnosis of Pancreatobiliary Disease: T2-Shortening Bile.. Tokyo: Springer 2000;66-67
  24. Tong KA, Harnsberger HR, Dahlen RT, Carey JC, Ward K. Large vestibular aqueduct syndrome: a genetic disease? AJR Am J Roentgenol 1997;168:1097-1101
    PubMed
  25. ↵
    Aschendorff A, Marangos N, Laszig R. Large vestibular aqueduct syndrome and its implication for cochlear implant surgery. Am J Otol 1997;18 (Suppl):S57
    PubMed
  26. ↵
    Schessel DA, Nedzelski JM. Presentation of large vestibular aqueduct syndrome to a dizziness unit. J Otolaryngol 1992;21:265-269
    PubMed
  27. Belenky WA, Madgy DN, Leider JS, Becker CJ, Hotaling AJ. The enlarged vestibular aqueduct syndrome (EVA syndrome). Ear Nose Throat J 1993;72:746-751
    PubMed
  28. Shirazi A, Fenton JE, Fagan PA. Large vestibular aqueduct syndrome and stapes fixation. J Laryngol Otol 1994;108:989-990
    PubMed
  29. ↵
    Ito T, Naganawa S, Fukatsu H, et al. High resolution MR images of the inner ear internal anatomy using a local gradient coil at 1.5 tesla: Correlation with histological specimen. Radiat Med 1999;17:343-347
    PubMed
  • Received December 17, 1999.
  • Accepted after revision March 22, 2000.
  • Copyright © American Society of Neuroradiology
View Abstract
PreviousNext
Back to top

In this issue

American Journal of Neuroradiology
Vol. 21, Issue 9
1 Oct 2000
  • Table of Contents
  • Index by author
Advertisement
Print
Download PDF
Email Article

Thank you for your interest in spreading the word on American Journal of Neuroradiology.

NOTE: We only request your email address so that the person you are recommending the page to knows that you wanted them to see it, and that it is not junk mail. We do not capture any email address.

Enter multiple addresses on separate lines or separate them with commas.
MR Imaging of the Enlarged Endolymphatic Duct and Sac Syndrome by Use of a 3D Fast Asymmetric Spin-echo Sequence: Volume and Signal-intensity Measurement of the Endolymphatic Duct and Sac and Area Measurement of the Cochlear Modiolus
(Your Name) has sent you a message from American Journal of Neuroradiology
(Your Name) thought you would like to see the American Journal of Neuroradiology web site.
CAPTCHA
This question is for testing whether or not you are a human visitor and to prevent automated spam submissions.
Cite this article
Shinji Naganawa, Tokiko Koshikawa, Eriko Iwayama, Hiroshi Fukatsu, Tsuneo Ishiguchi, Takeo Ishigaki, Mitsuru Ikeda, Tsutomu Nakashima, Nobuyasu Ichinose
MR Imaging of the Enlarged Endolymphatic Duct and Sac Syndrome by Use of a 3D Fast Asymmetric Spin-echo Sequence: Volume and Signal-intensity Measurement of the Endolymphatic Duct and Sac and Area Measurement of the Cochlear Modiolus
American Journal of Neuroradiology Oct 2000, 21 (9) 1664-1669;

Citation Manager Formats

  • BibTeX
  • Bookends
  • EasyBib
  • EndNote (tagged)
  • EndNote 8 (xml)
  • Medlars
  • Mendeley
  • Papers
  • RefWorks Tagged
  • Ref Manager
  • RIS
  • Zotero
0 Responses
Respond to this article
Share
Bookmark this article
MR Imaging of the Enlarged Endolymphatic Duct and Sac Syndrome by Use of a 3D Fast Asymmetric Spin-echo Sequence: Volume and Signal-intensity Measurement of the Endolymphatic Duct and Sac and Area Measurement of the Cochlear Modiolus
Shinji Naganawa, Tokiko Koshikawa, Eriko Iwayama, Hiroshi Fukatsu, Tsuneo Ishiguchi, Takeo Ishigaki, Mitsuru Ikeda, Tsutomu Nakashima, Nobuyasu Ichinose
American Journal of Neuroradiology Oct 2000, 21 (9) 1664-1669;
del.icio.us logo Twitter logo Facebook logo Mendeley logo
  • Tweet Widget
  • Facebook Like
  • Google Plus One

Jump to section

  • Article
    • Abstract
    • Methods
    • Results
    • Discussion
    • Conclusion
    • Footnotes
    • References
  • Figures & Data
  • Info & Metrics
  • Responses
  • References
  • PDF

Related Articles

  • No related articles found.
  • PubMed
  • Google Scholar

Cited By...

  • Does CISS MRI Reliably Depict the Endolymphatic Duct in Children with and without Vestibular Aqueduct Enlargement?
  • Crossref
  • Google Scholar

This article has not yet been cited by articles in journals that are participating in Crossref Cited-by Linking.

More in this TOC Section

  • ASL Sensitivity for Head and Neck Paraganglioma
  • Post SRS Peritumoral Hyperintense Signal of VSs
  • Contrast Enhanced Pituitary CISS/FIESTA
Show more Head and Neck Imaging

Similar Articles

Advertisement

Indexed Content

  • Current Issue
  • Accepted Manuscripts
  • Article Preview
  • Past Issues
  • Editorials
  • Editor's Choice
  • Fellows' Journal Club
  • Letters to the Editor
  • Video Articles

Cases

  • Case Collection
  • Archive - Case of the Week
  • Archive - Case of the Month
  • Archive - Classic Case

More from AJNR

  • Trainee Corner
  • Imaging Protocols
  • MRI Safety Corner
  • Book Reviews

Multimedia

  • AJNR Podcasts
  • AJNR Scantastics

Resources

  • Turnaround Time
  • Submit a Manuscript
  • Submit a Video Article
  • Submit an eLetter to the Editor/Response
  • Manuscript Submission Guidelines
  • Statistical Tips
  • Fast Publishing of Accepted Manuscripts
  • Graphical Abstract Preparation
  • Imaging Protocol Submission
  • Evidence-Based Medicine Level Guide
  • Publishing Checklists
  • Author Policies
  • Become a Reviewer/Academy of Reviewers
  • News and Updates

About Us

  • About AJNR
  • Editorial Board
  • Editorial Board Alumni
  • Alerts
  • Permissions
  • Not an AJNR Subscriber? Join Now
  • Advertise with Us
  • Librarian Resources
  • Feedback
  • Terms and Conditions
  • AJNR Editorial Board Alumni

American Society of Neuroradiology

  • Not an ASNR Member? Join Now

© 2025 by the American Society of Neuroradiology All rights, including for text and data mining, AI training, and similar technologies, are reserved.
Print ISSN: 0195-6108 Online ISSN: 1936-959X

Powered by HighWire