
Abstract
BACKGROUND AND PURPOSE: In fat embolism, free fatty acid is more toxic than neutral fat in terms of tissue damage. We evaluated the hyperacute embolic effects of triolein and oleic acid in cat brains by using MR imaging and electron microscopy.
METHODS: T2-weighted imaging, diffusion-weighted imaging, and contrast-enhanced T1-weighted imaging were performed in cat brains after the injection of triolein (group 1, n = 8) or oleic acid (group 2, n = 10) into the internal carotid artery. MR images were quantitatively assessed by comparing the signal intensity ratios of the lesions with their counterparts on T2-weighted images, apparent diffusion coefficient (ADC) maps, and contrast-enhanced T1-weighted images. Electron microscopic findings in group 1 were compared with those in group 2.
RESULTS: Qualitatively, MR images revealed two types of lesions. Type 1 lesions were hyperintense on diffusion-weighted images and hypointense on ADC maps. Type 2 lesions were isointense or mildly hyperintense on diffusion-weighted images and isointense on ADC maps. Quantitatively, the signal intensity ratios of type 1 lesions in group 2 specimens were significantly higher on T2-weighted images (P = .013)/(P = .027) and lower on ADC maps compared with those of group 1. Electron microscopy of type 1 lesions in both groups revealed more prominent widening of the perivascular space and swelling of the neural cells in group 2, in contrast to notable endothelial defects in group 1.
CONCLUSION: MR and electron microscopic data on cerebral fat embolism induced by either triolein or oleic acid revealed characteristics suggestive of both vasogenic and cytotoxic edema in the hyperacute stage. Tissue damage appeared more severe in the oleic acid group than in the triolein group.
Experimental animal models of fat embolism generally focus on lung injury, because the lung is the primary site of fat embolism in patients with trauma. However, because neurologic signs can precede respiratory symptoms, the brain may reveal more distinctive pathologic characteristics.
The classic mechanism of fat embolism syndrome is explained by mechanical and biochemical theories. The mechanical theory postulates that triglyceride particles from injured adipose tissue enter the circulation and obstruct the pulmonary vessels. The biochemical hypothesis implicates free fatty acids, proposing that local hydrolysis of triglyceride emboli by pneumocyte lipase, together with excessive mobilization of free fatty acids from peripheral adipose tissue by stress hormones, results in the toxic concentration of these acids in the lungs (1).
Experimental reports of cerebral fat embolism are rare. Kim et al (2) found that the blood-brain barrier is disrupted within 30 minutes after neutral fat embolization. Hyperintensity on T2-weighted images and lesional enhancement on contrast-enhanced T1-weighted images are related to defects in the endothelial wall and the early appearance of vasogenic edema.
Comparisons of the histopathologic findings (1, 3–6) reveal that free fatty acids are more toxic than neutral fat in the lung and kidney. Kim et al (2) studied only the effect of neutral fat, and to our knowledge, the different fat emboli in the brain have not been compared. The present study was conducted to evaluate the differences in embolic effects between two groups: those embolized with triolein (neutral fat) and those embolized with oleic acid (free fatty acid). We used MR imaging and electron microscopy to compare the embolic effects in the two groups.
Methods
Animal Models and Experimental Design of Fat Embolism
Our institutional animal review board approved all of the experimental protocols. Cats were anesthetized with intramuscular injection of ketamine HCl (2.5 mg/kg; Korea United Pharm Inc., Seoul, Korea) and xylazine (0.125 mg/kg; Bayer Korea, Seoul, Korea). Body temperatures were measured by using a rectal probe (MGA-III 219; Shibaura Electronics Co. Ltd., Tokyo, Japan) and maintained at 37.0–37.5°C. We placed an 18-gauge angiographic catheters (Angiocath; Becton Dickinson, UT) in the left femoral artery for the injection of a contrast material or drugs to allow monitoring of the blood pressure and blood gas levels in the left femoral vein. The right femoral artery was isolated, and another 18-gauge angiographic catheter (Angiocath; Becton Dickinson) was inserted into the artery. A 3F microcatheter (MicroFerret-18 infusion catheter; William Cook Europe, Bjaeverskov, Denmark) was passed through the angiographic catheter into the lumen of the artery. The right internal carotid artery was selected. The tip of the microcatheter was positioned just proximal to the entrance of the intracranial portion of the internal carotid artery.
The cats were assigned to one of two groups: Group 1 (n = 8) received a single 0.1-mL dose of neutral triglyceride triolein (1,2,3-tri[cis-9-octadecenoyl]glycerol, Sigma, St Louis, MO) and group 2 (n = 10) were treated with 0.1 mL of oleic acid (cis-9-octadecenoic acid; Sigma), by using a 1-mL syringe. After the treatment with triolein or oleic acid, 2 mL of saline was injected with a 2-mL syringe over 30 seconds.
MR Imaging
Serial MR imaging was performed at 30 minutes and 2 hours after embolization. Cats were placed in a prone position in a pediatric MR positioning device, and a small field of view (FOV) radio-frequency coil (Siemens, Erlangen, Germany) was placed above its head. All studies were performed with a 1.5-T MR unit (Vision; Siemens). Images were acquired in the coronal plane. For spin-echo imaging, the following parameters were used: TR/TE/NEX of 3000/96/2 for T2-weighted sequences and 320/20/2 for T1-weighted sequences, a section thickness of 4 mm with a 0.1-mm gap, an FOV of 70–75 mm, and an acquisition matrix of 210 × 256. Diffusion-weighted imaging was performed using an echo-planar sequence. The imaging parameters were as follows: an FOV of130 mm, 128 phase-encoding steps, a section thickness of 4 mm, a gap of 0.1 mm, and an acquisition matrix of 96 × 160. The diffusion sensitizing gradient was oriented at the y-axis (ventral to dorsal) with b values of 0 and 1000 s/mm2. The apparent diffusion coefficient (ADC) map was obtained by using custom software (Pusan National University Hospital, Pusan, Korea). For contrast-enhanced studies, 0.2 mmol/kg gadopentetate dimeglumine (Magnevist; Schering, Germany) was injected intravenously.
Analysis of MR Images
Qualitative Assessments.—
T2-weighted images, diffusion-weighted images, ADC maps, and contrast-enhanced T1-weighted images obtained in the two groups were analyzed for the presence and area of abnormal signal intensity. High signal intensity on T2-weighted images or diffusion-weighted imaged or low signal intensity on the ADC maps or enhancement on contrast-enhanced T1-weighted images at either examination was defined as a lesion.
Quantitative Analyses.—
For quantitative assessment, signal intensity ratios on T2-weighted images, ADC maps, and contrast-enhanced T1-weighted images were measured in both groups. The signal intensity ratio was defined as the ratio of the intensity in the region of interest of an obviously abnormal lesion to that of the normal contralateral hemisphere. If the counterpart was affected, adjacent normal areas were counted. On serial images obtained in the same cat, the size and position of the region of interest were identical. The significance of the differences in the signal intensity ratio between group 1 and group 2 and the changes in the signal intensity ratio over time were estimated in an analysis of variance based on repeated measurements.
Electron Microscopy
Immediately after the cats were sacrificed by using sodium thiopental their brains were excised, and a homemade cutting device was used to dissect them into 4-mm-thick sections in the same coronal plane as that of the MR images. Three areas of gray matter that correlating to lesions observed on the MR images were selected. These areas were cut into 1-mm3 cubes to prepare blocks for electron microscopy. Samples were prefixed with 2.5% glutaraldehyde in phosphate-buffered saline at pH 7.2 for 2 hours at 1–4°C and washed in 0.1-mol/L phosphate-buffered saline. Next, samples were fixed in 1% OsO4 solution for 2 hours and washed in the same solution. After washing, the samples were dehydrated with alcohol, treated in a mordant en bloc overnight with Polybed 812 resin (Polysciences, Warrington, PA) and stored for 12 hours at 37°C and then for 48 hours at 45°C. The resin-embedded blocks were cut into 1-μm-thick sections and stained with toluidine blue. Areas of interest were then selected under a light microscope. Ultrathin sections were prepared by using an ultramicrotome (Leica, Vien, Austria) with a diamond knife and applied to nickel 150 mesh grids. Samples were stained with uranyl acetate and lead citrate and examined with a transmission electron microscope (JEM 1200 EX-II; JEOL, Tokyo, Japan).
The presence of intra- or extravascular fat vacuoles, the integrity of the capillary endothelial wall, widening of the perivascular interstitial space, and neural cellular swelling were evaluated. The mean number of intravascular fat vacuoles was calculated within five mesh spaces in the field. Perivascular interstitial space widening was classified as mild or severe. Mild widening was present when the widest perivascular space was less than 5 μm, and severe widening was defined as that greater than 5 μm. Neural cellular swelling was classified as mild if the diameter of a swollen cell was less than 5 μm or severe if the diameter was greater than 5 μ m.
Results
Qualitative Assessment with MR imaging
In the eight cats in group 1 that were injected with 0.1 mL of triolein, the MR images showed lesions with two types of signal intensity. Type 1 lesions had high signal intensity on T2-weighted images and diffusion-weighted images, low signal intensity on ADC maps, and mild enhancement on contrast-enhanced T1-weighted images. Type 2 lesions had mildly high signal intensity on T2-weighted images and diffusion-weighted images, isointense signal on ADC maps, and strong enhancement on contrast-enhanced T1-weighted images (Fig 1). Both types were simultaneously present in seven cats. Type 1 lesions were commonly observed in the medial portion of the superficial gray matter and white matter of the hemisphere, whereas type 2 lesions frequently surrounded the type 1 lesions and were larger. One cat of group 1 had only type 2 lesions; no definite type 1 lesion could be identified in this particular cat. In all eight cats, lesions were located in the ipsilateral superficial gray matter, most commonly at the medial and posterior portions of the hemisphere. The ipsilateral white matter was affected in six cats. In five cats, the ipsilateral deep gray matter was additionally involved. Contralateral superficial gray matter was focally affected in four cats.
Group 1. MR images obtained 2 hours after cat brains were embolized with triolein show type 1 (solid arrow) and type 2 (open arrows) lesions. Type 2 lesions are bigger than type 1 lesions.
A, T2-weighted (3000/96/2 [TR/TE/NEX]) image. Type 1 and type 2 lesions are hyperintense.
B, Contrast-enhanced T1-weighted (320/30/2) image. Type 1 lesions show mild enhancement. Type 2 lesions show enhancement.
C, Diffusion-weighted image. Type 1 lesions are hyperintense. Type 2 lesions have isointensity or slight hyperintensity.
D, ADC map. Type 1 lesions are hypointense. Type 2 lesions are isointense.
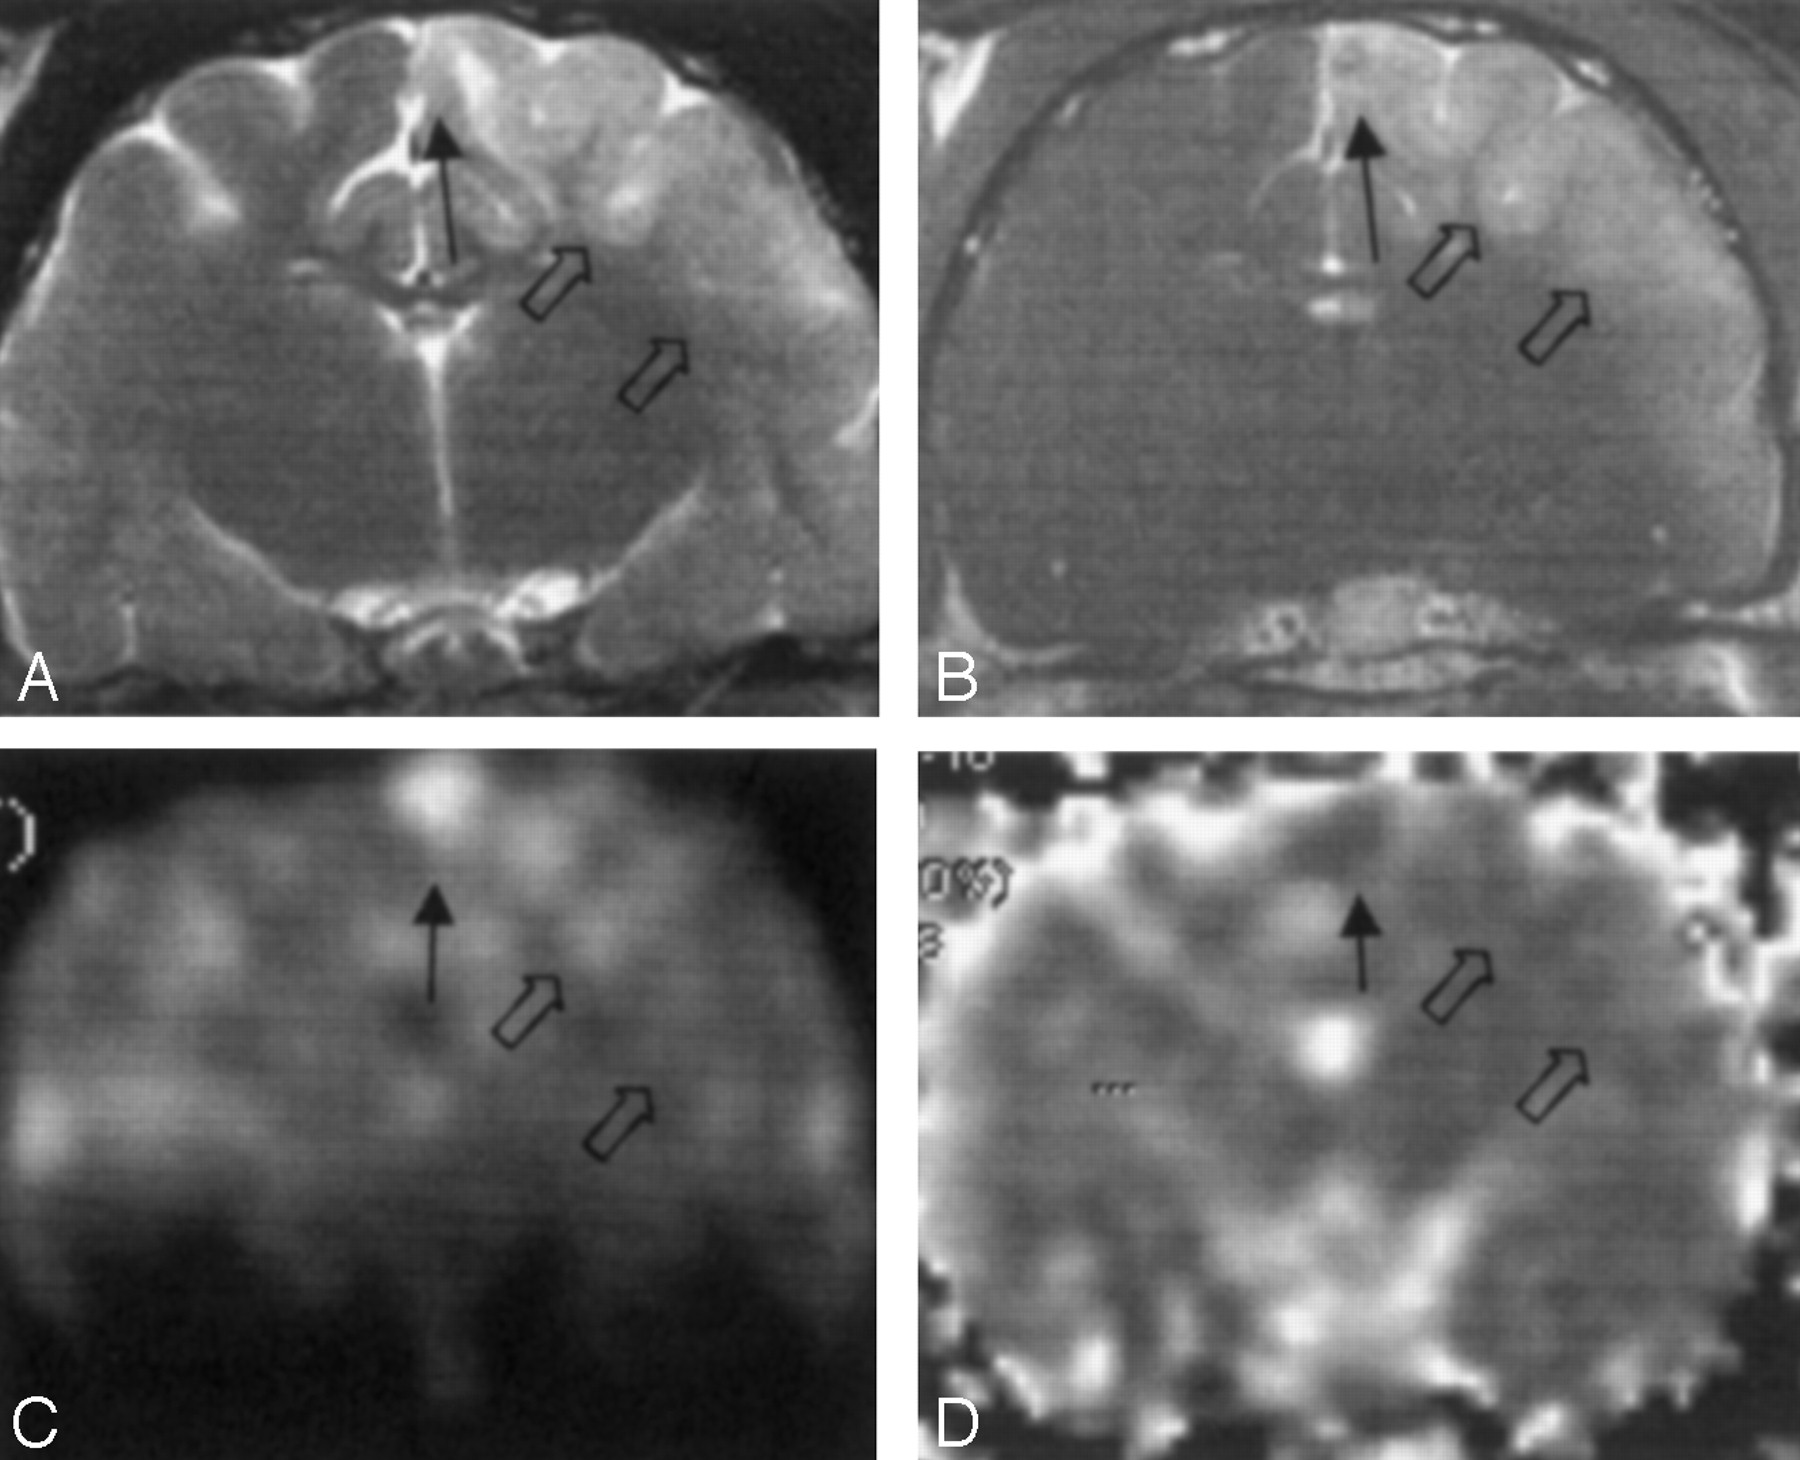
In the 10 animals in group 2, two types of lesions were present, similar to those of group 1 (Fig 2). Both types were simultaneously present in eight cats, whereas only type 2 lesions were observed in two animals. The ipsilateral superficial gray matter was affected in all cats, and the ipsilateral white matter was affected in nine cats. Contralateral superficial gray matter was affected in two cats. Ipsilateral deep gray matter was affected in seven cats, and the brain stem was affected in six cats. T2-weighted images, diffusion-weighted images, and ADC maps generally showed more prominent abnormal signal intensity in the group 2 animals, compared with those of group 1. However, contrast enhancement on contrast-enhanced T1-weighted images was less prominent in group 2.

Group 2. MR images obtained 2 hours after cat brains were embolized with oleic acid group show type 1 (solid arrow) and type 2 (open arrows) lesions.
A, T2-weighted (3000/96/2) image. Type 1 lesions have mild hyperintensity. Type 2 lesions are hyperintense.
B, Contrast-enhanced T1-weighted (320/30/2) image. Type 1 lesions show less enhancement than do type 2 lesions, which show strong enhancement.
C, Diffusion-weighted image. Type 1 lesions are hyperintense. Type 2 lesions have isointensity or mild hyperintensity.
D, ADC map. Type 1 lesions are hypointense. Type 2 lesions are isointense.
Lesions in both groups were more prominent in images obtained at 2 hours, compared with those obtained at 30 minutes. Lesions did not change in type over the measured time period in all cats in both groups. However, the size of lesions was slightly increased at 2 hours, compared with their size at 30 minutes, and they extended to the white matter in some cats.
Quantitative Measurements on MR Images
Signal intensity ratios of both types of lesions in group 1 and 2 animals were measured (Figs 3–5, Tables 1–3).

Bar graph of the signal intensity ratios on T2-weighted images. At 2 hours, the ratios in type 1 and type 2 lesions increase significantly in both groups (P < .001). The ratios of type 1 lesions are significantly higher in group 2 compared with group 1 at both 30 minutes and 2 hours (P = .013). However, in type 2 lesions, the ratios do not significantly differ in either group at either time (P > .643).
Mean signal intensity ratios of the lesions on T2-weighted images
On T2-weighted images (Fig 3, Table 1), the signal intensity ratios of type 1 lesions in group 2 were statistically higher than those in group 1 (P = .013). For type 2 lesions, however, signal intensity ratios were not significantly different between the groups (P > .643). The signal intensity ratios of both groups significantly increased at 2 hours compared with those at 30 minutes (P < .001). Signal intensity ratios in type 1 lesions were significantly higher than those in type 2 lesions in group 2 (P < .042).
On the ADC maps (Fig 4, Table 2), in type 1 lesions, the signal intensity ratios were significantly lower in group 2 compared with those in group 1 at both 30 minutes and 2 hours (P = 0.27). However, in type 2 lesions, the signal intensity ratios did not significantly differ between the two groups at either time point (P = .144). Notably, signal intensity ratios in type 1 lesions were lower than those of type 2 in both groups at each time point (P < .001). No significant changes were observed in signal intensity ratios in the time-course experiments (P > .485).

Bar graph of the signal intensity ratios on the ADC maps. Compared with the baseline value at 30 minutes, the ratios in types 1 and type 2 lesions did not change significantly at 2 hours in either group (P > .485). With the type 1 lesions, the ratios in group 2 were significantly lower than those in group 1 at each time point (P = .027). However, in type 2 lesions, the ratios were not significantly different in either group (P > .144).
Mean signal intensity ratios of the lesions on ADC maps
On contrast-enhanced T1-weighted images (Fig 5, Table 3), the signal intensity ratios in type 2 lesions in group 1 were significantly higher than those in group 2 (P < .001). In the time-course experiments, a significant increase was observed in the signal intensity ratios in type 1 lesions (P = .013) but not in type 2 lesions (P > .683). In group 1, signal intensity ratios in type 2 lesions were generally higher than those in type 1 lesions (P = .001).
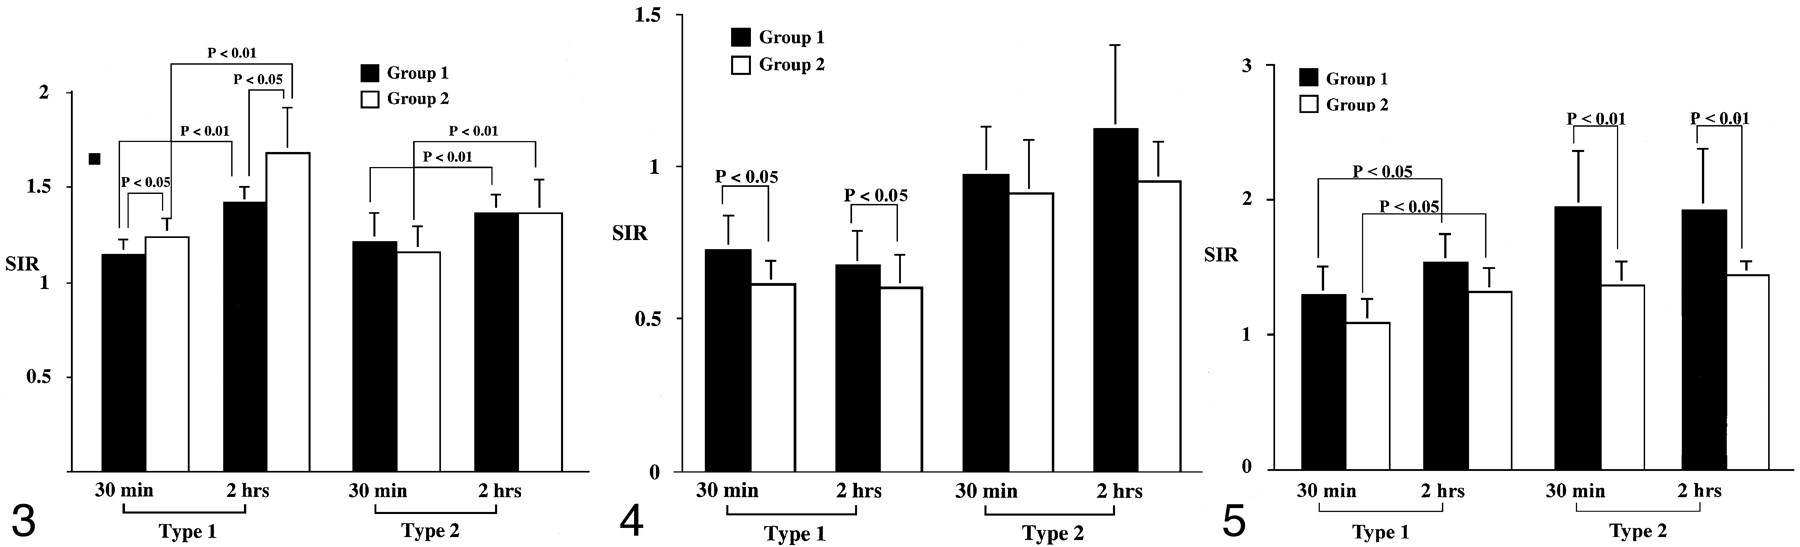
Bar graph of the signal intensity ratios on contrast-enhanced T1-weighted images. Compared with the baseline values at 30 minutes, the ratios in type 1 lesions increase significantly at 2 hours in both groups (P = .034). In type 1 lesions, the ratios are not significantly different between group 1 and 2 at each time point (P > .051). However, in type 2 lesion, the ratios in group 1 are higher than those in group 2 at each time point (P < .001).
Mean signal intensity ratios of the lesions on contrast-enhanced T1-weighted images
Electron Microscopy Findings
Samples from all cats with type 1 or type 2 lesions in both groups were examined at electron microscopy. In group 1 (triolein group), intravascular fat vacuoles and endothelial defects were frequently observed (Fig 6). Widening of the perivascular interstitial space was mild in seven cats, including one cat with only type 2 lesions. This widening was severe in one cat. Neuropil swelling was mild in six cats, including one cat with only type 2 lesions. This swelling was severe in two cats. In all cats, intravascular fat vacuoles were present within the dilated lumen. The number of intravascular fat vacuoles in five mesh spaces ranged from 0.2 to 5. The sizes varied, ranging from 10 to 50 μm. Endothelial cells were stretched thin because of the vacuoles. In larger arterioles, the vacuoles were commonly elongated or sausage-shaped. Fat vacuoles appeared homogeneous, round, and less dark compared with the red blood cells. Defects in the endothelial wall were frequently observed in six cats. Tiny pinocytic vacuoles were sporadically noted on the endothelial walls. Phagocytosed fat vacuoles measuring 0.25–1 μm in diameter were also present in two cats. The enlarged perivascular interstitial spaces contained fluid that frequently included various microstructures such as lysosomes, mitochondria, destroyed cell membranes, or red blood cells. The perivascular fluid was identical to the intravascular plasma.

Electron microscopy findings in a type 1 lesion in a cat brain from group 1, which was treated with triolein (original magnification ×3000). Photomicrograph shows an intravascular fat vacuole (F) and defects in the endothelial wall (solid arrows). Areas of perivascular interstitial edema (asterisk) and neuropil swelling (arrowhead) are smaller than 5 μm in diameter. Open arrows represent red blood cells. Bar indicates 2 μm.
In group 2 (oleic acid-treated) animals, intra- and extravascular fat vacuoles (with diameters as large as 5 and 20 μm, respectively) were prevalent in all cats (Fig 7). Widening of the perivascular interstitial space and cellular swelling was severe in eight cats that had both types of lesions. Two cats had only type 2 lesions. In one cat, widening of the perivascular space and cellular swelling were mild; in another, they were severe. The mean number of intravascular fat vacuoles in five mesh spaces was 0.2. Fat vacuoles were coarse, inhomogeneous, and small compared with those of group 1, and they were less dark than red blood cells. No defects but numerous pinocytic fat vacuoles were observed on the endothelial walls, in contrast to the findings in group 1 (Fig 8). Extravascular fat vacuoles were larger than the intravascular ones, and some merged together (Fig 9). Sporadic necrotic changes were also noted.

Electron microscopy findings in a type 1 lesion in a cat brain from group 1, which was treated with triolein (original magnification ×5000). The huge intravascular fat vacuole (F) distends the lumen and compresses the endothelial wall. The endothelial wall (arrows) is partly disrupted. Widening of the perivascular interstitial space (asterisks) is mild. Bar indicates 1 μm.
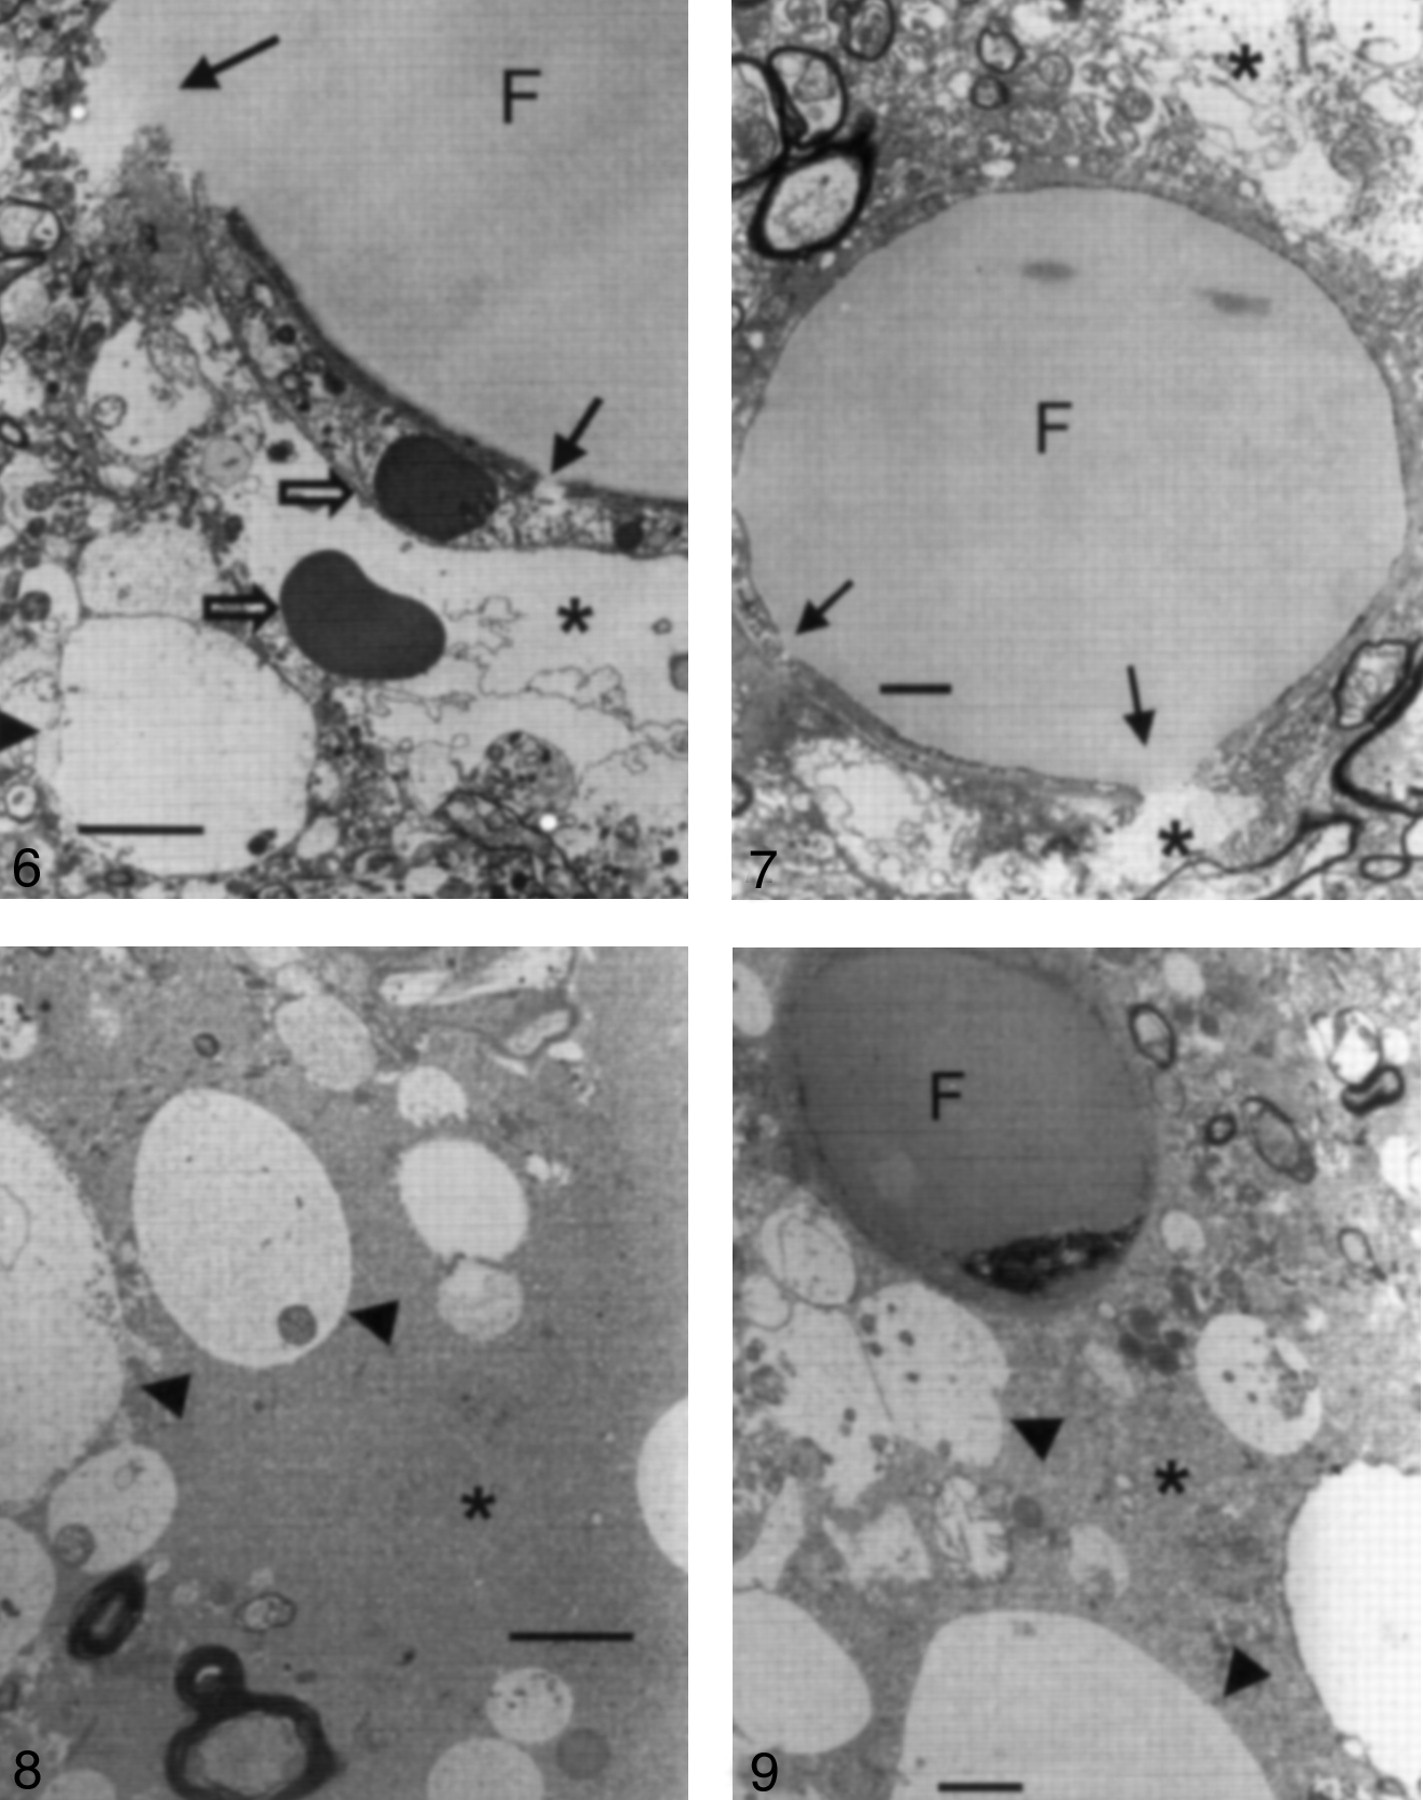
Electron microscopy findings in a type 1 lesion in a cat brain from group 2, which was treated with oleic acid (original magnification ×4000). Neuropil cells (arrowheads) are edematous, and widening of the interstitial space (asterisk) is prominent. Bar indicates 2 μm.

Electron microscopy findings in a type 1 lesion in a cat brains from group 2, which was treated with oleic acid (original magnification ×5000). A 5-μm intravascular fat vacuole (F) is shown. Neuropil swelling (arrowheads) is prominent, and widening of the perivascular interstitial space (asterisk) is also observed. Bar indicates 1 μm.
Discussion
Human fat obtained from the long bones and subcutaneous tissue is almost entirely neutral fat (triglyceride, esters of glycerol, and long chain fatty acids). Unsaturated fatty acids account for 65–80% of the constituent acids. Oleic acid is the most important constituent acid in human fat (7). Free fatty acids are normally produced upon the hydrolysis of triglycerides by lipase in fat deposits. These acids usually bind serum albumin. Consequently, less than 1% of the free fatty acids in the serum exist in the unbound state (8). The general pathophysiology of fat embolism is currently under investigation. To date, tissue damage is believed to be the result of a combination of the mechanical and biochemical effects of fat (4, 8–10). Findings from a number of studies indicate that neutral fat initiates a mechanical block of the arterial circulation when it is introduced intravenously, whereas free fatty acids result in delayed extensive biochemical inflammatory tissue destruction on the second or third day after trauma (8, 11).
The present study revealed two types of MR imaging findings with cerebral fat embolism in both groups. The first, type 1, appears as high signal intensity on T2-weighted images and diffusion-weighted images, as low signal intensity on ADC maps, and as mild enhancement on contrast-enhanced T1-weighted images. The other, type 2, has mildly high signal intensity on T2-weighted images and diffusion-weighted images, isointense signal on ADC maps, and enhancement on contrast-enhanced T1-weighted images (Fig 1). Type 1 resembles findings associated with hyperacute ischemic infarction; that is, high signal intensity on diffusion-weighted images and low signal intensity on ADC maps. The finding of high signal intensity on T2-weighted images and lesional enhancement on contrast-enhanced T1-weighted images in type 1 lesions in the present study differ from the findings in ischemic infarction at the same stage. These discrepancies occur at the subacute stage of ischemic infarction because of the breakdown of the blood-brain barrier (12). However, in cerebral fat embolism, high signal intensity on T2-weighted images and contrast enhancement of the embolized brain substance is observed at the hyperacute stage. This can probably be explained by the early occurrence of the dysfunction of the blood-brain barrier, caused by either the fat itself or the resulting toxicity (2).
Electron microscopic analyses of type 1 lesions reveal widening of the perivascular interstitial space, which represented vasogenic edema, and neuropil cell swelling, which represented cytotoxic edema (13, 14). Those findings are similar to those consistently observed in the present study. Thus, type 1 lesions may contain not only cytotoxic edema but also vasogenic edema. Type 2 lesions had mildly high signal intensity on T2-weighted images and diffusion-weighted images and isointense signal on ADC maps. These findings represent vasogenic edema in the lesion (14). This edema may be due to a breakdown in the blood-brain barrier similar to that in type 1 lesions, because type 2 lesions had contrast enhancement on contrast-enhanced T1-weighted images. Fonte et al (3), Reidbord et al (11), and Shaffer et al (15) report comparable results showing that triolein induces interstitial edema and alterations in the capillary endothelium. The results of Kim et al (2), that is, the early appearance of vasogenic edema and cytotoxic edema, are similar to those of our study. However, the effect of oleic acid was more toxic in this study. The development of two types of lesions in cerebral fat emboli is a new finding that differs from that of Kim et al (2). Vasogenic edema might have a different effect from that of cytotoxic edema in cerebral fat embolism, and this point should be clarified in further studies.
Both triolein and oleic acid are widely used in creating models of fat embolism, especially those in the lung. Considerable evidence shows that oleic acid is more toxic than triolein ( 1, 3–6, 16). Nonesterified oleic acids bind albumin; thus, they are nontoxic (17). However, free fatty acids are highly toxic to all tissues, especially capillaries (3–5, 16–18), because their binding to albumin is prevented by a combination of inadequate mixing and the size of the globule (16). In the present study, high signal intensity on T2-weighted images and contrast enhancement may be a result of endothelial injury due to this mechanism. Endothelial damage to the lung is noted within 1 minute of exposure to oleic acid, and electron microscopy reveals endothelial cell changes in the lung as early as 10 minutes (19) and 1 hour (17) after injury. In our investigation, the T2 hyperintensity of type 1 lesions was significantly more prominent in the oleic acid group than the triolein group. The data from electron microscopy demonstrated that widening of the perivascular interstitial space and cellular swelling was more prominent in the oleic acid group than in the triolein group. Despite the general agreement on the effects of oleic acid on the lung, discrepancies exist in the literature regarding the effects of triolein (6). Nakata et al (1) suggested that triolein does not alter pulmonary physiology. Jones et al (6) proposed that triolein does not increase pulmonary epithelial permeability. By using light microscopy and electron microscopy, Jacobs et al (16) found no substantial changes in the lungs of animals that received intravenously administered triolein. However, in the brain, the blood-brain barrier opens within 15 minutes (20) or 30 minutes (2) after its exposure to triolein. Additionally, in the present study, endothelial damage was observed in the brain within 30 minutes after its exposure to triolein. When the signal intensity ratios in the triolein group and oleic acid group were compared, no significant differences in type 2 lesions were noted on T2-weighted images and ADC maps. Thus, similar to oleic acid, triolein appears to have a toxic effect on the endothelium in the brain.
In the present study, electron microscopic analyses revealed both similarities and differences in groups 1 and 2. Intra- and extravascular fat vacuoles were observed in both groups. However, intravascular fat vacuoles were more common and larger in group 1. Endothelial wall defects were frequent in group 1 animals but not group 2 animals. In the triolein group, defects in the endothelial wall may be have been due to mechanical stretching of the vessel and continuous perfusion pressure from the heart. This explanation is supported by electron microscopic data that showed that vessels containing intravascular fat vacuoles were dilated and that their walls were compressed and thin. These defects were not frequently found in the oleic acid group. The factors contributing to the presence or absence of specific defects in each group were not investigated in this study, and they remain to be elucidated. However, this result may be explained by the contrast-enhanced T1-weighted data. Enhancement on contrast-enhanced T1-weighted images was more prominent in the triolein group than in the oleic acid group. Thus, defects in the endothelial wall may allow the contrast medium to cross the wall more easily. Conversely, the oleic acid group had no defects in the endothelial wall, although dysfunction of the blood-brain barrier was observed. Passage of contrast medium through the wall may have been limited in this group. An extensive future study of this difference would be beneficial in clarifying the factors that contribute to the specific defects.
Numerous tiny pinocytic fat vacuoles were observed on the endothelial wall in group 2. The pinocytic fat vacuoles appeared to traverse the wall. Lipid-soluble agents can traverse the wall through a transcellular lipophilic pathway (21).
Delivery of molecules from the blood into the central nervous system is limited and depends on lipid solubility and the molecular mass and charge (22). The molecular mass of triolein is 885.4, whereas that of oleic acid is 282.5. Accordingly, oleic acid appears to cross the wall more easily than triolein.
The areas with only type 2 lesions in the one cat in group 1 and the two cats in group 2 were examined at electron microscopy. In another cat that had both types of lesions, the type 2 lesions were not evaluated with electron microscopy. This omission is a weakness of the present study. However, the comparison of the effects of triolein and those of oleic acid was the primary purpose of the present study; the comparison of electron microscopy findings in type 1 lesions and type 2 lesions was not. In one cat in group 1 and in one cat in group 2, the areas with type 2 lesions had mild widening of the perivascular interstitial space and mild cellular swelling, as shown at electron microscopy. The other cat of group 2 had severe vasogenic and cytotoxic edema. Because of the limited number of cats with type 2 lesions that were evaluated at electron microscopy, further studies should be performed to analyze the differences between type 1 and type 2 lesions.
In the present investigation, MR imaging data revealed a similar pattern of lesion locations in both groups. The most common site was the posteromedial convexity of the hemisphere. Cortical gray matter was inevitably affected. The ipsilateral white matter was also commonly affected. The ipsilateral deep gray matter and brain stem were additionally affected in both groups. These results suggest that the method of fat embolism induction is fairly reproducible. As in clinical cerebral fat emboli, no consistent lesional location was observed; this finding indicated that the cerebral superficial and deep gray matter, cerebellum, and brain stem could be involved.
To our knowledge, clinical MR imaging findings of hyperacute cerebral fat embolism have not been described previously. A subclinical fat embolism probably occurs after almost all long-bone fractures, but the incidence of the clinically apparent syndrome is reported to be 0.5–10% in cases of fracture (9). The full syndrome develops 12 hours to 3 days after injury and is manifested by respiratory distress, encephalopathy, and cutaneous petechiae (23). The CT and MR imaging findings of clinical cerebral fat embolism syndrome suggest that the lesions are widespread in the gray matter and white matter in the acute phase and that the lesions are confined primarily to the white matter in the subacute phase (23–27).
Conclusion
Cerebral fat embolism induced by triolein and oleic acid resulted in both cytotoxic and vasogenic edema, as depicted at MR imaging and electron microscopy. The effects were more severe in the oleic acid group. These findings imply that both triolein and oleic acid damage the blood-brain barrier and that oleic acid is more toxic to the cat brain.
Footnotes
Presented at the RSNA 86th Annual Meeting and Scientific Assembly in Chicago, IL, 2000.
References
- Received February 1, 2002.
- Accepted after revision May 13, 2002.
- Copyright © American Society of Neuroradiology


