
Abstract
BACKGROUND AND PURPOSE: In contrast to “normal-appearing” white matter (NAWM) in patients with multiple sclerosis (MS), there are subtle, abnormal and diffuse signal intensity changes often seen on T2-weighted MR images, which we have referred to as “dirty-appearing” white matter (DAWM). These areas of DAWM have slightly higher signal intensity than that of NAWM, but lower than that of lesion plaques. Our study was designed to determine the volumetric and magnetization transfer ratio (MTR) features of DAWM in patients with MS.
METHODS: Dual-echo fast spin-echo MR imaging and magnetization transfer imaging were performed in 22 patients with relapsing-remitting MS. Slightly hyperintense DAWM areas were manually outlined on the basis of T2-weighted imaging findings. The volume and MTR of DAWM were calculated and compared with the volume and MTR of NAWM and T2 lesion plaques.
RESULTS: The average volume of DAWM (18.3 mL) was greater than the average volume of T2 lesion plaques (11.0 mL, P = .04), and the mean MTR in DAWM (38.7%) differed significantly (P < .0001) from that in NAWM (40.7%) and plaques (33.3%). There was a modest negative correlation between either mean MTR (r = −0.60; P = .003) of DAWM or peak height (r = −0.50; P = .02) of DAWM with T2 lesion load. Neither DAWM volume nor total T2 abnormality (DAWM + plaques) volume correlates with the Expanded Disability Status Scale.
CONCLUSION: The results of this study indicate that MTR is able to differentiate DAWM from lesion plaques and NAWM and that DAWM might be a different pathologic process of the disease. The notion and quantification of these subtle imaging findings of DAWM areas may improve our understanding of certain stages of disease progression and disease burden in patients with relapsing-remitting MS.
Multiple sclerosis (MS) is a demyelinating, inflammatory disease that is most often associated with multifocal lesions in the central nervous system. Many attempts have made by using MR imaging to assess lesion evolution, correlates with clinical status, and treatment effects in MS. On postmortem studies (1, 2), MS lesions can be divided into three categories: active (acute), chronic active, and chronic inactive. Although for obvious reasons, comparable imaging and pathologic studies are very difficult to establish, the advent of MR imaging has significantly improved our understanding of MS lesions (3). The number of lesions detected on MR images is greater than would be clinically expected (4). On gadolinium-enhanced T1-weighted images, active lesions are demonstrated as enhancing lesions that are associated with intense inflammatory infiltrates and blood-brain barrier disruption in the early phase of lesion formation (5). Chronic lesions exhibit varying degrees of signal intensity, ranging from isointense to markedly hypointense on contrast-enhanced T1-weighted images without enhancement that pathologically tends to represent more severe tissue destruction including gliosis and myelin and axonal loss. These chronic lesions, however, can be reactive or have remyelination at the edge of the lesions (6, 7) during the disease evolution. T2-weighted imaging is very sensitive to tissue abnormalities in human brain, and many histopathologic features in MS are depicted as hyperintense lesions. These often include edema, demyelination and gliosis (8), even remyelination (6), but exclude the discrete tissue damage in “normal-appearing” white matter (NAWM) (9), which can be detected by additional MR techniques such as magnetization transfer (10, 11) and diffusion-weighted imaging (12). The abnormalities in NAWM may in part account for the disappointing correlation between lesion load and clinical activity (3, 13).
Nevertheless, in addition to the lesion plaques and NAWM, there are diffuse abnormal signal intensities often seen in white matter on T2-weighted images in MS patients (14, 15). These subtle, abnormal areas showed patchy and slightly higher signal intensity than that of the surrounding NAWM but lower than that of lesion plaques; we called these diseased tissues “dirty-appearing” white matter (DAWM). Most previous reports that examined the clinical correlates and therapeutic outcome by using T2 lesion load have failed to include DAWM (16–18). This is because the computer-assisted segmentation programs frequently neglected the extent of these DAWM areas because of their subtle appearance. So far, little effort has been made to characterize these abnormal signal intensities appeared on T2-weighted images by using quantitative methods (14, 19).
Because the assessment of DAWM areas may provide more information concerning disease burden and disease progression, we have attempted to characterize DAWM areas by using volumetric MR imaging and magnetization transfer ratio (MTR) histogram in patients with relapsing-remitting MS. We also attempted to explore its quantitative relationship with T2 lesion plaques and NAWM.
Methods
Subjects
Twenty-two patients (16 women and six men; mean age, 35.2 years; age range, 26–48 years) with clinically definite MS with relapsing-remitting disease were studied with dual echo fast spin-echo (FSE, proton density-[PD-] and T2-weighted) and magnetization transfer (MT) imaging on a 1.5-T MR system. The mean disease duration was 4.2 years (range, 0.5–10 years), and the mean Expanded Disability Status Scale (EDSS) score (20) was 2.6 (range, 1–5). These patients were chosen from a cohort of MS patients who had both dual-echo and MT imaging performed and had not received any immunomodulating therapies before entry into this study. The patients were treated only with short courses of steroids, when clinically indicated, for acute exacerbations. All patients gave informed consent after the nature of the procedure had been fully explained. The institutional review board approved the procedure described.
Imaging and Image Processing
A FSE dual-echo pulse sequence was performed with interleaved contiguous 3-mm-thick axial sections (2500/18, 90 [TR/TE1, TE2]; one signal intensity acquired). The echo train length was eight and field of view was 220 × 220 mm with 0.86-mm pixel size. More than 50 sections were obtained for each patient with interleaved three to four acquisitions to cover the entire brain. All segmentation procedures were done by using 3DVIENWIX software (21) on a SunSparc workstation (Sun Microsystems, Mountain View, CA). The segmentation of T2 lesion plaques was based on the theory of fuzzy connectedness by using both PD- and T2-weighted images (22). This method has been validated in several studies and with more than 1,000 data sets (23), although the technique did not pick up the pixels belonging to DAWM, because of the lower contrast between DAWM and NAWM. An experienced neuroradiologist (Y.G) carefully painted the abnormal intensity regions beyond the segmented lesion plaques on the section image display by using the manual painting function of 3DVIEWNIX to create a DAWM mask. A second experienced neuroradiologist (J.H) reviewed the segmented results of DAWM, and a final DAWM mask (Fig 1D) for computation of MTR was generated on the basis of a consensus opinion. Because DAWM usually appears around the ventricules, the similar amount of NAWM areas was also painted and masked to compute MTRs and compare them with those of DAWM.
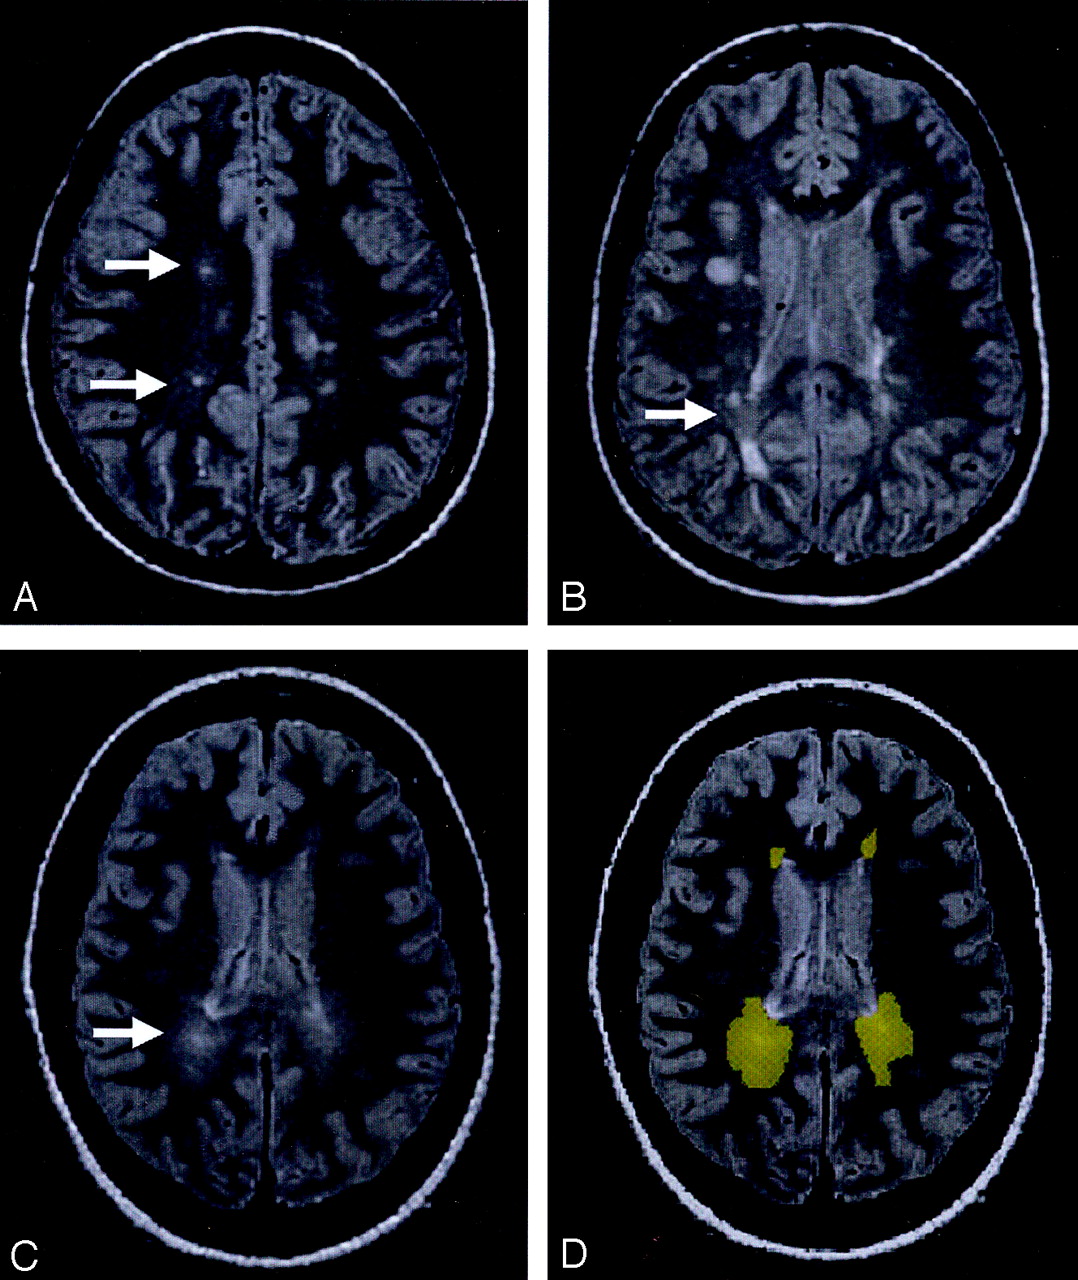
The PD-weighted scan shows DAWM areas, which are typically located in the periventricular and centrum semiovale regions of white matter in MS patients.
A, DAWM with a single plaque.
B, DAWM with several plaques.
C, pure DAWM without plaques visible.
D, outlined DAWM masks from C.
MT imaging was performed by using a 3D gradient-echo sequence modified by the addition of an MT pulse (106/5/12° [TR/TE/flip angle]). The field of view was 220 × 220 mm; the matrix size, 128 × 256; and the section thickness, 5 mm. MT contrast was achieved by applying a saturation pulse, which consisted of a 19-ms sync-shaped radio-frequency pulse during each repetition time. Two consecutive sets of transverse images with and those without the MT saturation pulse were obtained to calculate the MT ratio (MTR) and construct its histogram. Because they have similar signal intensity patterns, after the interpolation of MT images and FSE images, we registered the PD-weighted image with the MT control (unsaturated) image by using a signal intensity correction method (24). This allowed translation and rotation in three dimensions and generated the rigid transformation to the segmented tissue mask to match them with the MT images. Once registered, the MTR was calculated for each voxel in each tissue mask by using the following standard expression: MTR = [(Mo − Ms)/Mo] × 100%, where Mo and Ms represent the signal intensity of the voxel with saturation pulse off and on, respectively. The MTR histographic parameter (mean, median, SD, first and third quartiles, peak location and peak height) was computed for each tissue type (lesion plaques, DAWM, and NAWM) on the basis of their segmented masks. The MTR histogram of each tissue type was then generated, and the peak height was normalized by dividing each histogram frequency value (ie, the total number of voxels with a certain MTR value) by the total number of voxels in the sample. The peak height of the histogram was determined as a measure of the frequency of appearance in the most common MTR value. MTR histogram analysis was performed on the basis of the total T2 lesion plaques, the total DAWM, and a similar volume of NAWM.
Statistical Analysis
Analysis of variance was used to compare NAWM, DAWM, and lesion plaques in terms of each MTR measurements (eg, mean), with tissue type and patient included in the model as fixed treatment and blocking factors, respectively. Because there was no replication of measurements within each patient, the mean square for error was derived from the treatment by patient interaction. For each MTR measurement, pairwise comparisons of the three regions were conducted with P values adjusted for multiple comparisons by using Tukey’s honestly significant difference procedure with a family-wise type I error rate of 5%. Pearson product-moment correlation coefficients were also used to assess the relationship between volume measurements of DAWM and lesion plaques, as well as between volume measurements and MTR histogram statistics.
Results
Most DAWM areas were located in periventricular and centrum semiovale regions. As shown in Figure 1, these DAWM areas can have a single (Fig 1A) or several lesion plaques (Fig 1B) embedded or attached, or have no visible T2 plaques (Fig 1C). The average volume of DAWM (mean ± SD: 18.3 ± 11.4 mL) was greater than that of T2 lesion plaques (mean ± SD: 11.0 ± 10.8 mL), which showed significant difference (P = .04) and indicated the quite extensive and diffuse nature of DAWM; however, the volume of NAWM from selected areas does not represent the total NAWM and therefore is not meaningful for volume comparison with DAWM.
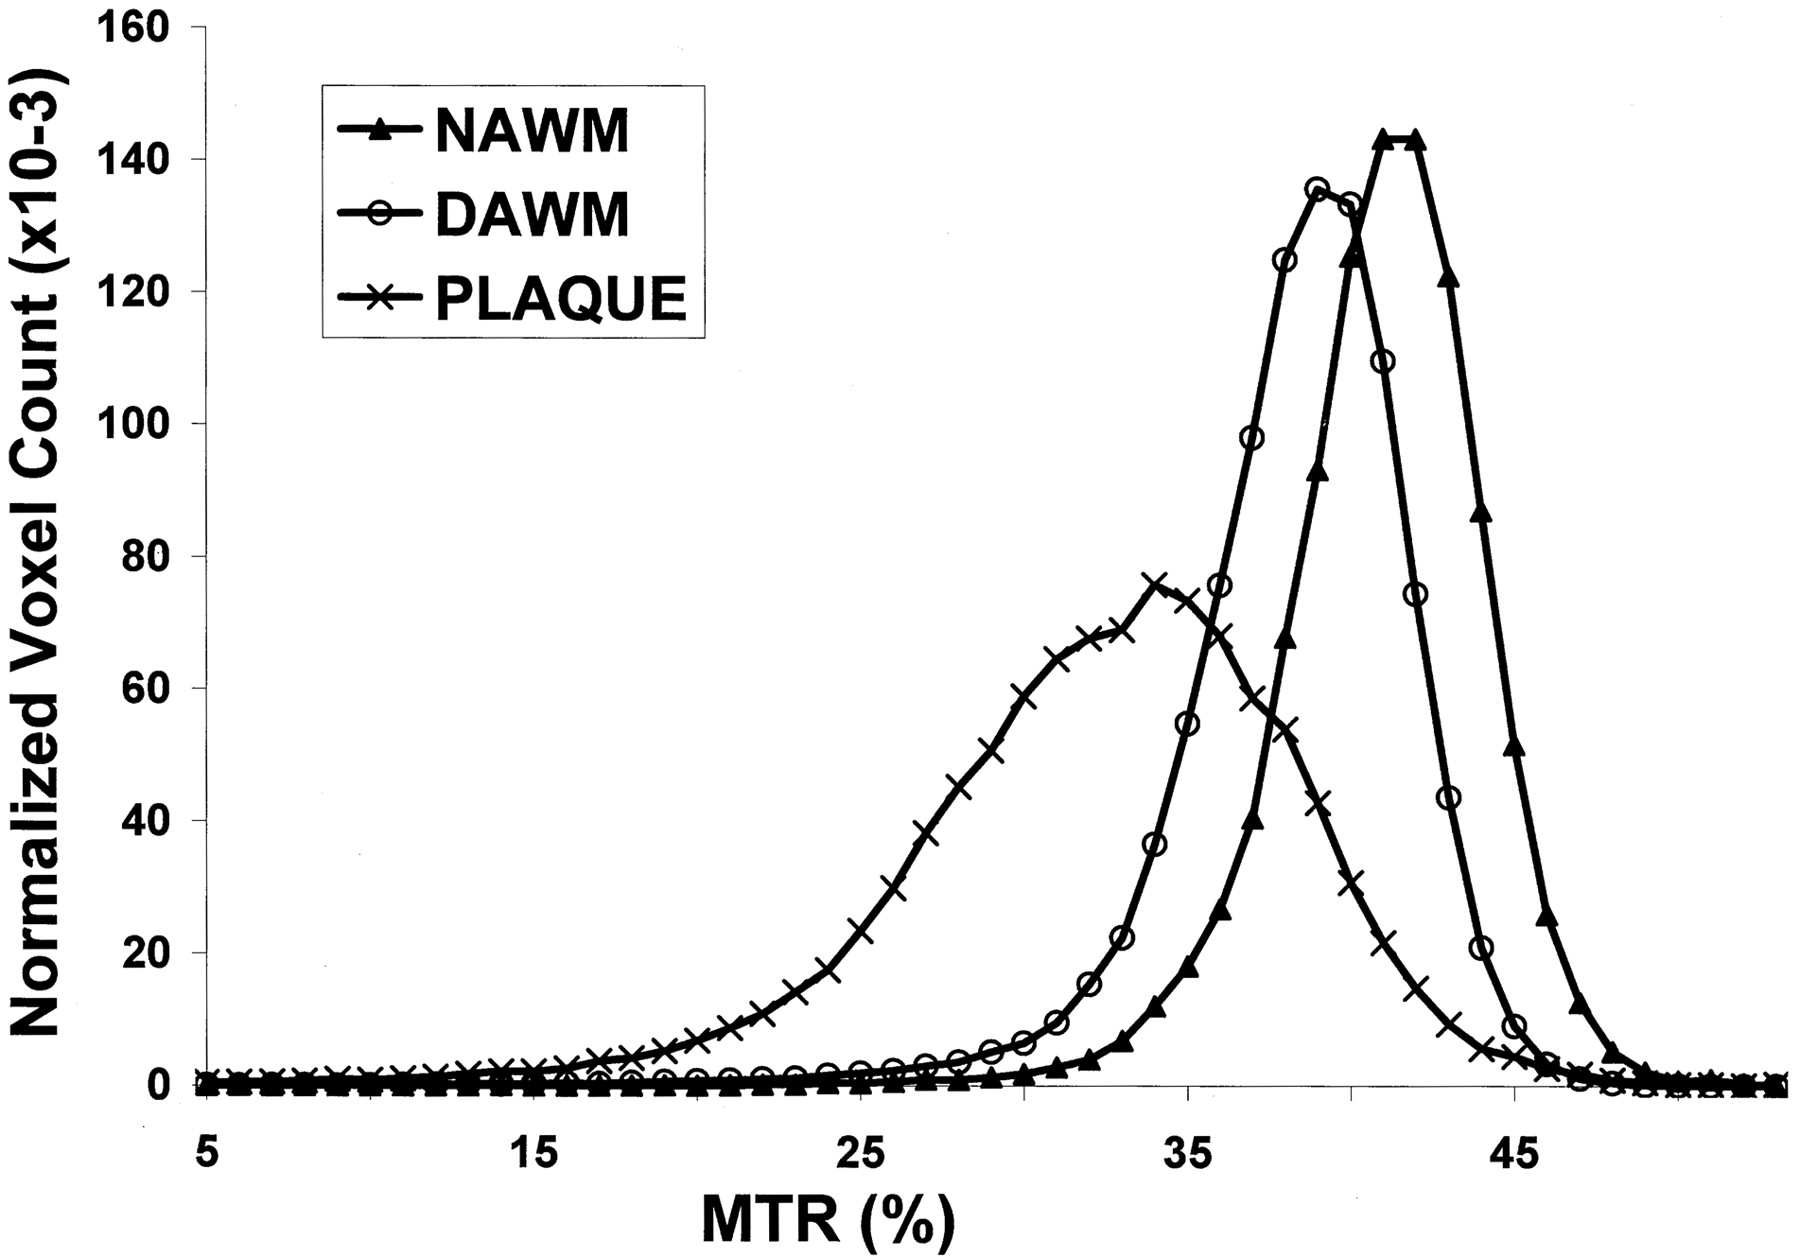
MTRs in T2 lesion plaques were significantly lower than those in both DAWM and NAWM (Table), including normalized peak height, mean, and all integrals of MTR histogram. When DAWM compared with NAWM, each parameter of MTR histogram of DAWM was significantly lower than that of NAWM (P ≤ .01), with the exception of peak height. These findings are consistent with the graded T2 signal intensity changes and indicate that DAWM can be differentiated from NAWM and lesion plaques by using MTR. As shown in Figure 2, the average MTR histogram of DAWM was located between histograms of NAWM and lesion plaques. The normalized histogram peak height was highest in NAWM, followed by DAWM, and lowest in lesion plaques. The differences, however, were greater between DAWM and lesion plaques of both mean MTR and peak height than those between DAWM and NAWM.

The average MTR histograms were generated from NAWM, DAWM, and lesion plaques. Note that the histogram of DAWM was located between the histograms of NAWM and lesion plaques.
Comparison of MTR measurements of three tissues in relapsing-remitting MS patients
Pearson product-moment correlation coefficients were computed to assess the relationship between the volumetric and MTR measurements of DAWM and those from NAWM and lesion plaques. There was no correlation between the volume of DAWM and T2 lesion volume in these patients. We found negative correlations between either mean MTR of DAWM (r = −0.60; P = .003) or peak height of DAWM (r = −0.50; P = .02) with T2 lesion volume, which indicates that the severity of MTR abnormality in DAWM may have some predictive value on T2 lesion volume. We did not, however, find the correlations between DAWM volume and T2 lesion load in these patients. Neither total DAWM volume nor total T2 abnormalities (DAWM volume + plaques volume) correlated with EDSS.
Discussion
This study indicates that DAWMs, which are seen as subtle T2 signal intensity change, may represent different histopathologic abnormalities than either T2 lesion plaques or NAWM, because of their different and abnormal MTRs. These DAWM areas are preferentially located at the periventricular region and are generally not detected by T2 lesion quantification programs, but represent part of the lesion burden and may be associated with the evolution of T2 lesion plaques. Study and quantification of these abnormalities may improve our understanding of certain stages of disease progress in MS patients. The observation of larger volume of such abnormalities compared with that of lesion plaques in this study suggests that DAWM is a common finding in MS.
It has been shown that PD- and T2-weighted imaging are among the most powerful MR imaging tools in differentiating signal intensity characteristics between normal and pathologic tissue, especially those of MS lesion plaques (25). There appears to be a simple linkage between increased relaxation time and tissue water content on T2-weighted images (26, 27). Because MS is a disease that is found throughout the brain, the multifocal lesion plaques that are hallmarks of MS are situated on a background that presumably reflects the combined effects of inflammation and demyelination, in which tissue water content may be changed to a varying degree. However, the slightly increased signal intensity of DAWM on T2-weighted images was frequently neglected by the computerized approach for lesion volume quantitation. This is due to the different signal intensity ranges observed between DAWM and lesion plaques (15). Our results indicate that DAWM is a common finding in MS. They are discrete, visible, and relatively larger than most of the plaques. Because lesion load on T2-weighted images is frequently used as a secondary endpoint to monitor the effects of treatment, it should be recognized that adding or neglecting the volume of DAWM, which is part of disease burden, could have significant different result in terms of lesion load.
It is still not precisely known what underlying process permits the appearance of DAWM on MR images, or what underlying pathologic difference between NAWM and DAWM. In the current study, most DAWM areas have single or several T2 lesion plaques embedded, which suggest that these areas might be involved in the evolution of MS lesions. In the previous MR imaging studies, T1-enhancing lesions were documented as new activity and indicate blood-brain barrier abnormality because of inflammatory changes (5, 28, 29). T2 lesions are seen as a result of increase of water content in tissues that is concurrent with the development of inflammation. Usually T1-enhancing lesions disappear over a period from weeks to months with the restoration of the integrity of blood-brain barrier (30, 31) as a result of reduced inflammatory activity (32). Meanwhile, the increased signal intensity at T2-weighted imaging or T2 lesions shrinks, eventually leaving a much smaller lesion residue (permanent plaques) and a relatively larger area of recovery activity from the prior inflammatory event (33). Our data with the observation of the relatively large areas of DAWM with a single or several plaques embedded or attached may correspond to the later consequence, which is the postinflammatory change from the active to chronic-active lesion period. These DAWM areas are usually round, with slightly higher signal intensity in the center and faded signal intensity at the margin.
DAWM may also represent the development of inflammation or preactive lesion formation (8). This may be especially true for those DAWM areas without lesion plaques embedded (Fig 1C). On the basis of MT imaging, there has been a notion that lower MTRs in NAWM may precede fresh lesions or may be in step with a new demyelinating process distinct from focal lesions (34–37). We found that both mean and peak height of DAWM MTR histogram had modest correlations with T2 lesion plaque volume (r = −0.60 and r = −0.50, respectively). It is possible that the focal areas with abnormal and declining MTR in NAWM developed firstly into pure DAWM areas without plaques (Fig 1C) and then to the areas with newly formed plaque inside (Fig 1A). On postmortem studies, another pathologic presence that is remyelination, appearing as “shadow” plaques (38), can also occur as extensive areas in white matter in some patients; however, the relatively larger areas of DAWM seem less likely to be remyelination because remyelination usually appears as a narrow zone (6, 39).
Ropele et al (14) investigated six DAWM areas in nine patients by using several parameters generated from MT imaging, including MTR. Contrary to our results, they did not find significant differences of MTR between NAWM and DAWM in MS patients, although the MTR was significantly reduced in DAWM when compared with the MTR of normal control white matter. One possible reason for this discrepancy could be the very different number of DAWM areas and patients analyzed in the two studies. Our results showed significant difference of MTR mean, but not peak height, between DAWM and NAWM based on a greater amount of DAWM by using volumetric histogram analysis. Because inflammatory edema may have less MTR changes than demyelination (40, 41) and the lower MTR may correspond to more severe tissue damage (42, 43), we believe the extent of abnormality in DAWM is more obvious than that in NAWM. This is evidenced by significantly a left-shifted MTR histogram of DAWM compared with that of NAWM (Fig 2). These abnormalities in DAWM may include both inflammatory edema and demyelination; however, typical T2 lesion plaques are sharply demarcated and have more demyelinating than inflammatory changes. In addition, because MTR histogram peak height was suggested as an indicator of the residual amount of normal tissue in a given part of brain (44), failure to show significant difference of normalized peak height between DAWM and NAWM may indicate the affected amount of tissue in two tissue types were similar, but severity of tissue destruction were different as reflected by their different mean MTRs.
In light of the significant difference of MTR between DAWM and NAWM and between DAWM and T2 plaques, this study suggests that DAWM is another pathologic substrate, which may represent certain stage of the lesion development or resolution and can be distinguished from the established lesion plaques and NAWM. One limitation of this study is lack of longitudinal data. Thus, the question of what has contributed to DAWM pathologically and how these areas progress needs further work from autopsy in these areas or longitudinal imaging study. The previously described ability of serial MT imaging to monitor either disease progression in NAWM during the lesion formation (34–37) or acute damage of lesions to normal (45, 46) may have the potential to identify pathologic specificity of this tissue. Nonetheless, the notion and quantitation of DAWM in this study may add new information of imaging pattern in the lesion evolution, which is a major consideration for MR imaging application in MS study.
There were no correlations between DAWM volume and T2 lesion volume, which can be accounted for by assuming that T2 lesion plaques more likely reflecting permanent “footprints” and DAWM more likely represent an “ongoing” stage from inflammation to either progressive demyelination or recovery; however, the modest negative correlations between DAWM MTRs and T2 lesion volume perhaps can be explained by the facts that only those DAWM areas with more severe reduced MTR will eventually develop into lesion plaques. The poor correlation between EDSS and DAWM volume or even the total volume of DAWM and plaques was not totally unexpected. As discussed elsewhere (47), this may be due to the lack of pathologic specificity of T2 abnormalities and the failure to take account of location of lesion and part of abnormality in NAWM. In addition, the clinical outcome measured by EDSS has also been criticized for its noninterval scaling, heavy weighting on ambulation status, and absence of adequate cognitive and visual components (48).
Conclusion
In this study, DAWM showed significantly lower MTRs than NAWM, but higher than lesion plaques, which indicates there might be a different injured tissue type in MS that is involved in lesion evolution during the disease progression. These DAWM areas may represent either prelesional change with progression of demyelination or postlesional change with reduction of inflammation and are more likely an “ongoing” process. Attention to this subtle tissue on imaging may provide additional information about disease burden and lesion evolution and ultimately be needed to achieve optimal interpretation regarding pathologic specificity in future studies.
Footnotes
Supported in part by grant NS 29029, NS 39135 from National Institute of Health.
References
- Received January 31, 2003.
- Accepted after revision May 13, 2003.
- Copyright © American Society of Neuroradiology
In this issue


Jump to section
Related Articles
Cited By...
- Quantitative magnetisation transfer imaging in relapsing-remitting multiple sclerosis: a systematic review and meta-analysis
- Automated Separation of Diffusely Abnormal White Matter from Focal White Matter Lesions on MRI in Multiple Sclerosis
- Imaging Differences between Neuromyelitis Optica Spectrum Disorders and Multiple Sclerosis: A Multi-Institutional Study in Japan
- Morphologic, Distributional, Volumetric, and Intensity Characterization of Periventricular Hyperintensities
- Incidental Periventricular White Matter Hyperintensities Revisited: What Detailed Morphologic Image Analyses Can Tell Us
- Dirty-Appearing White Matter: A Disregarded Entity in Multiple Sclerosis
- Diffusely Abnormal White Matter in Progressive Multiple Sclerosis: In Vivo Quantitative MR Imaging Characterization and Comparison between Disease Types
- 3D MRI in multiple sclerosis: a study of three sequences at 3 T