
Abstract
BACKGROUND AND PURPOSE: A significant proportion of patients with lacunar infarctions experience neurologic deterioration after onset. However, no clinical examination has been established for prediction of the progress of symptoms. To determine the hemodynamic predictors of such progression, we performed perfusion CT to quantitatively assess cerebral blood flow (CBF), cerebral blood volume (CBV), and mean transit time (MTT) of patients with lacunar infarctions in the territory of the lenticulostriate artery.
METHODS: We performed MR imaging and perfusion CT of 26 patients with lacunar infarction within 24 hr after onset. On the CBF map on perfusion CT scans, a round small region of interest was set at the region, with decreased CBF in the territory of the lenticulostriate artery (region of interest 1). Another region of interest was set in the mirror position to region of interest 1 in the contralateral hemisphere (region of interest 2). Using these two regions of interest, CBF, CBV, and MTT were measured. All patients underwent neurologic and MR imaging follow-up while receiving equivalent medical treatment.
RESULTS: Neurologic deterioration after onset was shown in 13 patients (progress group), whereas no neurologic deterioration was shown in the other 13 patients (control group). In the progress group, lacunar infarctions were enlarged on follow-up MR images. The ratio of region of interest 1/region of interest 2 showed significantly lower CBF and higher MTT in the progress group than in the control group.
CONCLUSIONS: These results suggest that progressive lacunar infarction in the territory of the lenticulostriate artery could be predicted with a higher MTT ratio (>1.26) and a lower CBF ratio (<0.76) on perfusion CT scans obtained within 24 hr after onset.
Lacunar infarction is commonly considered to be the clinical category that includes the small lesions that result from involvement of deep, small, penetrating arteries (1). Because these perforating arteries have poor collateral connections, they are called end arteries, and their obstruction results in a limited area of infarction. Lacunar infarction is commonly located within the internal capsule, striatum, or thalamus and is presumed to be a single perforator artery territory infarction (2). Although neurologic deterioration in patients with lacunar infarction has been reported in a significant proportion of these patients (27−62%) (3–5), the mechanism of the deterioration remains unclear. No predictors using perfusion evaluation for the occurrence of such deterioration have been reported.
Hemodynamic information from patients with occlusive disease of the major cerebral arteries, such as the middle cerebral artery or internal carotid artery, is useful in predicting their clinical course after onset of an ischemic event (6–15). Various modalities, such as single photon emission CT, positron emission tomography, perfusion MR imaging, and perfusion CT, have been used for hemodynamic investigation. Of these modalities, perfusion CT has the highest performance in spatial resolution (9–13, 16, 17). However, in cases of lacunar infarction, no perfusion evaluations have been reported that can predict the progress of the symptoms. Therefore, in patients with lacunar infarction in the territory of the lenticulostriate artery, we performed perfusion CT within 24 hr after onset. To determine the hemodynamic predictors of neurologic deterioration, we analyzed the cerebral blood flow (CBF), cerebral blood volume (CBV), and mean transit time (MTT).
Methods
Clinical Materials
From April 2000 to December 2002, we dealt with 180 patients with acute cerebral infarction who had perfusion CT performed within 24 hr after ictus. All patients were first evaluated neurologically with the National Institute of Health Stroke Scale (NIHSS) (18) at admission and then routinely underwent MR imaging. Among these 180 patients, 26 had high signal intensity areas in the territory of the lenticulostriate artery on fluid-attenuated inversion recovery (FLAIR) and diffusion-weighted MR images. These patients underwent perfusion CT as their next examination.
Baseline examinations included medical history, physical examination, routine blood biochemistry, blood count, ECG, and radiography of the chest. Patient characteristics, including age, sex, cigarette smoking, antiplatelet therapy, and medical history of hypertension, diabetes, hypercholesterolemia, diagnosed coronary heart disease, and previous cerebral disease, were recorded.
NIHSS scores were assessed at admission, at 3, 6, 12, and 24 hr after onset, and then every 24 hr for 7 days. Among these 26 patients, neurologic deterioration >3 points on the NIHSS within 7 days after onset was shown in 13; these 13 comprised the progress group (seven men and six women; mean age, 70.1 ± 7.4 years; age range, 56−79 years). The other 13 patients did not experience neurologic deterioration within 7 days and comprised the control group (seven men and three women; mean age, 69.5 ± 7.8 years; age range, 56−82 years).
The patients in both groups received equivalent medical treatments, including sodium ozagrel, 160 mg/day for 14 days, and low molecular weight dextran, 500 mL/day for 7 days. These treatments were started within 6 hr after admission.
To assess the degree of major artery occlusive disease, we performed MR angiography on the 7th day after onset (all 26 cases), 3D CT angiography immediately after perfusion CT (six cases in the progress group and five cases in the control group), or digital subtraction angiography within 7 days after onset (three cases in the progress group and three cases in the control group). No patients were found to have occlusive disease of the internal carotid artery or the middle cerebral artery.
MR Imaging
All MR images were obtained by using a 1.0-T MR imaging unit (EPIOS; Shimadzu Co., Kyoto, Japan). The primary MR images, including diffusion-weighted and FLAIR images, were obtained 3 hr after onset. Diffusion-weighted imaging was used to detect new ischemic lesions, and FLAIR imaging was used to measure the sizes of the high signal intensity areas. These measurements were obtained by using a workstation (Pegasus viewer; Zio Software, Inc., Tokyo, Japan).
Diffusion-weighted images were obtained with a single shot spin-echo sequence: 4739/155 (TR/TE); b values, 1000 s/mm2; section thickness, 8 mm; intersection gap, 2 mm; field of view, 180 mm; and matrix, 64 × 128. FLAIR images were obtained with a fast spin-echo sequence: 6200/110; inversion time, 1700 ms; section thickness, 8 mm; intersection gap, 2 mm; field of view, 200 mm; and matrix, 160 × 256. Follow-up MR imaging studies, including T2-weighted MR imaging and MR angiography, were conducted on the 7th day after onset. T2-weighted MR images were obtained with a fast spin-echo sequence: 3500/110; section thickness, 8 mm; intersection gap, 2 mm; field of view, 200 mm; and matrix, 160 × 256.
Perfusion CT
Perfusion CT was performed just after the primary MR imaging examination by using a single detector CT (High-Speed Advantage; GE Medical Systems, Milwaukee, WI). The time from onset to perfusion CT ranged from 3 to 24 hr (average, 10.0 ± 7.5 hr). Twenty dynamic conventional scans were obtained at a plane 50 mm above the orbitomeatal orientation, which covered the basal ganglia, the thalamus, and parts of the anterior, middle, and posterior cerebral arterial territories, after power injection of a bolus injection of 30 mL of nonionic contrast agent (Iomeprol 350; Eisai Co., Ltd., Tokyo, Japan) at a rate of 8 mL/s from the antecubital vein. Total acquisition time was 60 s. A region of interest was placed on the superior sagittal sinus to evaluate the time-attenuation curve. Perfusion CT was performed at 280 mkA and 120 kV, with a 10-mm section thickness, a 210-mm field of view, and a 512 × 512 matrix. Post-processing was performed on a workstation (AZ-7000; Anzai Co. Ltd., Chiba, Japan). Images were auto-segmented to separate the brain from the skull and ventricles. The MTT map was calculated by integrating the first-pass time attenuation curve that was converted by gamma fitting. The CBF and CBV maps were calculated by using a noninvasively determined venous input function and were analyzed with a maximum slope according to the central volume principle (12, 19, 20).
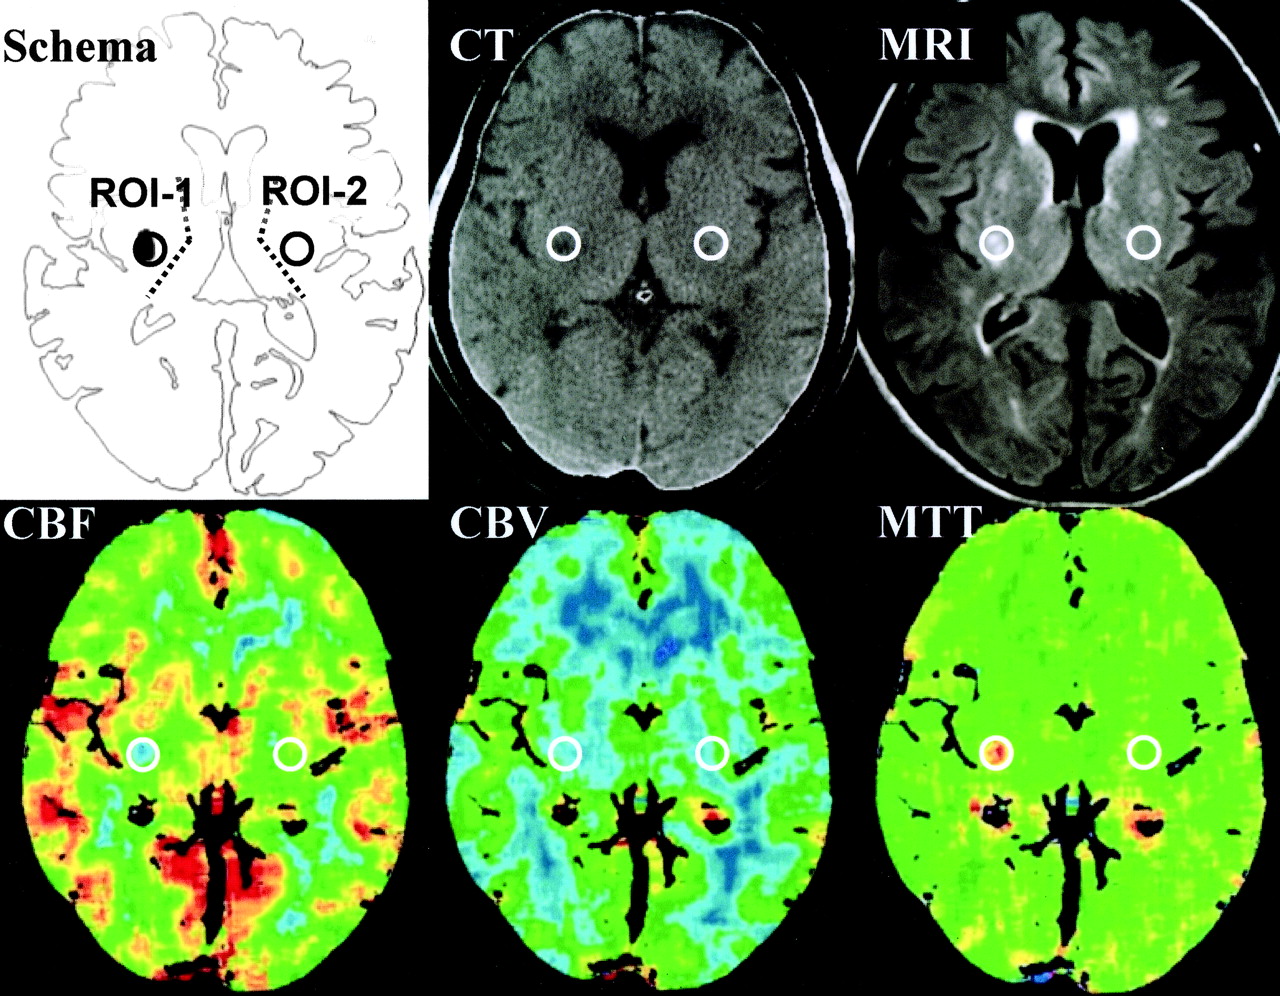
On the CBF map on perfusion CT scans, a small round region of interest, 256 pixels in a circle with a 7.2-mm diameter, was set at the region with including the center of the ischemic core decreased CBF in the territory of the lenticulostriate artery, which were just lateral to the posterior limb of the internal capsule and the surrounding area (region of interest 1). The region of interest was referred to the high signal intensity areas on the FLAIR images obtained at admission. On the workstation, another region of interest was stereotactically set in the mirror position to region of interest 1 in the contralateral hemisphere (region of interest 2). Using these two regions of interest, CBF, CBV, and MTT were measured (Fig 1).

Setting of regions of interest and representative images of CBF, CBV, and MTT. On the CBF map on perfusion CT scans, a round small region of interest was set at the region with decreased CBF in the territory of the lenticulostriate artery (region of interest 1 [ROI-1]). Another region of interest was set in the mirror position to region of interest 1 in the contralateral hemisphere (region of interest 2 [ROI-2]). Using these two regions of interest, CBF, CBV, and MTT were measured. MRI, MR image.
Statistical Analysis
Statistical analysis was conducted by using a computer with StatView software version 5.0 (Abacus Concepts, Berkeley, CA). Logistic regression analysis determined the clinical variables. The following clinical variables were included in various regression models: age, sex, cigarette smoking, antiplatelet therapy, NIHSS score at admission, and medical history of hypertension, diabetes, hypercholesterolemia, diagnosed coronary heart disease, previous cerebral disease, infarction sizes shown on MR images, and time from onset to perfusion CT.
We compared the values of CBF, CBV, and MTT of the lacunar infarction (region of interest 1) with those from the contralateral hemisphere (region of interest 2). Because data obtained by perfusion CT was a relative fixed quantity, we calculated the region of interest 1/ region of interest 2 ratios for CBF, CBV, and MTT (eg, CBF ratio = CBF value on region of interest 1/CBF value on region of interest 2). The differences between the two groups in the values and the ratios of CBF, CBV, and MTT were analyzed statistically by using the unpaired Student’s t test. Statistical significance was set at P < .05.
Results
Patient Characteristics and Clinical Course
No significant differences were observed between the two groups in relation to the baseline characteristics of the patients at admission, the time from onset to perfusion CT, and the NIHSS score at admission (Table 1). In the progress group, nine patients experienced neurologic deterioration within 48 hr after admission and the other four patients experienced neurologic deterioration between 48 hr and 1 week. The average time to progression was 40.2 ± 37.3 hr. In the control group, none of the patients experienced neurologic deterioration.
Characteristics of patients at admission
Infarction Size on Initial and Follow-up MR Images
Infarction sizes were measured on initial FLAIR images and on follow-up T2-weighted MR images by using a workstation (Table 2). In the progress group, the mean infarction size was 48.7 ± 21.0 mm2 on the initial FLAIR images and 78.3 ± 34.3 mm2 on the follow-up T2-weighted MR images. In the control group, the infarction size was 50.8 ± 21.7 mm2 on the initial MR images and 53.5 ± 21.4 mm2 on the follow-up MR images. A statistically significant difference was shown between the two groups in infarction size on follow-up MR images (P = .037) but not in infarction size on initial MR images (P = .814) (Fig 2).

Changes of infarction size on MR images (MRI). Infarction sizes were measured on initial FLAIR images and follow-up T2-weighted MR images. Significant difference was shown between the two groups in infarction size on follow-up MR images (P = .037) but not on initial MR images (P = .814). n.s., not significant.
Summary of infarction size, values, and ratios of cerebral blood flow, cerebral blood volume, and mean transit time
Values of CBF, CBV, and MTT in Region of Interest 1
The CBF, CBV, and MTT of the regions of interest were measured in all patients (Table 2). In the progress group, the mean values of region of interest 1 were as follows: CBF, 19.6 ± 9.0 mL/100 g/min; CBV, 4.8 ± 1.9 mL/100 g; and MTT, 14.5 ± 3.5 s. In the control group, the values were as follows: CBF, 26.1 ± 7.0 mL/100 g/min; CBV, 4.3 ± 0.9 mL/100 g; and MTT, 10.0 ± 1.3 s. A statistically significant difference was shown in the MTT value between the two groups (P < .001), but no difference was observed in the CBF value (P = .052) or the CBV value (P = .349) (Fig 3).

Comparison of CBF, CBV, and MTT in control and progress groups. Significant difference was shown in MTT value between the two groups (P < .001) but not in CBF value (P = .052) or CBV value (P = .349) in region of interest 1. Significant differences were shown between the two groups in CBF ratio (P = .016) and MTT ratio (P < .001) but not in CBV ratio (P = .695). n.s., not significant.
Ratios of CBF, CBV, and MTT
CBF, CBV, and MTT ratios were calculated for all patients (Table 2). In the progress group, the mean ratios were as follows: CBF, 0.64 ± 0.21; CBV, 1.03 ± 0.26; and MTT, 1.47 ± 0.39. In the control group, these ratios were as follows: CBF, 0.87 ± 0.10; CBV, 0.99 ± 0.20; and MTT, 1.07 ± 0.08. Statistically significant differences were shown between the two groups in the CBF ratio (P = .016) and the MTT ratio (P < .001) but not in the CBV ratio (P = .695) (Fig 3). Thus, the progress group had a significantly lower CBF ratio and a higher MTT ratio than did the control group.
Relationships between CBF and MTT Ratios
Figure 4 shows the relationship between the CBF ratio and the MTT ratio for both groups. The cutoff lines at 0.76 in the CBF ratio and at 1.26 in the MTT ratio delineate eight patients with both a higher MTT ratio (>1.26) and a lower CBF ratio (<0.76) who were all in the progress group. Furthermore, 10 of 13 patients in the progress group and one of 13 patients in the control group showed a lower CBF ratio (<0.76) and/or a higher MTT ratio (>1.26). When using the cutoff values, the sensitivity was 76.3% and the specificity was 92.3%, with a positive predictive value of 90.9% and a negative predictive value of 80.8%. These results suggest that on perfusion CT scans, a progressing stroke shown in the territory of the lenticulostriate artery could be predicted by a higher MTT ratio (>1.26) and a lower CBF ratio (<0.76).

Relationships between CBF and MTT ratio. With cutoff lines at <0.76 in the CBF ratio and at >1.26 in the MTT ratio, sensitivity was 76.3%, specificity was 92.3%, positive predictive value was 90.9%, and negative predictive value was 80.8%.
Discussion
In this study of lacunar infarction in the territory of the lenticulostriate artery, CBF, MTT, and CBV were calculated in the affected territory on perfusion CT scans obtained within 24 hr after onset. In the region of interest, the CBF decreased and the MTT increased more prominently in the progress group. When the ratios of the CBF, MTT, and CBV were calculated by dividing the value with the value of the region of interest on the contralateral side, a significantly lower CBF ratio and a higher MTT ratio were obtained in the progress group. These results suggest that the progression of ischemic symptoms in the territory of the lenticulostriate artery could be predicted by higher MTT and/or lower CBF ratios on perfusion CT scans obtained within 24 hr after onset.
Neurologic Deterioration in Cases of Lacunar Infarction
Progressive neurologic deterioration in patients with lacunar infarction has been reported by several investigators (3–5). Mohr et al (3) reported that progress or fluctuation of symptoms was seen in 62% of their 131 patients with lacunar infarction. Nakamura et al (4) also reported that 25 (27%) of 92 patients with supratentorial lacunar infarctions experienced deficit progression. The progression of deficits was associated with poor functional outcome. Several studies reported potential predictors of worsening in lacunar stroke, such as larger infarct volume (21), older patient age (22), and hypertension (23). However, no perfusion evaluation has been reported that predicts the progression of symptoms in cases of lacunar infarction.
Advantages of Perfusion CT
Several examinations, such as single photon emission CT, positron emission tomography, perfusion MR imaging, and perfusion CT, have been used for hemodynamic investigations in these patients. Of these modalities, perfusion CT and perfusion MR imaging have a great advantage in that they can provide conventional images (CT scans or MR images), angiograms (3D CT angiography or MR angiography), and perfusion information simultaneously. Therefore, perfusion CT or perfusion MR imaging is considered to be useful as a primary investigation for patients suspected of having an ischemic stroke.
Perfusion CT can provide CBF, CBV, and MTT (9–13, 16, 17). Recently, it was reported that similar parameters could be theoretically calculated by using perfusion MR imaging (8, 14, 15, 24–26). Wintermark et al (24) reported that a significant correlation was observed between the ischemic lesion on perfusion CT scans and the abnormality on the MTT map on perfusion MR images (r = 0.946, P < .001) in the patient with an middle cerebral artery occlusion. They also reported that there was an excellent correlation (r2 = 0.79) between the CBF maps from stable xenon CT and perfusion CT studies of healthy cerebral regions (17).
When compared with perfusion MR imaging, perfusion CT has several advantages: shorter examination time, availability on conventional CT unit, and better matrix (perfusion CT, 512 × 512; perfusion MR imaging, 128 × 128 or 256 × 256 matrix). Of these, the greatest advantage of CT is the higher performance with spatial resolution. A combination of diffusion-weighted, FLAIR, and perfusion MR imaging theoretically would be the best evaluation method. However, the resolution of perfusion MR imaging is not enough to evaluate lacunar infarction in the territory of the lenticulostriate artery. Therefore, we have selected to combine perfusion CT and MR imaging.
Although perfusion CT by a single detector was limited to provide only one section, four sections can be obtained when a multi-detector CT unit is used (9–13, 16, 17). CBF shown by perfusion CT can be calculated as the maximum change of tracer concentration. It is important to use bolus techniques, which produce arterial peak times as short as possible.
Hemodynamic Status in Lacunar Infarction
In patients with lacunar infarction in the lenticulostriate artery territory, we performed perfusion CT within 24 hr after onset to evaluate the hemodynamic condition. To determine the predictors for neurologic deterioration, we compared the CBF, CBV, and MTT values between the progress and control groups.
We set the region of interest of perfusion CT at the region with decreased CBF in the territory of the lenticulostriate artery (region of interest 1). Klotz and Konig (20) reported that perfusion images have a spatial resolution of 5 to 10 mm when using phantom measurements and simulations. We fixed the region of interest to a size of 256 pixels in a circle 7.2 mm in diameter. Region of interest 1 included the center of the ischemic core and the surrounding area, because most ischemic areas are ovals. Another region of interest was set in mirror position to region of interest 1 in the contralateral hemisphere (region of interest 2). In region of interest 1, the mean CBF decreased and the mean MTT was prolonged in the progress group as compared with the control group. Moreover, by using the affected to contralateral ratios of the parameters (region of interest 1/region of interest 2), the decrease in the CBF and the prolongation in the MTT were significantly greater in the progress group (CBF ratio, P = .016; MTT ratio, P < .001).
These results indicated that CBF was decreased but remained in the lacunar infarctions and that the hemodynamic impairment (decreased CBF and prolonged MTT) was more severe in the progress group than in the control group. CBF in a case of lacunar infarction may be maintained through microcirculation from the surrounding area being perfused via the neighboring lenticulostriate arteries. Therefore, severe hemodynamic impairment occurring in association with lacunar infarction may indicate that such microcirculation from the surrounding area is poor. In the progress group, the lacunar infarctions extended beyond region of interest 1. Although we examined the hemodynamics of the lacunar infarction at admission (in the lacunar core), the severity of the hemodynamic insufficiency in the lacunar core may correlate with and reflect the hemodynamic insufficiency in the area surrounding the lacunar infarction. This hypothesis was supported by the infarction size data on the follow-up MR images. Infarction sizes were measured on initial FLAIR images and on follow-up T2-weighted MR images. A statistically significant difference in infarction size was shown between the two groups on follow-up T2-weighted MR images but not on initial FLAIR images. We routinely perform T2-weighted MR imaging as part of the follow-up study. We measured and compared the infarction size between T2-weighted and FLAIR images from the same four cases in both the progress and control groups. No significant difference in size of infarction was shown between the two types of images. Ricci et al (27) reported that although FLAIR imaging identified more infarcts than did T2-weighted imaging, the difference was not statistically significant during the 10 days after cerebral infarction.
Prediction of Progressive Neurologic Deterioration in Lacunar Infarction
Perfusion evaluations have been performed to detect ischemic lesions caused by stenosis or occlusion of the middle cerebral artery and internal carotid artery (8–15). Previous studies used MTT to identify the ischemic penumbra (16, 25).
Using perfusion MR imaging, Rohl et al (8) found that the penumbra progressed to infarction because of a stenosis and/or occlusion of the middle cerebral artery and/or internal carotid artery at the following cutoff values: rCBF < 0.59 and MTT > 1.63. The initial CBV did not differ between the area of the penumbra and the area that progressed to infarction. Similarly, the present study showed a significant difference in both the CBF ratio and the MTT ratio, but not in the CBV ratio, between the progress and control groups. Although the mechanism of hemodynamic compensation may be different between major artery diseases and lacunar infarctions, we propose that cutoff lines for the CBF and MTT ratios could be used to predict progressive lacunar infarction. When the cutoff lines were set at 0.76 for the CBF ratio and at 1.26 for the MTT ratio, we obtained a sensitivity of 76.3%, a specificity of 92.3%, a positive predictive value of 90.9%, and a negative predictive value of 80.8% in distinguishing the progress group from the control group. These results indicated that the hemodynamic parameters (a higher MTT ratio [>1.26] and a lower CBF ratio [<0.76]) obtained from the region with decreased CBF in the territory of the lenticulostriate artery on the perfusion CT scans obtained within 24 hr after onset may be predictors for neurologic deterioration in patients with lacunar infarction.
Conclusion
We showed that progressive neurologic deterioration and enlargement of lacunar infarctions in the territory of the lenticulostriate artery could be predicted by a higher MTT ratio (>1.26) and a lower CBF ratio (<0.76) on perfusion CT scans obtained within 24 hr after onset of symptoms. It is likely that if the collateral blood flow via the microcirculation coming from the neighboring lenticulostriate arteries is insufficient, the surrounding area of the initial lacunar infarction progresses to infarction, resulting in neurologic deterioration. The hemodynamic status of the initial lacunar infarction (lacunar core) may correlate with and reflect the hemodynamic status in the surrounding area of the lacunar infarction. Further examinations, including perfusion CT and a better understanding of the mechanisms of lacunar infarct progression, may lead to better treatment and better clinical outcomes for patients with lacunar infarctions.
References
- Received April 10, 2003.
- Accepted after revision August 26, 2003.
- Copyright © American Society of Neuroradiology
In this issue


Jump to section
Related Articles
Cited By...
- Early Neurologic Deterioration in Lacunar Stroke: Clinical and Imaging Predictors and Association With Long-term Outcome
- Lacunar stroke: mechanisms and therapeutic implications
- Perfusion Deficits and Mismatch in Patients with Acute Lacunar Infarcts Studied with Whole-Brain CT Perfusion
- Multimodal CT Provides Improved Performance for Lacunar Infarct Detection
- Neuroimaging Markers for Early Neurologic Deterioration in Single Small Subcortical Infarction
- CT perfusion improves diagnostic accuracy and confidence in acute ischaemic stroke