
Abstract
Summary: We introduce a method for combining fiber tracking from diffusion-tensor (DT) imaging with cortical gray matter parcellation from structural high-spatial-resolution 3D spoiled gradient-recalled acquisition in the steady state images. We applied this method to a tumor case to determine the impact of the tumor on white matter architecture. We conclude that this new method for combining structural and DT imaging data is useful for understanding cortical connectivity and the localization of fiber tracts and their relationship with cortical anatomy and brain abnormalities.
Diffusion tensor (DT) imaging (1) makes possible the visualization and appreciation of white matter tracts in the brain and provides important information about brain connectivity. DT images, however, provide less accuracy and lower resolution than do structural images. Accordingly, combining information from gray matter parcellation from high-spatial-resolution structural MR imaging with DT-MR imaging fiber tracking (2,3) has the potential of providing more information about brain structure and the identification of fiber bundles. Herein we introduce a method for combining information from white matter fiber bundles with cortical gray matter parcellation to demonstrate how anatomic structures of gray matter can be used for localizing and following the white matter fiber bundles; how we can visualize white matter in combination with structural gray matter; and how this combination of methods can be used for clinical applications, such as for evaluating a tumor case.
Description of the Techniques
Subjects and Data Acquisition
Data from a 28-year-old right-handed healthy male subject and a 25-year-old left-handed male patient with a tumor were used to demonstrate the method. Both subjects gave informed consent. The images of the patient have been presented in a previous study (4); the diagnosis of a ganglioglioma was established histopathologically. The patient was left-handed and presented with slight incoordination as well as weakness in the left hand, which made it impossible for him to write.
MR images were obtained with a quadrature head coil on 1.5-T (for the patient) and 3-T (for the healthy subject) GE Echospeed systems (General Electric Medical Systems, Milwaukee, WI), which permit maximum gradient amplitudes of 40 mT/m. Both subjects were imaged by use of line-scan diffusion imaging (LSDI), a technique that can be implemented on conventional MR systems (5). The advantage of LSDI over the most popular sequence to obtain DT images, echo planar imaging, is that LSDI is relatively free from susceptibility and chemical shift artifacts, as well as image distortions, and thus the coregistration of LSDI DT images with structural images does not pose as significant a problem as is the case for EPI DT images (6).
The 3-T DT images of the healthy subject were obtained in the axial plane aligned to the anterior commissure–posterior commissure (AC-PC) line. For each line, six images with high (b=1000 s/mm2) diffusion weighting along six noncollinear directions and noncoplanar directions were collected. For low (b=5 s/mm2) diffusion weighting, we collected only two images, because diffusion-related signal intensity changes are minimal. The following imaging parameters were used: rectangular field of view (FOV), 220 × 165 mm; 128 × 128 matrix (256 × 256 image matrix); section thickness, 3 mm; intersection distance, 0 mm; receiver bandwidth, ±4 kHz; TE, 64 ms; TReff, 2592 ms; acquisition time, 60 s/section. We acquired a total of 46 axial sections covering the entire brain. The total acquisition time was 46 minutes. Motion-related artifact maps were also constructed. In addition, a series of 124 contiguous coronal structural images were acquired by using a 3-T magnet to perform a spoiled gradient-recalled acquisition in the steady state (SPGR) sequence with the following parameters: TR, 35 ms; TE, 5 ms; flip angle, 45°; field of view, 24 cm; NEX, 1.0; and matrix, 256 × 256 (192 phase-encoding steps). The voxel (volume of pixel) dimensions were 0.9375 × 0.9375 × 1.5 mm.
Images of the patient were acquired by use of the 1.5-T system with the following pulse sequences: 1) a 3D-SPGR coronal sequence (section thickness, 1.5 mm; TE/TR, 6/35 ms; flip angle, 75°; flip angle, 24 cm); 2) a T2-weighted fast spin-echo sequence (section thickness, 5 mm; section gap, 1 mm; TE/TR, 100/3000 ms; field of view, 22 cm); and 3) a coronal LSDI sequence with parameters similar to those used for the 3-T imaging, with the exception of 4-mm coronal sections with a 1-mm gap aligned perpendicular to the AC-PC line and covering the area between the temporal pole and occipital tip.
Parcellation of Gray Matter
Both 1.5-T and 3-T data involved the same postprocessing procedures. In the first step, we segmented gray and white matter from the structural SPGR images by using Freesurfer (Massachusetts General Hospital, Harvard Medical School; available from http://surfer.nmr.mgh.harvard.edu), a program that can be used to extract the white matter surface by using a deformable surface model, which is then used to estimate the gray matter (pial volume) surface (7–9). During gray matter–white matter surface reconstruction, to fix the topologic errors that may have occurred during the segmentation procedure, the first author performed minimal manual editing. This editing consisted of filling in ventricles, removing the optic nerve, and connecting temporal white matter, all of which took about 20 minutes per case.
The cortical surface was further parcellated into 85 anatomically relevant brain subregions based on the surface-based registration, which transforms the subject’s gray matter surface to a sphere and then matches that sphere to a template sphere with an originally manually parcellated label map (8). Finally, every gray matter surface node was assigned to its corresponding label on the template, which has a lookup table for each parcellation.
Figure 1 illustrates both top and front views of a 3D reconstruction of the cortex from the SPGR image obtained in the patient, wherein the prefrontal gyrus, postcentral gyrus, and superior frontal gyrus are clearly depicted. Also, the orbitofrontal gyrus is clearly seen in the frontal view. The parcellations were used not only as anatomic landmarks of the brain structures (such as central sulcus, or superior frontal sulcus), but also for further classification of fibers (see below).
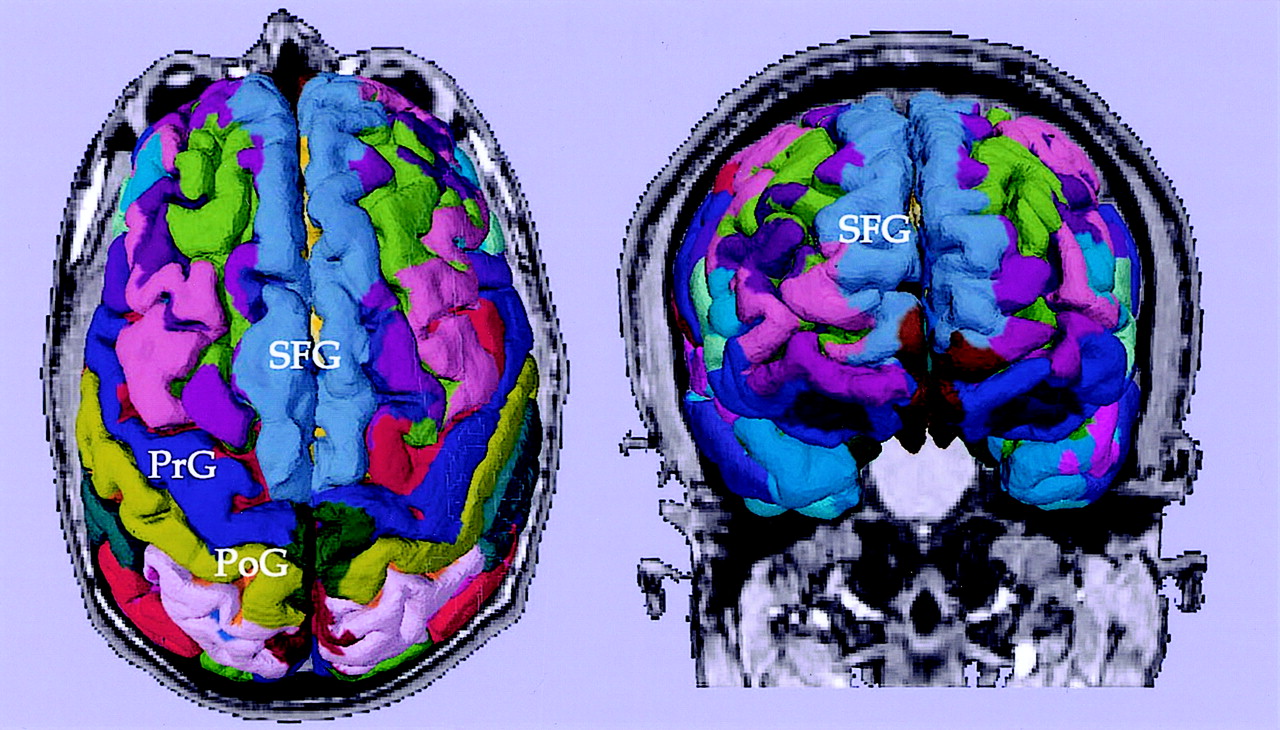
Cortical parcellations derived from SPGR images obtained from a tumor patient. Labels are based on the lookup table provided by Freesurfer. PrG, precentral gyrus; PoG, postcentral gyrus; SFG, superior frontal gyrus.
Reconstruction of DT Maps
DT maps were derived from the raw diffusion-weighted images of the LSDI sequence for every voxel, followed by calculations of the major eigenvalues, eigenvectors, and fractional anisotropy (FA) maps (10). Motion-related artifact maps were also constructed. In addition, we computed average apparent diffusion coefficient (ADC) maps, average diffusion-weighted images, average T2-weighted images, as well as anisotropy maps on the basis of the SD of the ADC along the six different directions (10). Also, for visualization purposes, color-coded tensor maps, described in detail elsewhere (3), were created.
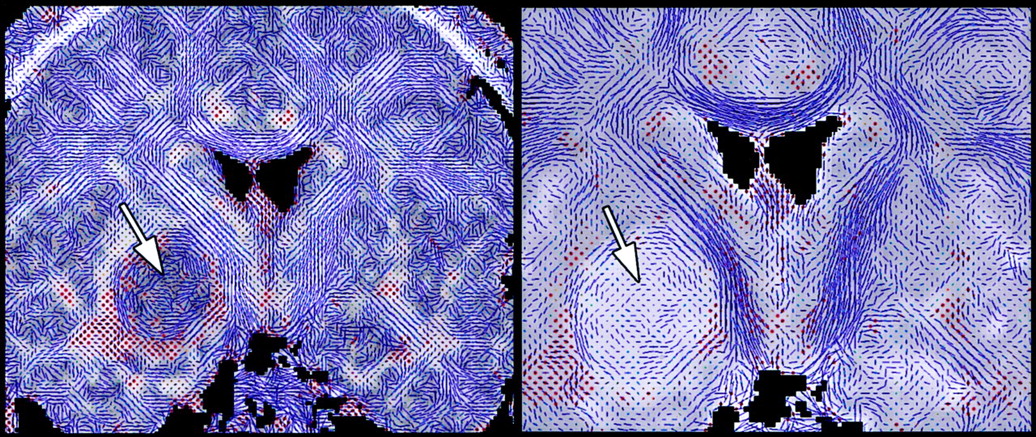
Figures 2–5 represent the information that can be obtained from DT images. The conventional T2-weighted image (left panel, Fig 2), provides the best anatomic reference for the gray matter, white matter, and CSF spaces. In addition, the FA maps (middle panel, Fig 2) provide information about the density and organization of the fiber tracts. In addition to the anatomic information provided by the T2-weighted images, the FA maps provide information about the anatomy of the white matter fiber tracts. Clearly seen are: the most dense fiber tract interconnecting left and right hemispheres, the corpus callosum (CC), left and right cingulum bundles directly above the CC, and the central part of the fornix and the internal capsule. Also seen are arcuate fibers that interconnect adjacent frontal gyri. The coronal tensor map for the selected coronal plane shows the directionality of the white matter tracts (Fig 3). The blue lines indicate the in-plane diffusion and the other colors indicate the magnitude of the out-of-plane diffusion, with red-orange indicating the maximal diffusion out of plane. Note the clear appearance of the CC in plane, and the fornix and cingulum bundle out of plane. Figures 4 and 5 depict the same visualization methods, but applied instead to the tumor case. SPGR images, T2-weighted images, FA maps, and ADC maps as well as a 2D visualization of major eigenvector are shown. The left half of the plane is a section of the eigenvector map from whole brain on a FA image and the right half of the plane shows a zoomed display of the tumor region with the ADC image. The strength of the eigenvector in the right plane is multiplied by the FA to show low anisotropy in the tumor region, which has high ADC. Note how the tumor clearly displaces the main eigenvectors of the diffusion within the voxels anatomically belonging to the corticospinal tract.

T2-weighted, FA, and mean ADC images from a healthy subject are displayed in coronal view.

2D visualization of coronal sections of a DT imaging. The major eigenvector of each voxel is displayed with line (in-plane component of the eigenvector) and color (from green to red, out-of-plane component of the eigenvector) on the background image of FA. The authors manually labeled the major fiber bundles (ie, CC, corpus callosum; SLF, superior longitudinal fasciculus; ILF, inferior longitudinal fasciculus; CB, cingulum bundle; CST, corticospinal tract; UF, uncinate fasciculus; AF, arcuate fasciculus; Af, arcuate fibers; AL, anterior limb of internal capsule; PL, posterior limb of internal capsule; and Fx, fornix).

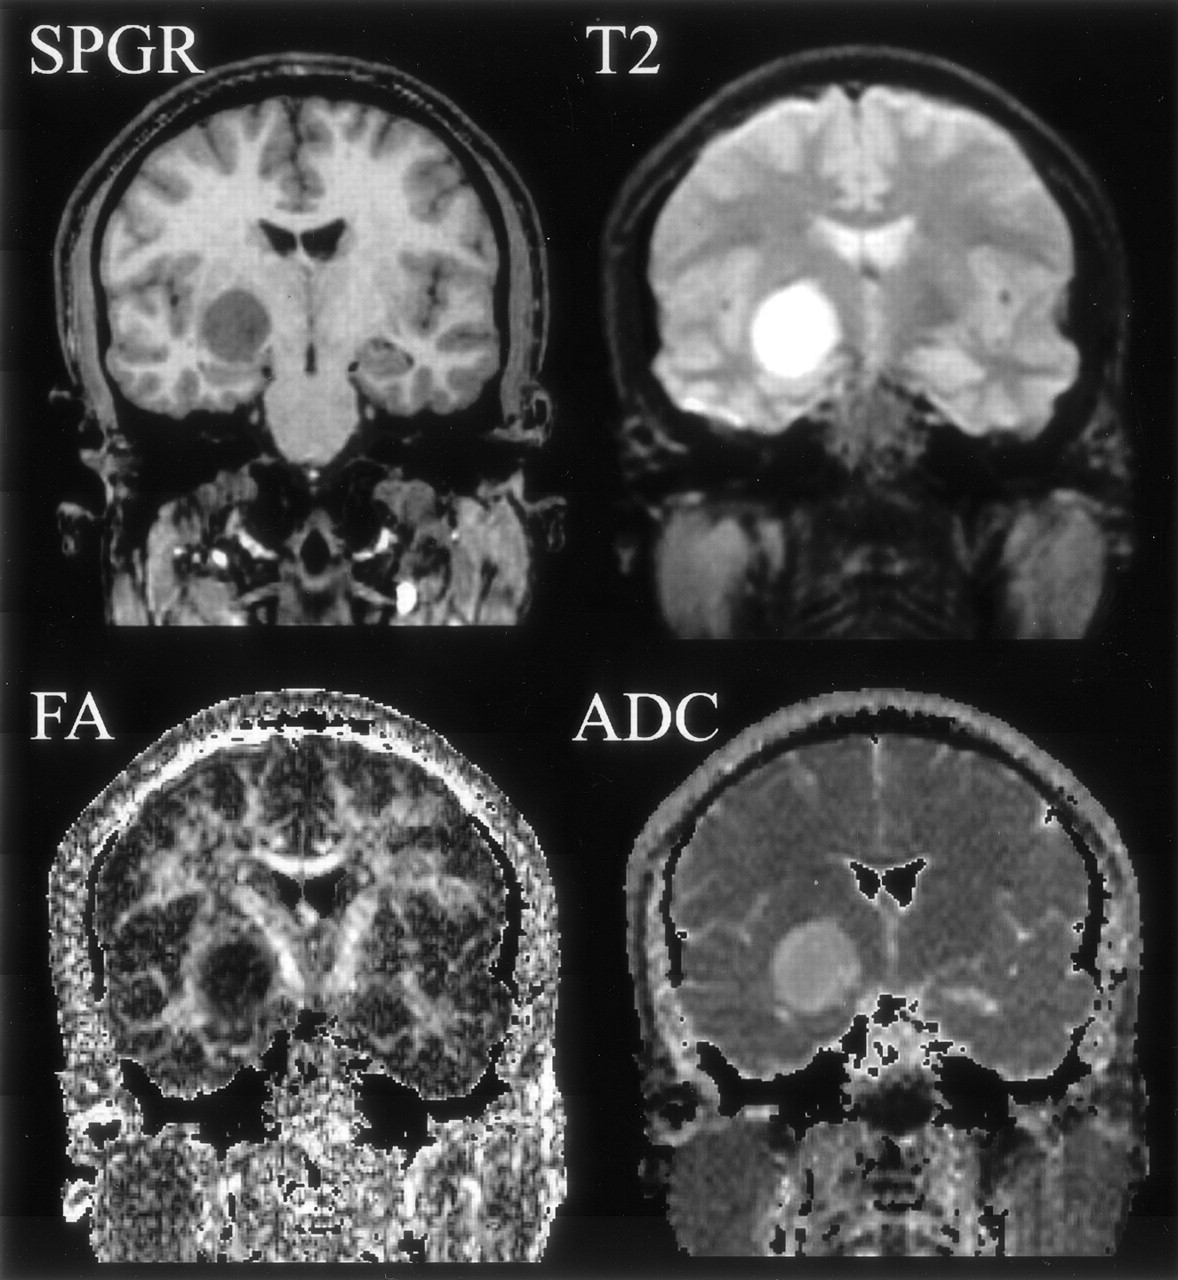
Coronal section images (SPGR, T2-weighted, FA, and mean ADC images) of a brain tumor are displayed. The tumor is located in the right medial temporal lobe, adjacent to the right cerebral peduncle.
Visualization of DT map of a brain tumor. Left panel shows whole brain DT imaging map overlaid on an FA map, and the right panel demonstrates the magnified DT map of the tumor with mean ADC map as background. Except for the medial tumor margin, the tumor area shows high diffusivity and low anisotropy.
Reconstruction of White Matter Fiber Tracts
For automated fiber tracking and for processing DT images, we used a DT toolbox, DoDTI (available from http://neuroimage.yonsei.ac.kr/dodti). This tool was developed by the first author as an operating system independent, user-configurable, and user-friendly program running on Matlab (Mathworks, Natick, MA).
Fiber tracking of DT imaging was based on the fourth-order Runge-Kutta method for the integration solver (11). This fiber tracking algorithm virtually creates a trace of a particle by following the local fiber orientation as defined by the DT field. Of note here, DT imaging reveals local fiber orientation (for each voxel) through the major eigenvectors of the DT image. It is thus possible to use this information iteratively, across many voxels, to propagate a virtual particle and thereby follow the fiber trace until it reaches outside the white matter.
For the reconstruction of the whole white matter fiber bundles, seeds points were assigned at all the voxels inside the white matter segmented by using SPM99 (Wellcome Department of Imaging Neuroscience, UK; see http://www.fil.ion.ucl.ac.uk/spm/). The number of seed points was chosen to be about 50,000, and the corresponding number of traces was constructed. Different fiber bundles were represented by fiber traces, which are a series of points (x, y, and z) in 3D coordinate, which are converted into a streamtube mesh surface for rendering. Because the rendering of the reconstructed surface of each trace requires enormous computational time, only 3000–5000 traces were visualized after fiber traces shorter than 5 cm, such as short arcuate fasciculus fibers.
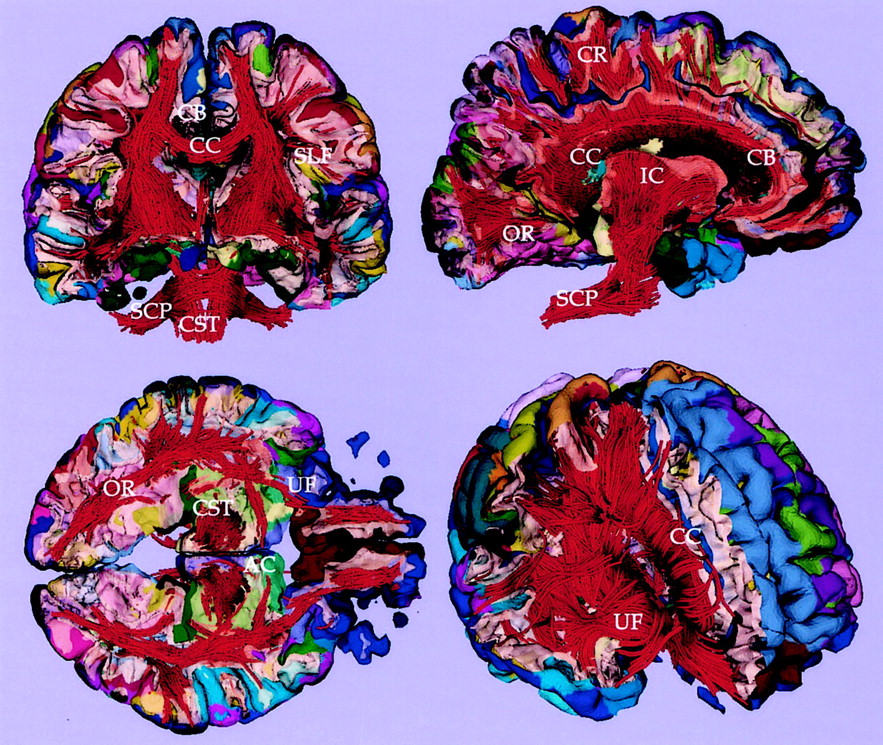
Figure 6 shows the results of the fiber tractography from the healthy subject, visualizing the fibers crossing the interhemispheric fissure (ie, CC), the fibers interconnecting temporal and prefrontal areas in arcuate fasciculus, the fibers connecting temporal and occipital regions in inferior longitudinal fasciculus, and those fibers located above the CC (ie, cingulum bundles). The corticospinal tract, along with the corona radiate, is also visualized. The localization of these fiber tracts can be easily followed and are consistent with the known white matter anatomy.

3D reconstruction of fiber structures (tractography) derived from DT imaging. Fiber tractography is constructed and visualized by using a DT toolbox, DoDTI. Shorter fibers less than 5 cm were not displayed, to reduce complexity.
Combining Information from Gray Matter Parcellation and Fiber Tractography
In the last step of the process, SPGR images were coregistered to the T2-weighted image acquired at baseline with DT imaging. This registration used mutual information (12), which calculates a rigid body transformation function from SPGR to DT imaging and incorporates a translation and rotation component. In effect, the object image (SPGR) is registered to the target image (DT image) without changing its geometry. By using this transformation function, we transformed the cortical surface parcellation into DT imaging space. Finally, the gray matter parcellation was used to differentiate white matter fiber tracts originating from the different gray matter regions. Each fiber was then classified by assigning labels of the nearest-neighbor parcellation to its end points by using the automated algorithm that we developed (ie, DoDTI).
The registered cortical surfaces generated from Freesurfer and the fiber streamtubes, generated and saved as VTK (Visualization Tool Kit, Kitware, Clifton Park, NY) mesh format from a novel program called DoDTI, were combined and visualized in the 3D Slicer (from our group, Surgical Planning Laboratory, BWH, Harvard Medical School, http://www.slicer.org). We used 3D Slicer because it is very efficient for visualizing cross-sections of fiber tractography and cortical surface with the background gray-scale image.
As shown in Fig 7, for the control case, and in Fig 8, for the tumor case, the clear advantage of combining information from gray matter parcellation and from fiber tractography is the anatomic reference for white matter and the ability to follow the fiber tracts originating from the gray matter structures. Figure 7 shows a visualization technique that enables us to explore cross-sections of the white matter fibers as well as the gray matter surface, thereby providing anatomic reference for the white matter fibers according to their surrounding gray matter structures. The lower panel of Figure 8 shows examples of white matter tracts delineated by assigning the color of the gray matter parcellation from which the fibers originated. The fibers in blue color (in Fig 8) are located closest to the tumor, and in fact originate from the right precentral gyrus (anatomic location for the left motor function; blue on the cortex parcellation). Note that we generated and displayed only the fibers that were likely associated with the patient’s clinical symptoms (in Fig 8) to focus on the fibers that might have been affected by the tumor.

Fiber tractography combined with cortical parcellation. Coronal, sagittal, and axial cross-sectional views of white and gray matter surface combined with fiber tractography are visualized. Light yellow surface shows the gray-white matter boundary. CC, corpus callosum; CR, corona radiata; SLF, superior longitudinal fasciculus; OR, optic radiation; CB, cingulum bundle; SCP, superior cerebellar peduncle; CST, corticospinal tract; UF, uncinate fasciculus; and AC, anterior commissure.

Tractography and cortical parcellation of tumor brain. Upper left panel shows the whole tractography with a cross-section of gray and white matter surface. The cortical parcellation of the gray matter surface is displayed in color. Upper right panel shows a cross-section view of white matter overlaid with the gray matter–white matter surface. The tumor is colored as white. Lower panels show the fibers (in blue) originating from the right precentral gyrus (blue color in cortex) and located closest to the tumor. CC, corpus callosum; SLF, superior longitudinal fasciculus; CB, cingulum bundle; AF, arcuate fibers; IC, internal capsule; PL, posterior limb; CST, corticospinal tract; SCP, superior cerebellar peduncle; STG, superior temporal gyrus; MTG, middle temporal gyrus; PrG, precentral gyrus; and LV, lateral ventricle.
The parcellation of gray matter in Freesurfer took about 12 hours, and the fiber tracking in DoDTI took less than 2 minutes by using a Pentium 4 CPU. Although all procedures can be done automatically, minimal manual editing of both Freesurfer and DoDTI outputs can increase the registration accuracy and image quality. On the basis of the results from the present study, the subject underwent neurosurgery, and the tumor was removed, except for the small medial tumor remnant that was left to preserve motor function. No additional deficits were observed after surgery.
Discussion
We have shown how relatively low-spatial-resolution DT imaging can be processed and integrated with high-spatial-resolution structural MR imaging. By visualizing the fiber tractography with cortical structures, we note that the association between the tractography and the cortical structures is consistent with anatomic knowledge about the location and extent of fiber tracts in these regions, although this would need to be confirmed and validated by histologic data.
The application of this method to a tumor case demonstrates the potential usefulness of tractography with cortical parcellations for determining the impact of the tumor on white matter architecture. The patient presented with motor deficits originating from possible pressure of the tumor on neighboring corticospinal fiber tracts, and we were able to trace the fibers that were most affected by the tumor, which consistent with anatomic knowledge, were in close proximity to the hand strip of the left motor field. Such information is of paramount importance for achieving maximal tumor removal while avoiding functionally important white matter tracts and thus minimizing postoperative neurologic morbidity. Also in this case, the information obtained from DT images and fiber tracking allowed the surgeon to modify the surgical approach and to remove the tumor, except for the portion that was most likely interleaving the motor fibers.
Our method of visualizing white matter structures in association with gray matter parcellation is important, particularly in the analysis of diseases of white matter, such as multiple sclerosis, because such diseases do not just affect white matter, but also affect the cortical brain regions that the affected fiber bundles interconnect. This relationship can also lead to additional brain dysfunctions localized to specific cortical regions. Anatomic connectivity derived from white matter can thereby be linked to functional connectivity, which interests recent investigators of functional MR imaging. Similarly, the visualization of white matter, and its anatomic and topologic relationship to the gray matter surrounding it, is important for the surgical planning of tumor cases that involve white matter because critical white matter fiber tracts can be visualized and spared if they are not part of the tumor.
Conclusion
We propose a combinatory method for visualizing white matter fiber tracts and gray matter parcellation by using DT imaging and structural MR imaging. Visualization of fiber tracts on cortical parcellation shows the feasibility of fiber tractography derived from DT imaging. The application to a tumor case shows the usefulness of tractography, combined with cortical structures, for determining the impact of the tumor on white matter architecture and suggests its potential use for surgical planning and guidance.
Footnotes
Grant support from the Postdoctoral Fellowship Program of Korea Science and Engineering Foundation (to H.-J.P.); National Alliance for Research on Schizophrenia and Depression (to M.K.); National Institute of Health (K02 MH 01110 and R01 MH 50747 to M.E.S., R01 MH 40799 to R.W.M., and RO3 MH068464–01 to M.K.); Department of Veterans Affairs Merit Awards (to M.E.S. and R.W.M.), National Center for Research Resources (11747 to R.K. and P41-RR13218 to F.A.J. and C.-F.W.).
References
- Received November 22, 2003.
- Accepted after revision January 28, 2004.
- Copyright © American Society of Neuroradiology
In this issue


Jump to section
Related Articles
Cited By...
- Monosynaptically-interconnected Network Module (MNM) Approach for High-Resolution Brain Sub-Network Analysis
- Reduced Structural Connectivity Between Left Auditory Thalamus and the Motion-Sensitive Planum Temporale in Developmental Dyslexia
- Structural and Functional Brain Networks: From Connections to Cognition