Advertisement

Main menu

  • Home
  • Content
    • Current Issue
    • Publication Preview--Ahead of Print
    • Past Issue Archive
    • Case of the Week Archive
    • Classic Case Archive
    • Case of the Month Archive
    • COVID-19 Content and Resources
  • For Authors
  • About Us
    • About AJNR
    • Editors
    • American Society of Neuroradiology
  • Submit a Manuscript
  • Podcasts
    • Subscribe on iTunes
    • Subscribe on Stitcher
  • More
    • Subscribers
    • Permissions
    • Advertisers
    • Alerts
    • Feedback
  • Other Publications
    • ajnr

User menu

  • Subscribe
  • Alerts
  • Log in

Search

  • Advanced search
American Journal of Neuroradiology

American Journal of Neuroradiology

  • Subscribe
  • Alerts
  • Log in

Advanced Search

  • Home
  • Content
    • Current Issue
    • Publication Preview--Ahead of Print
    • Past Issue Archive
    • Case of the Week Archive
    • Classic Case Archive
    • Case of the Month Archive
    • COVID-19 Content and Resources
  • For Authors
  • About Us
    • About AJNR
    • Editors
    • American Society of Neuroradiology
  • Submit a Manuscript
  • Podcasts
    • Subscribe on iTunes
    • Subscribe on Stitcher
  • More
    • Subscribers
    • Permissions
    • Advertisers
    • Alerts
    • Feedback
  • Follow AJNR on Twitter
  • Visit AJNR on Facebook
  • Follow AJNR on Instagram
  • Join AJNR on LinkedIn
  • RSS Feeds
Research ArticleBRAIN

High-b-Value Diffusion-Weighted MR Imaging of Hyperacute Ischemic Stroke at 1.5T

Hyun Jeong Kim, Choong Gon Choi, Deok Hee Lee, Jeong Hyun Lee, Sang Joon Kim and Dae Chul Suh
American Journal of Neuroradiology February 2005, 26 (2) 208-215;
Hyun Jeong Kim
  • Find this author on Google Scholar
  • Find this author on PubMed
  • Search for this author on this site
Choong Gon Choi
  • Find this author on Google Scholar
  • Find this author on PubMed
  • Search for this author on this site
Deok Hee Lee
  • Find this author on Google Scholar
  • Find this author on PubMed
  • Search for this author on this site
Jeong Hyun Lee
  • Find this author on Google Scholar
  • Find this author on PubMed
  • Search for this author on this site
Sang Joon Kim
  • Find this author on Google Scholar
  • Find this author on PubMed
  • Search for this author on this site
Dae Chul Suh
  • Find this author on Google Scholar
  • Find this author on PubMed
  • Search for this author on this site
  • Article
  • Figures & Data
  • Info & Metrics
  • References
  • PDF
Loading

Article Figures & Data

Figures

  • Tables
  • Fig 1.
    • Download figure
    • Open in new tab
    • Download powerpoint
    Fig 1.

    A–C, An 88-year-old woman who had right-side weakness for 1 hour 50 minutes. Left MCA was not visible on initial 3D TOF MRA images (not presented).

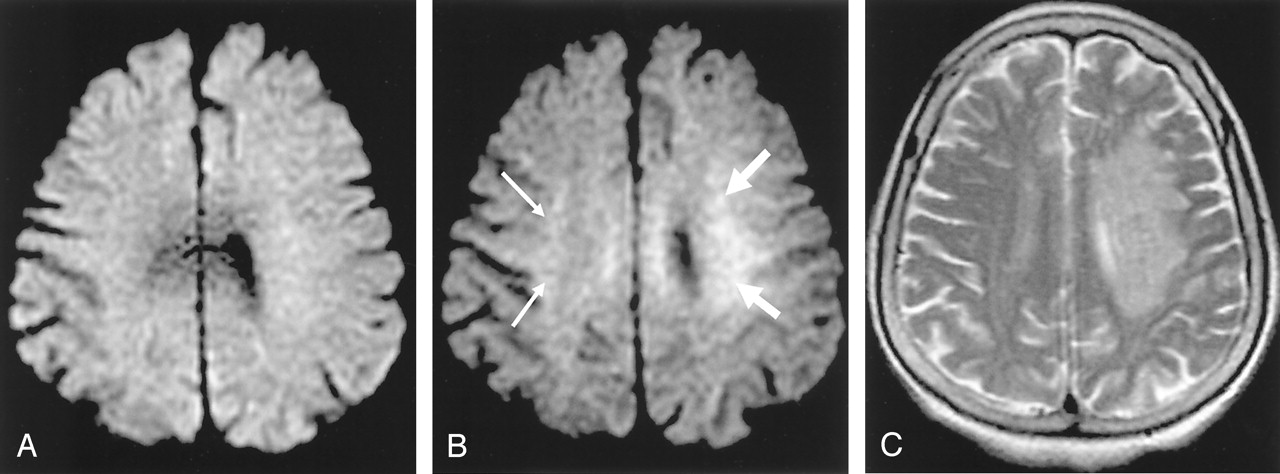
    Abnormal hyperintensity is noted at left corona radiata on b = 2000 image (B, white arrows) but it is not definite on b = 1000 image (A). Note relative hyperintensity of right corona radiata on b = 2000 image compared with b = 1000 image (B, small white arrows). This is normal and therefore should not be regarded as an ischemic lesion. Follow-up T2-weighted images obtained 3 days later shows progression of the infarction in the corresponding left corona radiata area (C).

  • Fig 2.
    • Download figure
    • Open in new tab
    • Download powerpoint
    Fig 2.

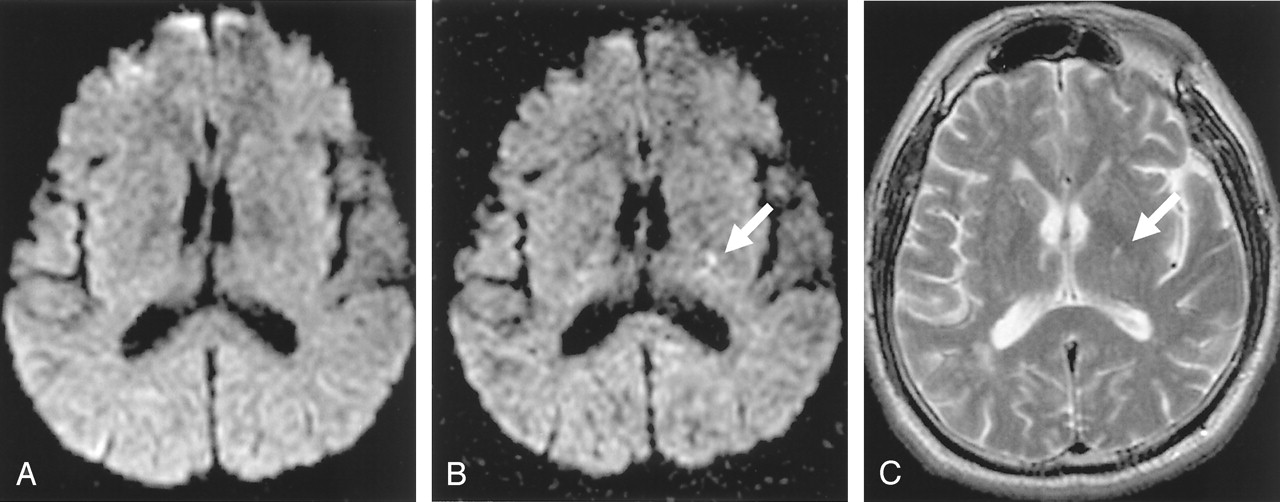
    A–C, A 63-year-old man who had right hemiparesis for 6 hours. Abnormal hyperintensity is noted at left posterior limb of internal capsule on b = 2000 image (B, white arrow) but it is not definite on b = 1000 image (A). Follow-up T2-weighted image obtained 2 days later shows a small hyper-intense lesion in the same location (C, white arrow).

  • Fig 3.
    • Download figure
    • Open in new tab
    • Download powerpoint
    Fig 3.

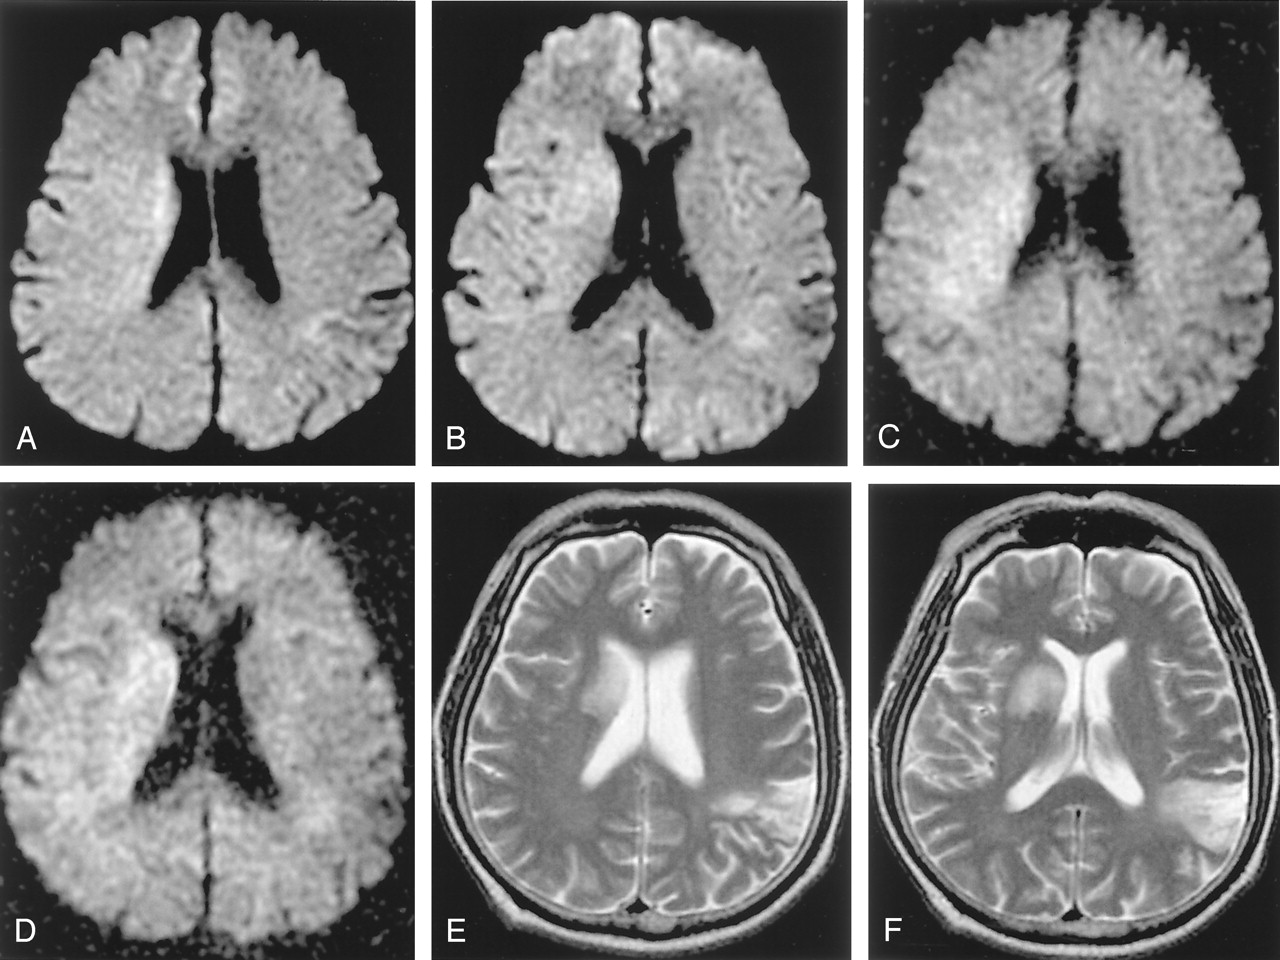
    A–F, A 64-year-old man who had left hemiparesis for 1 hour 20 minutes. Initial b = 1000 images reveal subtle hyperintensity in the right corona radiata and basal ganglia (A, B). The lesion is more conspicuous and extensive on b = 2000 images (C, D). Follow-up T2-weighted image obtained 3 days later shows progression to infarction at the basal ganglia (E, F). Initial diffusion change is partly normalized in the posterior portion of the initial lesion. An old infarction is noted in the left posterior temporal cortex on the T2-weighted image.

  • Fig 4.
    • Download figure
    • Open in new tab
    • Download powerpoint
    Fig 4.

    A–C, A 57-year-old man who had left hemparesis for 4 hours 40 minutes. Initial b = 1000 image reveals subtle hyperintensity in the right pons (A). The lesion is more conspicuous on the b = 2000 image (B). Follow-up T2-weighted image obtained 2 days later shows the infarction at the corresponding location.

  • Fig 5.
    • Download figure
    • Open in new tab
    • Download powerpoint
    Fig 5.

    Mean volume of the lesions from initial b = 1000, b = 2000, and follow-up b = 2000 images. As the b value increases, the mean volume of the lesion increases by 47% (22.1 ± 27.9 mL on b = 1000 image versus 32.5 ± 36.5 mL on b = 2000 image, P < .001, n = 34). The mean volume of the lesion measured on follow-up b = 2000 images (52.3 ± 61.6 mL) is significantly larger than those of the initial trace images of b = 1000 or 2000 because of progression or edematous swelling of the infarction in most of the patients.

  • Fig 6.
    • Download figure
    • Open in new tab
    • Download powerpoint
    Fig 6.

    In b = 2000 images, densely packed white matter tracts normally shows relative hyperintensities compared with gray matter, especially at the corona radiata (A), internal capsule (B), and the lower pons level (C). These normal relative hyperintensities of white matter tracts should not be erroneously diagnosed as ischemic lesions.

Tables

  • Figures
    • View popup
    TABLE 1:

    Patterns of infarction in 83 patients who had lesions on initial DW images

    Pattern of InfarctionPatients (No.)
    ACA4
    MCA (1 or 2 lesions)39
    Scattered MCA (>3 lesions)13
    ACA + MCA1
    Brain stem or cerebellar lesion11
    Small lesion in deep gray matter or adjacent white matter12
    Border zone lesion3
    Total83
    • Note.—DW images, diffusion-weighted images; ACA, anterior cerebral artery; MCA, middle cerebral artery.

    • View popup
    TABLE 2:

    Results of qualitative analysis in 83 patients who had lesions on initial DW images

    Item of AnalysisType of ConsensusTime WindowTotal
    0 ∼ 3 hours3 ∼ 6 hours
    Lesion conspicuity2000 > 100015823
    2000 ∼ 1000273360
    1000 > 2000000
    Total424183
    Lesion extent2000 > 10009211
    2000 ∼ 1000333972
    1000 > 2000000
    Total424183
    Artifacts2000 > 1000202
    2000 ∼ 1000384078
    1000 > 2000213
    Total424183
    • Note.—2000 > 1000, b = 2000 images are superior to b = 1000 images; 2000 ∼ 1000, b = 2000 images are the same as b = 1000 images; 1000 > 2000, b = 2000 images are inferior to b = 1000 images in each item of qualitative analysis.

    • View popup
    TABLE 3:

    Results of quantitative analysis in 34 patients who had lesions in the MCA territory (mean ± SD)

    b = 1000 (1NEX)b = 2000 (2NEX)
    LesionContralateralLesionContralateral
    Mean Vol. (ml)22.1 ± 27.9NA32.5 ± 36.5*NA
    Signal Intensity440.2 ± 96.8342.3 ± 62.3286.4 ± 87.5*189.6 ± 42.5*
    Noise11.6 ± 2.19.0 ± 1.9*
    SNR38.7 ± 9.830.0 ± 6.432.3 ± 8.1*21.6 ± 4.8*
    CNR8.7 ± 6.410.7 ± 6.5*
    ADC (10−4 × mm2/s)6.0 ± 1.37.6 ± 1.54.6 ± 0.9*6.1 ± 0.7*
    • Abbreviations—NEX; number of excitation, Contralateral; contralateral normal area corresponding to the ischemic lesion. Vol.; volume, NA; not available, SNR; signal to noise ratio defined as SROI/σ (SROI = signal intensity at the region of interest, σ = standard deviation of background signal intensity), CNR; contrast to noise ratio defined as the difference of SNR between the lesion and corresponding contra-lateral normal area, ADC; apparent diffusion coefficient,

    • * statistical difference between b = 1000 and b = 2000 images (paired samples t test, P < 0.001).

PreviousNext
Back to top

In this issue

American Journal of Neuroradiology: 26 (2)
American Journal of Neuroradiology
Vol. 26, Issue 2
1 Feb 2005
  • Table of Contents
  • Index by author
Advertisement
Print
Download PDF
Email Article

Thank you for your interest in spreading the word on American Journal of Neuroradiology.

NOTE: We only request your email address so that the person you are recommending the page to knows that you wanted them to see it, and that it is not junk mail. We do not capture any email address.

Enter multiple addresses on separate lines or separate them with commas.
High-b-Value Diffusion-Weighted MR Imaging of Hyperacute Ischemic Stroke at 1.5T
(Your Name) has sent you a message from American Journal of Neuroradiology
(Your Name) thought you would like to see the American Journal of Neuroradiology web site.
CAPTCHA
This question is for testing whether or not you are a human visitor and to prevent automated spam submissions.
Citation Tools
High-b-Value Diffusion-Weighted MR Imaging of Hyperacute Ischemic Stroke at 1.5T
Hyun Jeong Kim, Choong Gon Choi, Deok Hee Lee, Jeong Hyun Lee, Sang Joon Kim, Dae Chul Suh
American Journal of Neuroradiology Feb 2005, 26 (2) 208-215;

Citation Manager Formats

  • BibTeX
  • Bookends
  • EasyBib
  • EndNote (tagged)
  • EndNote 8 (xml)
  • Medlars
  • Mendeley
  • Papers
  • RefWorks Tagged
  • Ref Manager
  • RIS
  • Zotero
Share
High-b-Value Diffusion-Weighted MR Imaging of Hyperacute Ischemic Stroke at 1.5T
Hyun Jeong Kim, Choong Gon Choi, Deok Hee Lee, Jeong Hyun Lee, Sang Joon Kim, Dae Chul Suh
American Journal of Neuroradiology Feb 2005, 26 (2) 208-215;
Reddit logo Twitter logo Facebook logo Mendeley logo
  • Tweet Widget
  • Facebook Like
  • Google Plus One

Jump to section

  • Article
    • Abstract
    • Methods
    • Results
    • Discussion
    • Conclusion
    • Footnotes
    • References
  • Figures & Data
  • Info & Metrics
  • References
  • PDF

Related Articles

  • No related articles found.
  • PubMed
  • Google Scholar

Cited By...

  • Diagnosis of DWI-negative acute ischemic stroke: A meta-analysis
  • Optimization of Ultrasmall Superparamagnetic Iron Oxide (P904)-enhanced Magnetic Resonance Imaging of Lymph Nodes: Initial Experience in a Mouse Model
  • Stroke Assessment With Diffusional Kurtosis Imaging
  • Apparent Diffusion Coefficient with Higher b-Value Correlates Better with Viable Cell Count Quantified from the Cavity of Brain Abscess
  • Diffusion-weighted MRI in acute stroke within the first 6 hours: 1.5 or 3.0 Tesla?
  • High-b-Value Diffusion MR Imaging and Basal Nuclei Apparent Diffusion Coefficient Measurements in Variant and Sporadic Creutzfeldt-Jakob Disease
  • Enhanced Detection of Diffusion Reductions in Creutzfeldt-Jakob Disease at a Higher B Factor
  • Crossref
  • Google Scholar

This article has not yet been cited by articles in journals that are participating in Crossref Cited-by Linking.

More in this TOC Section

  • SWI or T2*: Which MRI Sequence to Use in the Detection of Cerebral Microbleeds? The Karolinska Imaging Dementia Study
  • Progression of Microstructural Damage in Spinocerebellar Ataxia Type 2: A Longitudinal DTI Study
  • Statin Therapy Does Not Affect the Radiographic and Clinical Profile of Patients with TIA and Minor Stroke
Show more BRAIN

Similar Articles

Advertisement

News and Updates

  • Lucien Levy Best Research Article Award
  • Thanks to our 2022 Distinguished Reviewers
  • Press Releases

Resources

  • Evidence-Based Medicine Level Guide
  • How to Participate in a Tweet Chat
  • AJNR Podcast Archive
  • Ideas for Publicizing Your Research
  • Librarian Resources
  • Terms and Conditions

Opportunities

  • Share Your Art in Perspectives
  • Get Peer Review Credit from Publons
  • Moderate a Tweet Chat

American Society of Neuroradiology

  • Neurographics
  • ASNR Annual Meeting
  • Fellowship Portal
  • Position Statements

© 2023 by the American Society of Neuroradiology | Print ISSN: 0195-6108 Online ISSN: 1936-959X

Powered by HighWire