
Abstract
BACKGROUND AND PURPOSE: Wilson disease (WD) is rare but one of the few metabolic disorders that can possibly benefit from effective available treatments. The literature regarding proton MR spectroscopy (MRS) in WD is scarce and controversial. The purpose of this study was to determine the brain metabolic changes due to WD by using MRS. To our knowledge, this is the first time that MRS was performed in such a large sample of patients with WD.
METHODS: Thirty-six patients with WD and 37 healthy volunteers were examined with MRS in the parieto-occipital cortex, frontal white matter, and basal ganglia (BG). Ratios of the following metabolites were calculated in relation to creatine (Cr): N-acetylaspartate (NAA), choline (Cho), myo-inositol (mI), and glutamine/glutamate (Glx). The mean peak line width was measured on each spectrum.
RESULTS: Compared with control subjects, patients with WD had significantly decreased NAA/Cr ratios in the three studied areas (P < .005) and an increased mI/Cr ratio in the BG (P < .001). Cho/Cr and Glx/Cr did not differ between the groups. The mean peak line in the BG was wider in patients than in control subjects.
CONCLUSION: WD is unequivocally associated with MRS changes that could possibly be assigned to neuronal loss (in the three studied areas), to gliosis, and to iron and/or copper deposition in the BG.
Wilson disease (WD), also known as hepatolenticular degeneration, is a rare autosomal recessive disorder in which a disturbance of copper metabolism affects the liver. The result is abnormal deposition of copper, initially in the hepatocytes and later in various organs and tissues, particularly the CNS, the corneas, and the kidneys (1). The gene for this disease, ATP7B, has been mapped to chromosome 13 (2). Although WD is rare, it is one of the few metabolic disorders for which effective treatment is possible; therefore, the extensive research into this disorder is of substantial importance.
The clinical manifestations of WD usually start between 10 and 30 years of age and are protean, most of them in the form of hepatic and neuropsychiatric features (3). The diagnosis of WD has been based on reduced serum ceruloplasmin and copper levels, increased urinary copper excretion, findings in liver biopsy samples, and the presence of the Kayser-Fleischer ring in the cornea (4).
MR imaging demonstrates multifocal abnormalities in the basal ganglia (BG), brainstem, cerebellum, and cerebral subcortical white matter (5–7). Some of these findings are useful for the differential diagnosis of WD. However, some controversy remains concerning the correlation between MR imaging findings and the severity of the clinical picture. Some studies have shown this correlation (5, 7, 8), whereas others have not (6, 9).
Besides its usefulness in the diagnosis of WD, MR imaging can also be a tool for monitoring the efficiency of the treatment. Serum and urinary copper levels and clinical evaluation are the current methods. However, they are sometimes not precise enough to demonstrate the meaning of the changes to the clinician. For instance, at the beginning of the treatment, initial worsening of the neurologic symptoms can be due to treatment failure that requires a drug change, or it can be related to copper storage mobilization and a transient increase in free serum levels of copper (10).
MR spectroscopy (MRS), a relatively new technique that depicts biochemical alterations of the CNS in vivo (11, 12), can be used as a tool to provide clinically useful metabolic information about WD. The literature about the MRS findings in WD is scarce and controversial. Some studies demonstrated significant alterations (13–15), whereas another did not (16). Another issue is that these studies enrolled a small number of patients, which could be a limitation, though WD is undoubtedly a rare disease.
The purpose of this study was to determine the metabolic changes caused by WD in the brain by using MRS and to perform this evaluation in a large number of patients with WD.
Methods
Patients and Control Group
Thirty-six patients with WD were initially referred from the movement disorders clinic in our institution. Their diagnosis of WD was based on the combination of liver biopsy, laboratory, and clinical findings (e.g., the presence of a Kayser-Fleischer ring). The patients were prospectively examined with MRS between 2000 and 2003. Inclusion criteria were a confirmed diagnosis of WD (based on clinical criteria and/or biopsy results) and informed consent for participation in this study. Exclusion criteria were age older than 45 years and the inability to obtain good-quality spectra. Hence, two patients were excluded: one because of age and the other because of poor-quality spectra. Therefore, the MRS spectra of 34 patients were included in this study. The 34 patients (19 men, 15 women; mean age, 25 years; age range, 13–43 years) had a mean treatment duration of 5 years (range, 15 days to 27 years). Twenty-nine patients were receiving d-penicillamine, three were using zinc salts, and two were using trientine.
A control group was formed, specifically for this study, by recruiting 37 healthy, aged-matched volunteers (20 men, 17 women; mean age, 23 years; age range, 12–43 years). Informed consent was obtained from the control subjects.
The internal review board of our institution approved this study.
MR Imaging and MRS
MR imaging and MRS were performed at the same time by using a whole-body unit operating at 1.5T (Signa Horizon LX; GE Medical Systems, Milwaukee, WI) with a standard quadrature head coil. The MR imaging protocol was the following: axial and sagittal spin-echo T1-weighted sequences, an axial fast spin-echo T2-weighted sequence, an axial fluid-attenuated inversion recovery sequence, and a coronal spin-echo T2-weighted sequence. To locate the MRS volume of interest (VOI), an axial fast spin-echo T2-weighted sequence was also performed, with the following parameters: TR/TE/NEX = 3000/88.8/1, echo train length = 22, 10-mm section thickness, no intersection gap, a 240-mm FOV, and a 256 × 192 matrix.
Before we acquired the spectra, we performed localized shimming at the VOI to ensure adequate field homogeneity, which typically resulted in a water resonance line no wider than 6 Hz (full width at half maximum). This step was followed by water suppression adjustment with selective inversion of the water resonance by using three chemical shift–selective gaussian pulses.
We applied the stimulated echo acquisition mode (STEAM) MRS technique using the following parameters: TR/TE = 2000/30.0, mixing time = 13.7 ms, eight phase-cycle steps, and 160 acquisitions in the BG (128 in the other locations). The VOI was 2 × 2 × 2 cm (8 cm3).
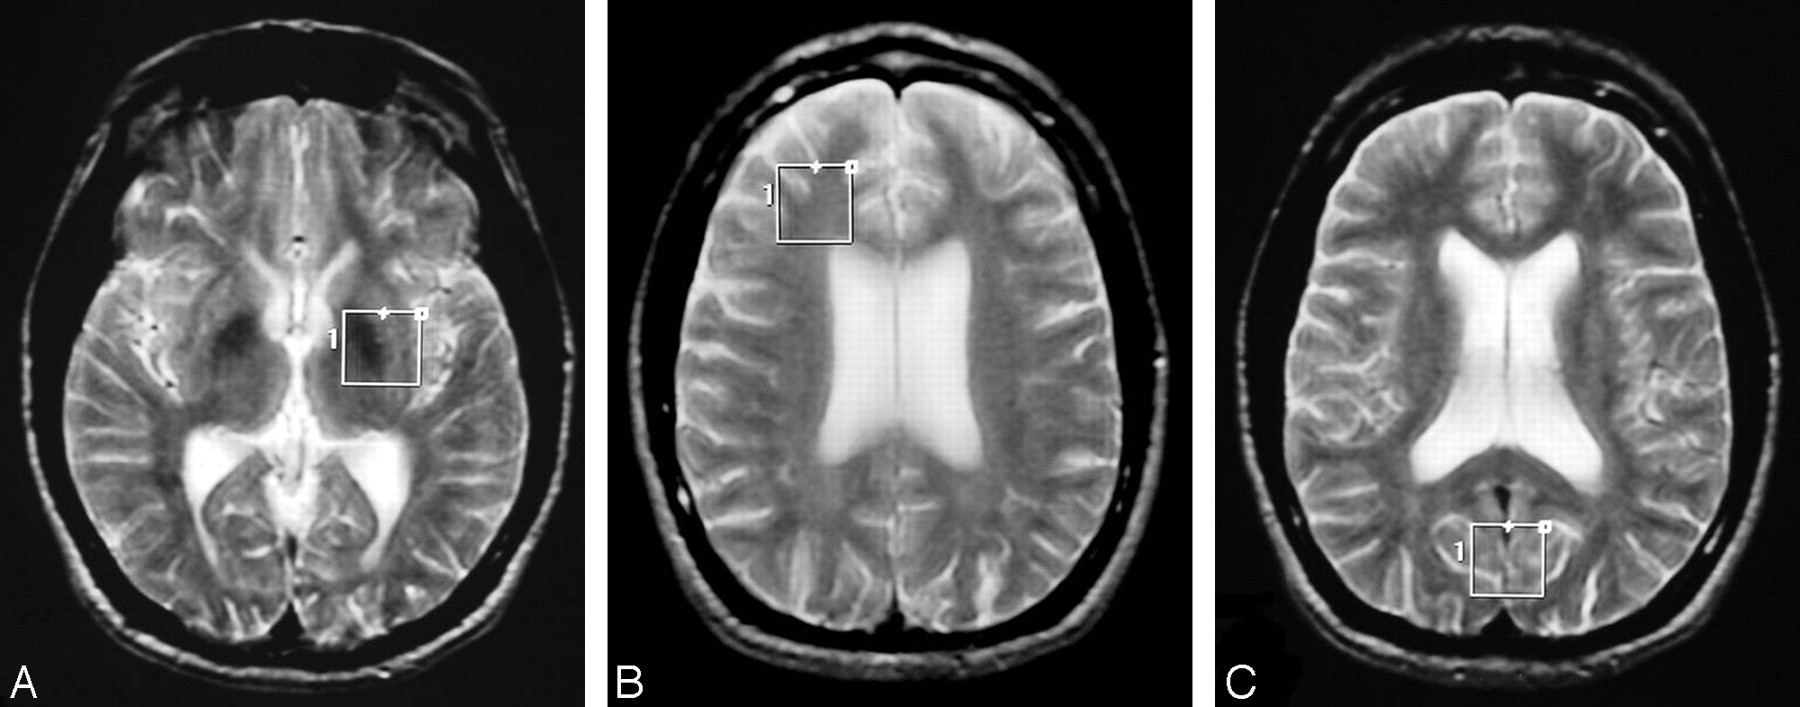
Three spectra were obtained in the same way for patients and control subjects: one in the BG region with the lentiform nucleus as the center of the VOI (Fig 1A); one in the deep frontal white matter (FWM), including the periventricular white matter of the anterior horn of the lateral ventricle (Fig 1B); and one in the parieto-occipital cortex (POC), mainly in the paramedian gray matter of the lobes (Fig 1C).

Axial T2-weighted fast spin-echo images (TR/TE = 3000/88.8, echo train length = 22) show the VOIs for MRS.
A, In the BG.
B, In the FWM.
C, In the POC.
Raw MRS data of the patients and control subjects were analyzed on a personal computer by using Magnetic Resonance User Interface software. With this software, the time domain data were analyzed by using the Advanced Method for Accurate, Robust and Efficient Spectral fitting (AMARES) method (17) after the residual water signal intensity was filtered with the Henkel-Lanczos singular value decomposition algorithm (18). The amplitude of the peaks in the time domain were measured at the following resonances: N-acetylaspartate (NAA, 2.01 ppm), glutamine and glutamate (Glx, 2.15–2.50 and 3.60–3.85 ppm), creatine and phosphocreatine (Cr, 3.02 ppm), choline-containing compounds (Cho, 3.20 ppm), and myo-inositol (mI, 3.55 ppm). Results were expressed as metabolite ratios with respect to the Cr resonance, known as the most stable of all metabolites studied (19, 20). Residual water signal intensity was used as a reference for the chemical shift of other metabolites. The mean peak line width was also measured in each spectrum studied.
Statistical Analysis
We compared NAA/Cr, Cho/Cr, mI/Cr, and Glx/Cr ratios obtained in the BG, FWM, and POC of the patients with WD with the same ratios in the same locations in the control group. We verified if the data followed a normal distribution by using the Anderson-Darling test; the data were considered not to follow a normal distribution if the descriptive level was less than 0.01. When data followed a normal distribution, we used the Student t test to compare the MRS ratios in patients and control subjects; otherwise, we used the Kruskal-Wallis nonparametric test. We used the Student t test in all cases after results of the Anderson-Darling test confirmed the normal distribution of the data. The only exception was the Glx/Cr ratio in the FWM, which had a nonnormal distribution; to analyze this ratio, we used the Kruskal-Wallis test. P < .05 was considered to indicate a statistically significant difference. All P values were two tailed. All data are expressed as the mean ± standard deviation.
Results
We evaluated 102 spectra in patients with WD (three spectra per patient in 34 patients) and 111 spectra in control subjects (three spectra per subject in 37 subjects).
In the BG, we observed a significant decrease in NAA/Cr ratios (P = .001) and an increase in mI/Cr ratios in the patients (P = .000001). Cho/Cr and Glx/Cr did not significantly differ between patients and control subjects (Table 1). Figure 2 shows representative spectra of the BG in a patient with WD and in a control subject, and Figure 3 shows a scatterplot of NAA/Cr and mI/Cr ratios in the BG. In the FWM and POC, we also observed a significant decrease in NAA/Cr ratios in the patients (P < .001). The mI/Cr, Cho/Cr, and Glx/Cr ratios did not significantly differ from those of the control subjects (Table 1). None of the patients with WD had anomalous peaks, such as those for lipids or lactate, in their MRS spectra.

Representative STEAM spectra (TR/TE = 2000/30) in the BG.
A, Spectrum in a patient with WD shows reduction of the NAA peak relative to the Cr peak, with augmentation of the mI peak.
B, Spectrum in a control subject obtained in the same location.
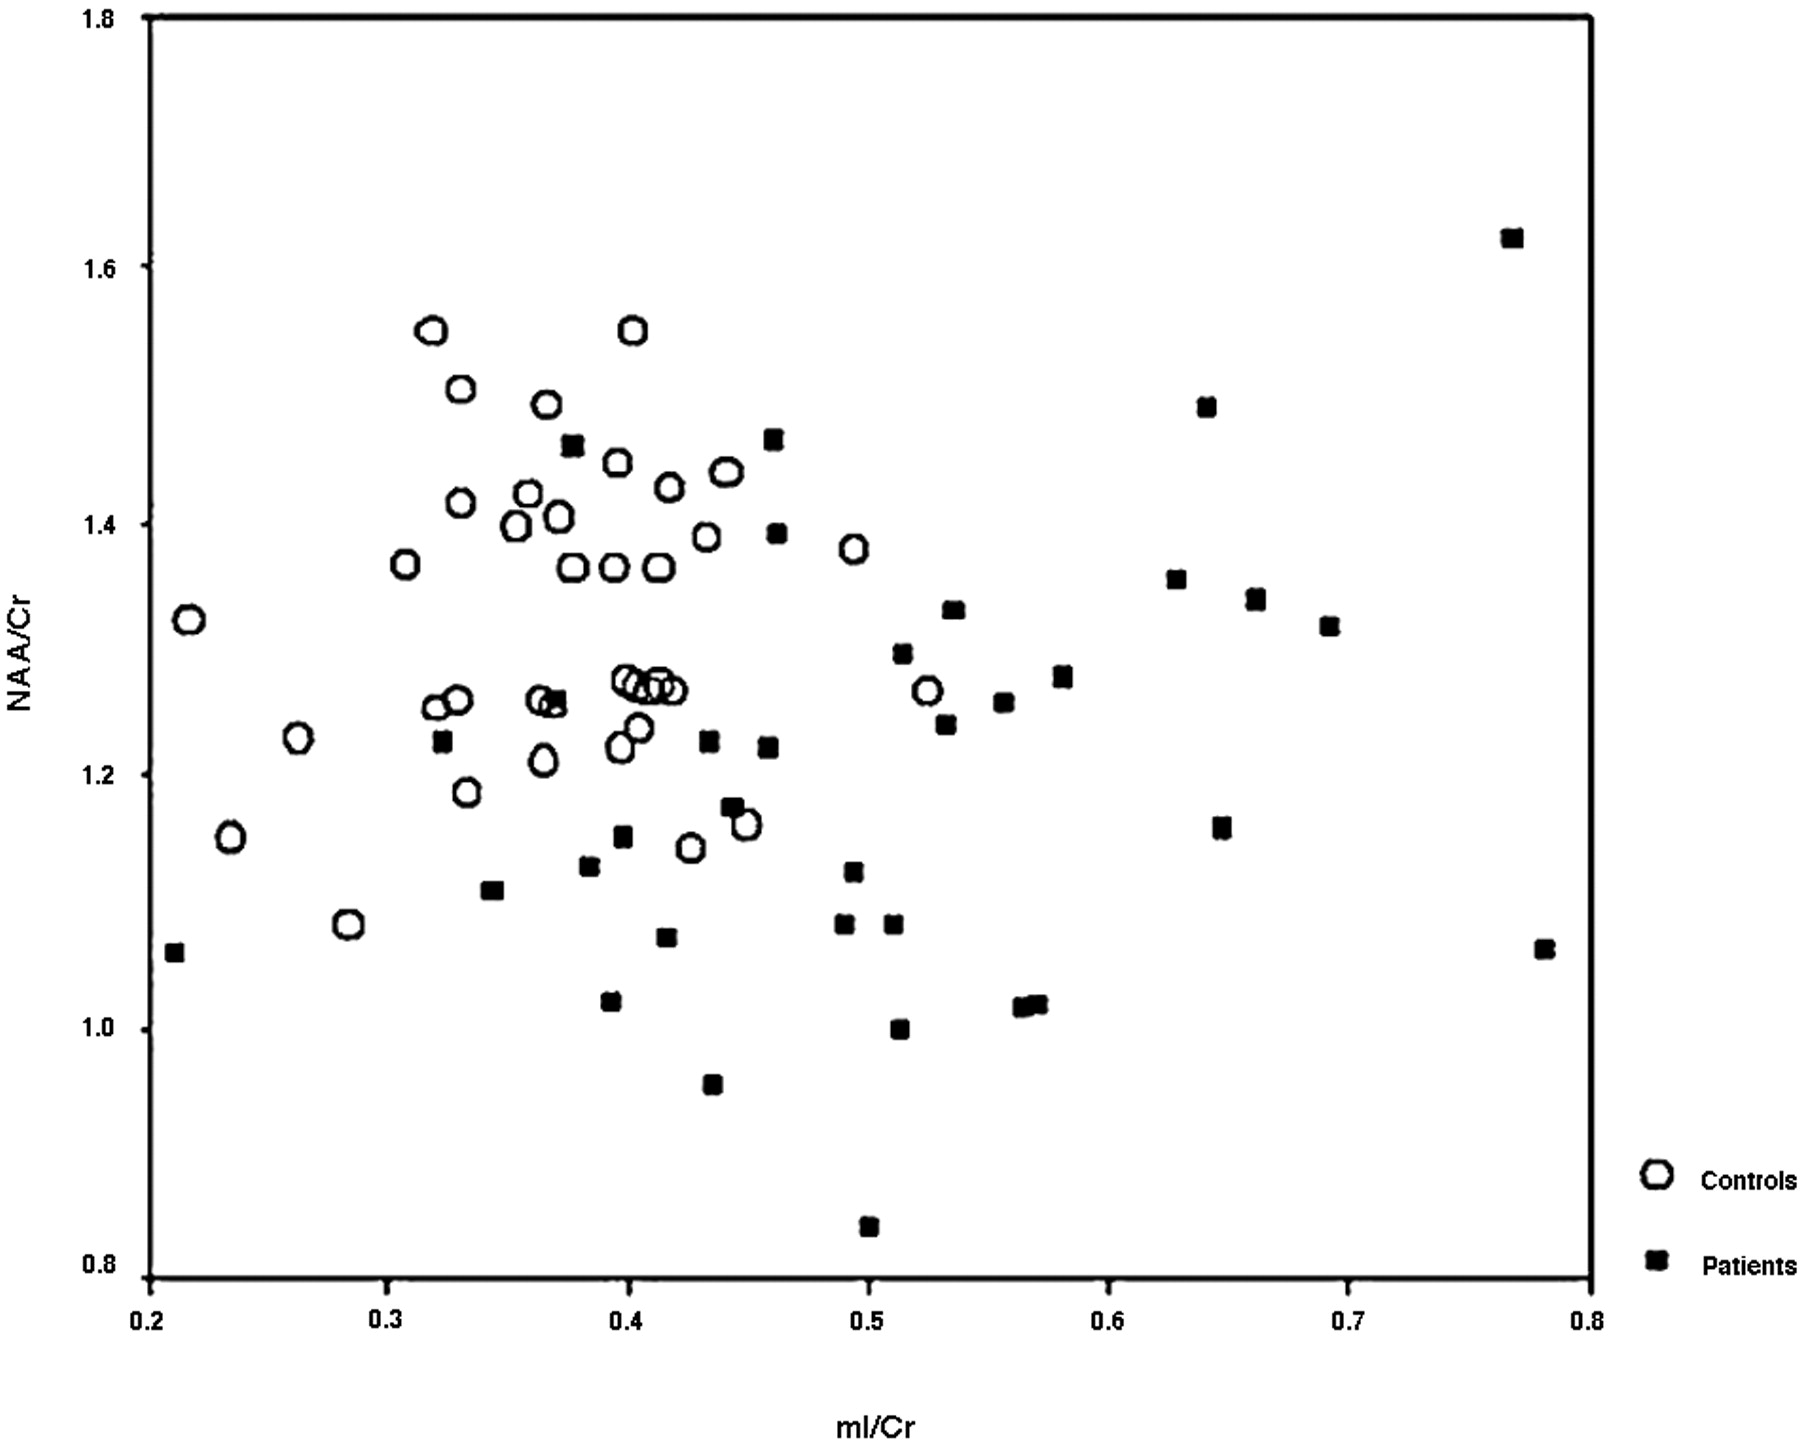
Scatterplot shows NAA/Cr and mI/Cr ratios in the BG in patients with WD and in control subjects.
Metabolic ratios in 34 patients and 37 control subjects
The mean line width of the BG spectra was significantly increased in patients compared with control subjects (P < .00001). This difference was not observed in other locations (Table 2). In the POC, the hypothesis of a normal distribution was rejected; therefore, the Kruskal-Wallis test (nonparametric) was applied.
Mean peak line widths in 34 patients and 37 control subjects
Discussion
We chose the BG as a location of study because this is the most commonly affected region in WD (21, 22). Because WD leads to a diffuse, unequally distributed copper deposition throughout the CNS (23), we also studied the FWM and the POC to describe possible metabolic abnormalities in normal-appearing structures. This approach was similar to those designed for many other diseases, mainly multiple sclerosis (24).
The BG is a difficult region in which to perform MRS, probably because of substantial iron and copper deposition in this structure in patients with WD (25). For instance, Kraft et al (16) used 128 acquisitions in the BG and excluded all putaminal mI/Cr ratios with WD from their final analysis because of poor quality. Our spectrum quality in the BG was improved with 160 acquisitions instead of 128.
In the BG, contamination involves the nearby white matter, and it is considered of little importance in adults (26). The other two locations we selected, FWM and POC, might also have been contaminated by nearby structures, though the effect was probably negligible given the size and relative homogeneity of the deep periventricular white matter and the parasagittal POC.
The spectra of healthy control subjects do not significantly differ in terms of laterality (27, 28), and WD is a metabolic disease with a bilateral and symmetric distribution of lesions (5, 29). Hence, we randomly placed the VOI in the BG (but mainly on the left) and in the FWM (mainly on the right). One report describes an asymmetrical MRS pattern in the BG in patients with WD (15), but an investigation of this issue was not the purpose of our study, though it could be a subject of future studies.
We quantified metabolite ratios relative to Cr. The use of Cr as an internal reference has been specifically tested in WD and is considered adequate (16). In our study, the NAA/Cr ratio was significantly decreased in patients with WD in all the three locations evaluated with MRS, in accordance with what Alanen et al (14) and Van den Heuvel et al (13) described. However, our findings are contrary to those of Kraft et al (16). This discrepancy may be related to the relatively small sample (13 patients, nine studies in the putamen) in their study or to differences in the mean age of their patients and in the mean duration of treatment. Another explanation may be related to the different TRs used in acquiring the spectra. In our spectra, the TR was shorter (2000 vs 3000 ms), which made our results more sensitive to changes in longitudinal relaxation times (T1) of the metabolites caused by pathology.
The presence of increased copper and iron levels in patients with WD can result in specific changes in the relaxation rates for each metabolite, according to its molecular structure and distribution. Hence, the observed differences in metabolite ratios may be related not only to changes in metabolite concentrations but also to changes in their relaxation times. Nevertheless, the fact that pathologic studies of WD show neuronal loss (30, 31) is a strong indication that the NAA/Cr reduction found in our study was related to a decrease in the concentration of NAA, a neuronal marker.
Of importance, the decrease in the NAA/Cr ratio may be partially reversible in certain diseases (12, 32, 33). Therefore, this finding may be partly due to a functional and potentially reversible neuronal disturbance, one that does not necessarily reflect cell death. Because follow-up examinations were not performed, we did not determine if the decrease in the NAA/Cr ratio has a reversible component.
The finding of a decreased NAA/Cr ratio in areas with a normal appearance on MR imaging (FWM and POC) likely indicates global involvement of the CNS in WD and suggests that the biochemical alterations seen in WD do not necessarily correspond to a structural alteration visible on MR imaging.
Another important finding was an increase in the mI/Cr ratio in the BG of patients with WD. If we assume that the mI concentration increases and that it has role as a glial marker (20), this observation may be related to the known glial proliferation observed in the BG in patients with WD. This glial proliferation is most abundant in the lentiform nucleus, with the presence of Alzheimer cells type I and type II and of Opalski cells, which have a glial origin (30). This glial proliferation may explain the increased mI/Cr ratio, and it may also explain why this increase was not observed in the FWM and POC, as these locations do not show prominent gliosis on pathology studies (31). This finding was not previously described in the literature partly because some groups performed MRS by using long TEs (14, 15), which do not permit observation of the mI peak because of the short T2 relaxation time of this metabolite.
In this study, Cho/Cr and Glx/Cr ratios were not significantly altered. Reports in the literature note that the Cho/Cr ratio can be reduced (13) or normal (16) in WD. We actually observed a trend toward an increase in the Cho/Cr ratio in the BG of patients; this may have been related to glial proliferation due to increased turnover of the cell membrane and, hence, an increase in Cho levels.
The pattern of hepatic encephalopathy, which may be a decrease in the Cho/Cr and mI/Cr ratios and an increase in the Glx/Cr ratio, was not frequently present our sample, though our patients had liver disease due to WD. This fact can be explained by the long treatment time in most patients and stability of their hepatic disease (13).
Line widths were significantly larger in the BG of patients with WD than in control subjects. This finding corroborated the hypothesis that iron and copper deposition, which is prominent in the BG of patients of WD, leads to heterogeneity of the magnetic field inside the VOI. Consequently, the peaks of the spectra were widened, though this widening did not apparently influence the spectral evaluation since spectral peaks were measured without difficulty in all patients but one (who was excluded from the study).
Line widths in the FWM and POC (where the deposition of iron and copper is not important in imaging and pathologic studies) were not significantly different between patients and control subjects.
Future studies might include follow-up analysis of the MRS spectra in patients with WD, particularly to address potential reversibility of the decreased NAA/Cr ratio. Hence, changes in the NAA/Cr ratio could possibly serve as a noninvasive index of recovery and of the effectiveness of medical therapy.
Conclusion
This relatively large sample of patients with WD had predictable changes on MRS. The most consistent abnormality was a decrease in the NAA/Cr ratio and an increase in the mI/Cr ratio in the BG. The line width in the BG was increased; a special approach for MRS must be planned to obtain good-quality spectra in this location. The findings could possibly be assigned to neuronal loss (in the three studied areas), to gliosis, and to iron and/or copper deposition in the BG.
Acknowledgments
The Magnetic Resonance User Interface software package was kindly provided by the participants of the European Union Network programs: Human Capital and Mobility, CHRX-CT94-0432 and Training and Mobility of Researchers, ERB-FMRX-CT970160.
Footnotes
Supported through multiuser project number 99/09593 of the FAPESP Sao Paulo, SP, Brazil.
References
- Received June 23, 2004.
- Accepted after revision October 12, 2004.
- Copyright © American Society of Neuroradiology


