
Abstract
BACKGROUND AND PURPOSE: By using a neonatal rat hypoxia-ischemia (HI) model, we studied the relationship between lesion volume—measured by diffusion-weighted imaging (DWI) and T2-weighted imaging (T2WI) at an early time point—and irreversible infarct volume. We also evaluated the optimal apparent diffusion coefficient (ADC) threshold that provides the best correlation with irreversible infarct size.
MATERIALS AND METHODS: Twenty-three neonatal rats underwent right common carotid artery ligation and hypoxia. MR imaging was performed 1–2 hours post-HI by using DWI and T2WI and at day 4 post-HI by using T2WI. Lesion volumes relative to whole brain (%LV) were measured on ADC maps by using different relative ADC thresholds 60%–80% of mean contralateral ADC and T2WI. Pearson correlation and multiple linear regression analysis were used to study the relationships between ln(%LV) at MR imaging and %LV at histopathology.
RESULTS: At 1–2 hours post-HI, all lesion volume measurements on DWI were significantly correlated with the infarct volume on histopathology, with the best correlation attained at the 80% ADC threshold (r = 0.738; P < .001). The estimated regression formula was %LV on histopathology = 20.60 + 3.33 ln(%LV on 80% ADC threshold) (adjusted R2 = 0.523; P < .001). Lesion volume at 1–2 hours post-HI tended to underestimate the final infarct volume.
CONCLUSION: Early post-HI MR imaging by using DWI correlates moderately well with the size of irreversible infarct, especially when measured by using a relative ADC threshold of 80% mean contralateral ADC.
Perinatal hypoxic-ischemic (HI) encephalopathy remains a common cause of chronic handicapping conditions of cerebral palsy, mental retardation, learning disability, and epilepsy.1 Multiple therapeutic trials are currently being conducted in animal models to explore various methods of interventional therapy against HI-induced brain damage, with recent breakthroughs in the demonstration of neuroprotective effect of some antiapoptosis agents 2-5 and other relative methods, such as hypothermia.6-9 Rodent models have long been established in the study of neonatal HI and have been found suitable for acute, as well as chronic, studies.10-13 At 7 days of age, brain maturation in rodents is considered compatible with that of human neonates.11,12 MR imaging can detect and monitor the early post-HI changes in the brain in vivo by using diffusion-weighted imaging (DWI) and T2-weighted imaging (T2WI) and is increasingly incorporated into animal trials for the evaluation of neuroprotective interventions in perinatal HI brain injury. The apparent diffusion coefficient (ADC), derived from DWI data, is based on detecting the abnormal motion of water in the brain and mainly indicates cytotoxic edema, whereas T2WI reflects both cytotoxic and vasogenic edema post-HI.14-17 Quantification of lesion size on MR imaging at early time points, together with knowledge of the typical temporal evolution of HI lesions, provides an opportunity to assess the effectiveness of early intervention treatment. This is important in monitoring early results in therapeutic trials and guiding the development of practical treatment protocols.
By using an established rat model of perinatal HI brain damage, we aim to determine whether an early time point of assessing acute injury will be informative of eventual infarct size. Brain lesion volumes assessed at 1–2 hours post-HI by using DWI and T2WI and at 4 days post-HI by using T2WI were compared with the infarct volume of the same animals determined by histopathology on day 10 post-HI. We also evaluated various ADC thresholds to determine the optimal ADC threshold that provides the best correlation with irreversible infarct size.
Methods
Animal Model
The experiments were approved by the university animal ethics committee according to local government legislation. Pregnant Sprague-Dawley rats were obtained approximately 1 week before parturition. Neonate rats were kept in regular light/dark cycle (lights on 8 am–8 pm) with free access to the food and water for 7 days after birth. A total of 37 7-day-old rats, averaging 12–14 g in weight, underwent unilateral ligation of right common carotid artery (double ligation followed by severing the artery in between) via a midline neck incision after anesthesia with 0.2 mL of inhalational isoflurane. The surgery usually took 3–4 minutes per rat, after which the rats were kept in an incubator for observation at 34°C for about 10–15 minutes. On regaining normal movement, they were returned to their mother for nursing for 2 hours. These rats were subsequently placed in a hypoxic chamber of 8% O2/92% N2 maintained at 34°C for 2.5 hours. Of 37 rats, 8 died (no abdominal respiration) during or after surgery and were excluded from the study.
Twenty 7-day-old rats underwent only surgical ligation without hypoxia and served as controls.
MR Imaging
We used a 1.5T GE Signa MR system with a custom-made 4-cm diameter animal microimaging coil. DWI and T2WI were performed 1–2 hours post-HI (early imaging) followed by T2WI at day 4 post-HI (late imaging).
DWI was obtained with spin-echo sequence; field of view, 5 cm × 5 cm; section thickness, 2 mm; section spacing, 0; acquisition matrix, 128 × 128; B value, 0, 1000 s/mm2; TE, 140 milliseconds; TR, 19,500 milliseconds. Acquisition time was about 10 minutes. T2WI was obtained with fast spin-echo sequence; field of view, 5 cm × 5 cm; section thickness, 2 mm; section spacing, 0; acquisition matrix, 256 × 256′; TE, 102 milliseconds; TR, 5100 milliseconds; and echo train length, 16. Acquisition time was about 6 minutes.
The animals were strapped, prostrate, on a custom-made holder to minimize head motion. Intraperitoneal injections of 80 mg/kg ketamine and 10 mg/kg xylazine were given for anesthesia. We maintained the rats at a temperature around 34°C immediately before, during, and after MR scanning. Six rats without lesions on MR imaging were presumed to have no infarction induced by HI and were excluded from the study. Therefore, a total of 23 HI rats were included in the study. After MR scanning, rats were returned to their mothers until euthanasia.
Histology
All the rats were euthanized at 10 days post-HI. Brains were removed and sliced into 2-mm-thick coronal sections, along the same plane as MR imaging sections. Triphenyltetrazolium chloride staining was performed to identify the infarcted tissue. The histologic specimens were fixed in 4% paraformaldehyde in phosphate-buffered saline (pH 7.4) at 4°C overnight. Specimen photographs were taken for measurements of lesion size.
Imaging Analysis
Lesion size on the MR images was measured by using Analyze 5.0 (Biomedical Imaging Resource, Mayo Clinic, Rochester, Minn). Lesion size was measured by using various ADC thresholds, and was defined as the area with signal intensity <60%, 70%, and 80% of the mean contralateral hemisphere intensity on the ADC map (Fig 1). On T2WI, lesion size was defined as the area with intensity higher than mean +2 × SD of the contralateral hemisphere intensity.
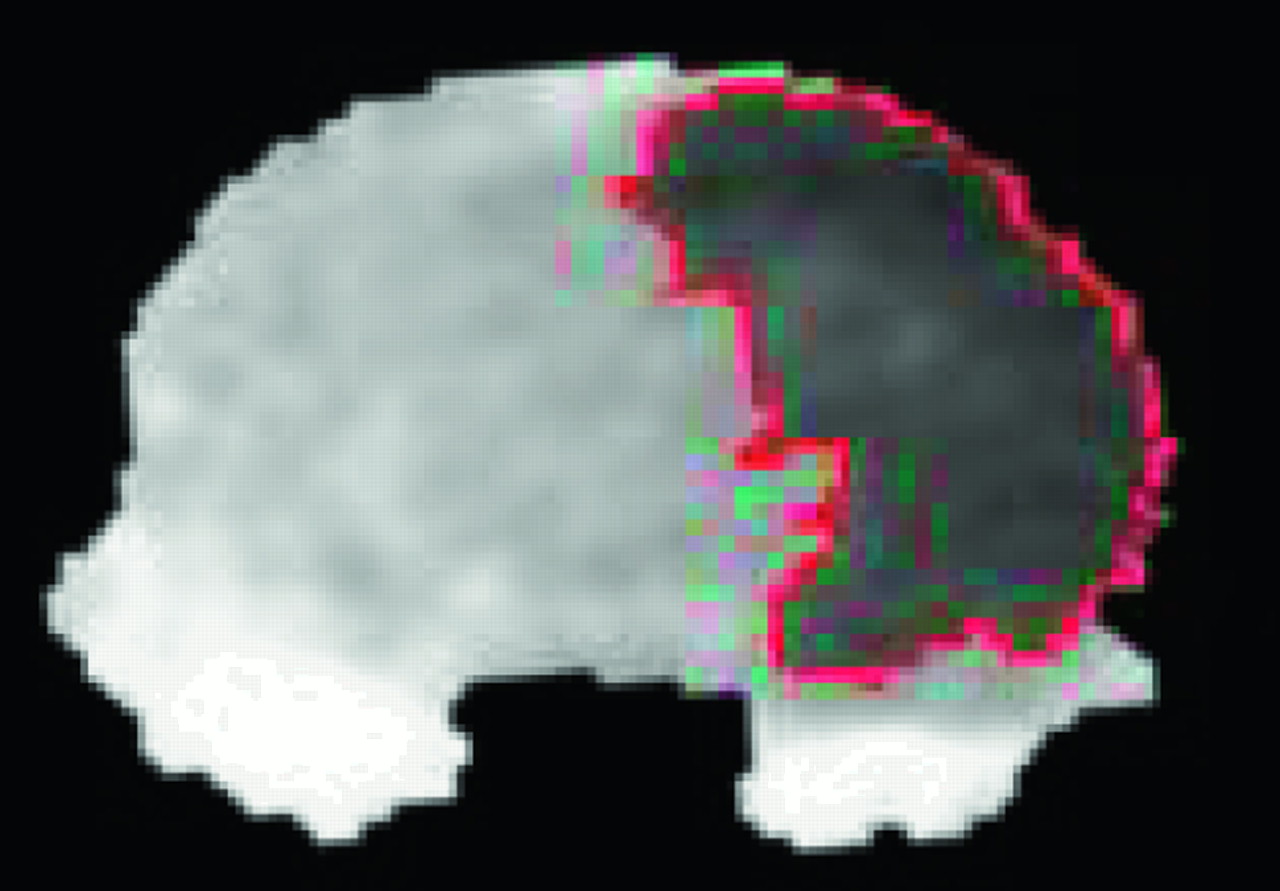
Coronal ADC map of the rat brain taken 1–2 hours post-HI shows the measurement of the area of reduced ADC by using a relative ADC threshold of 80% of the mean contralateral hemisphere ADC intensity.
Lesion size on the histologic photos was measured by using Stereo Investigator (SciTech Pte, Preston, Vic., Australia). Abnormal areas of tissue infarction are unstained, in contrast to the normal areas stained red/pink colors. To correct for the loss/shrinkage of measurable tissue on the infarction side due to liquefaction and atrophy, we defined the lesion area as the normally stained area in the contralateral hemisphere minus the normally stained area in the ipsilateral hemisphere.
Lesion volume was calculated as the sum of the lesion area across all sections, multiplied by the section thickness (ie, 2 mm). Percentage lesion volume (%LV) was calculated by dividing the lesion volume by twice the contralateral normal hemisphere volume.
Statistical Methods
By using Pearson correlations, we analyzed the relationship between %LV measured on MR imaging after natural log (ln) transformation (independent variables) and %LV at histopathology (dependent variable). The original independent variables were transformed into ln, because the results better predicted the relationship between %LV at MR imaging and histopathology. Also, the residual plots of the original data and data after ln transformation were similar. This was followed by multiple linear regression analysis with stepwise method to determine the independent variables significantly affecting irreversible infarct volume.
All statistical analyses were performed by using the statistical package SPSS for Windows (version 11.5; SPSS Inc., Chicago, Ill). A P value <.05 was considered to indicate statistical significance.
Results
MR Imaging
No control rats (n = 20; HI rats: n = 23) demonstrated lesions on early or late MR imaging.
During early imaging, %LV at 80%, 70%, and 60% thresholds of the mean contralateral hemisphere ADC ranged from 0.12% to 48.07% (SD = 14.5%), 0% to 45.82% (SD = 14.0%), and 0% to 39.03% (SD = 11.7%), respectively. %LV on T2WI ranged between 0% and 10.85% (SD = 3.5%). T2WI was negative in 15 of 23 rats, and the lesions were more extensive on DWI than on T2WI in 4 rats (Fig 2A, -B). At late imaging, %LV ranged between 1.76% and 35.01% (SD = 8.6%; Table 1).

Coronal T2WI (A) and DWI (B) sections of the rat brain at the level of the thalamus taken 1–2 hours post-HI show hyperintense areas in the right cerebral hemisphere, which are larger and more conspicuous on DWI than T2WI.
%LV using various MR imaging measurements at 1–2 hours and day 4 post-HI and %LV of irreversible infarct at day 10 post-HI
Histopathology
No lesions were seen in the histopathologic specimens of the control rats. For HI rats, %LV on histopathology ranged between 6.46% and 44.19% (SD = 28.6% ± 7.8%; Table 1).
Statistical Analysis
Pearson correlations between ln(%LV) on early imaging, late imaging, and %LV on histopathology are shown in Table 2. During early imaging, the strongest correlations with the dependent variables, %LV on late imaging, and %LV on histopathology were obtained by using the 80% ADC threshold of the contralateral mean ADC (r = 0.666, P = .001; and r = 0.738, P < .001, respectively). Multiple linear regression analysis of early imaging measurements found only the 80% ADC threshold to be a significant independent variable affecting irreversible infarct size (adjusted R2 = 0.523; P < .001). The estimated regression formula after ln transformation of the independent variables was %LV on histopathology = 20.60 + 3.33 ln(%LV at 80% ADC threshold) (Fig 3).

Scatterplot of ln(%LV on 80% ADC threshold) at early imaging versus %LV on histopathology.
Pearson correlation between ln(%LV) using various MR imaging measurements at 1–2 hours, day 4 post-HI, and %LV on histopathology at day 10 post-HI
We found that all of the MR imaging measurements tended to underestimate the final infarct size on histopathology (Table 1), especially when %LV was measured at early imaging.
Discussion
Our study was designed to explore whether MR imaging at an early time point (1–2 hours) following HI insult could be useful in predicting the severity of final infarct size. This is particularly important in clinical practice, where specific therapies may be indicated or justified only in defined severity groups. We have shown that lesion volume measured by DWI at 1–2 hours post-HI in our model indeed correlates significantly with irreversible infarct volume 10 days post insult. The correlation was moderate, however, and %LV, best measured by using a threshold of 80% of the mean contralateral hemisphere ADC, accounted for only 52% of the variance in the final infarct size. Several factors contribute here, with the main one likely the dynamic nature of early pathophysiologic evolution of insult to the brain tissue with rapid changes in intra- and extracellular water content.14,15,18-20 Second, at 1–2 hours post-HI, a component of pseudonormalization of ADC changes is known to occur. Early and transient ADC normalization has been found to commence soon after resuscitation and to be followed subsequently by secondary cytotoxic edema and delayed cell death.14,18,19,21-23 It is recognized that ischemic tissues persist, despite normalization of ADC early post-HI. Olah et al showed that water influx from vessels to brain tissue may increase the extracellular volume, thus leading to normalization of ADC in the early stages postischemia.24 Therefore, transient ADC normalization detected at this stage does not equate to histologic normalization. A recent study has shown that, at 1 hour after an HI episode, there is continued reduction in Na-K-ATPase and cytochrome oxidase activity (the final enzyme complex associated with oxidative phosphorylation in the mitochondrial respiratory chain), despite a signal intensity recovery on DWI,15 which suggests that the recovery of extracellular volume changes is independent of Na-K-ATPase activity. Third, at this early stage, some degree of reversibility in the areas with less severely reduced ADC may have occurred, as evidenced by the overestimation of infarct size in a few animals and this has also been shown elsewhere.16,17 Nevertheless, we did not find that lowering the threshold of relative ADC—and thereby measuring only areas with more severely reduced ADC—strengthened the correlation with irreversible infarct size. In a recent study of acute stroke comparing DWI and MR spectroscopy, a wide gradient of ischemia-related metabolic anomalies were found within the abnormal area delineated by DWI, which provides an explanation for the discrepancy between ADC maps and final infarct size.18
T2WI at 1–2 hours post-HI was not useful in predicting irreversible infarct volume at this early stage. This is in agreement with studies in animal HI models that have found either normal findings on T2WI in the first 3 hours of recovery19,20 or a biphasic trend with transient recovery similar to ADC changes.16,17
At day 4 post-HI, %LV on T2WI correlated significantly with irreversible infarct volume. Multiple studies have shown that, by 24 hours after an HI episode, tissue damage is well represented on both DWI and T2WI when compared with histopathology immediately after imaging.14,18,19 Most studies, however, performed euthanasia 24 hours post-HI, and none has compared the lesion size with the extent of brain injury at such a chronic stage of day 10 post-HI. It has been suggested that events that continue many days after HI may be important for the ultimate extent of brain injury.25,26 Therefore, the discrepancy in lesion size between T2WI at day 4 post-HI and histopathology at day 10 post-HI in our animals may be explained by the continual evolution of the infarct after day 4 post-HI.
We found that %LV measurements by using 80% ADC threshold at early imaging had the strongest correlation with both %LV at late imaging and histopathology, and it was the only independently significant variable affecting irreversible infarct volume. ADC threshold set at approximately 80% of the normal ADC has been found to correlate with loss of ATP and breakdown of energy metabolism in animal studies of focal cerebral ischemia both during ischemia and reperfusion.24,27,28 Our results concur with this finding and suggest that this ADC threshold may also apply to HI injury.
Conclusion
In our animal model, we found that a significant correlation exists between %LV measured by DWI at the early stages post-HI (1–2 hours) and irreversible infarct, with the strongest correlation obtained when %LV was measured by using ADC threshold of 80% of the contralateral mean ADC. These findings have important implications for in vivo MR imaging assessment of neuroprotective therapies and in assisting therapeutic decision-making in the neonatal rat HI model.
Acknowledgments
We thank all the radiographers in the MR imaging unit of Queen Mary Hospital and staff at the laboratory animal unit of the University of Hong Kong.
Footnotes
This study was supported by the Committee in Research and Conference Grants grant, the University of Hong Kong.
References
- Received March 2, 2005.
- Accepted after revision June 1, 2005.
- Copyright © American Society of Neuroradiology


