
Abstract
SUMMARY: A short echo time (30 milliseconds) MR spectroscopic imaging pulse sequence was implemented for applications of neonatal brain imaging. Multiple spatial saturation bands were used to eliminate strong signals originating from the subcutaneous lipids to enable volumetric region coverage. Metabolite signal intensity–to-noise ratio ≤40 was acquired in 9 minutes of scan time over an 8 × 8 × 8 spatial matrix with 1 cm3 isoresolution.
MR spectroscopy has been shown to be useful in providing clinically important assessment of neonatal brain metabolism.1–3 Metabolite concentration levels have also been studied with MR spectroscopy during early brain development to better understand the rapidly ongoing biochemical changes that occur at this stage of life.4–6 Several studies have used MR spectroscopic imaging (MRSI) for neonatal and pediatric imaging applications.7,8 Although single-voxel MR spectroscopy techniques have been successfully implemented in both long echo time (TE; >130 milliseconds) and short TE (<40 milliseconds) acquisitions, MRSI methods have mainly been limited to long TE studies for reasons of technical feasibility. In this study, we demonstrate the applicability of a short TE MRSI sequence, targeted for neonatal brain examinations, by using a newly derived short TE MRSI protocol to acquire volumetric datasets from a group of neonates.
Description of Technique
All studies were performed on a 1.5T Signa EchoSpeed system (GE Healthcare, Milwaukee, Wis) by using an MR imaging–compatible incubator with a specialized neonatal head coil.9 For the MRSI acquisition, the TE was set to 30 milliseconds with a repetition time of 1 second. An 8 × 8 × 8 voxel phase-encoding scheme was used to collect the data. The effective voxel size was kept at 1 cm3 with isotropic resolution. Very selective saturation pulses were placed to eliminate signals from subcutaneous lipids.10 Three saturation pulses were played out per band at 6 different locations for a total of 18 saturation pulses providing robust saturation. To reduce eddy current effects from crusher gradients commonly encountered in short TE imaging, the length of the crusher gradients was shortened to 2.5 milliseconds. This shortening resulted in a crusher gradients area of 67 mT/m milliseconds, which is within the range suggestive for in vivo spectroscopy.11 Phantom studies with these set of crushers showed neither significant eddy current induced artifacts nor spurious echoes because of simulated echoes.
Short TE MRSI data were acquired from 10 neonates who had MR imaging examinations as part of a neonatal study protocol. The study protocol was approved by our institutional review board, and parental consent was obtained for all infants. Of these neonates, 4 were born prematurely and were studied at adjusted ages (gestational age added to postnatal age) between 27 and 34 weeks (mean at study, 30.5 ± 3.2 week). Six neonates born at term were imaged because of suspected neurologic damage from congenital heart disease; the mean corrected age for these infants at the time of the MR study was 41 ± 1.4 weeks. Sedation was performed by using pentobarbital (Nembutal) only after parental consent and only when necessary (eg, when the baby woke up and started moving). As a result, only those infants with congenital heart disease required sedation. To validate the technique, quantitative analysis was performed by using the linear combination model-fitting procedure and metabolites from the premature group and term births were compared.12
Results and Discussion
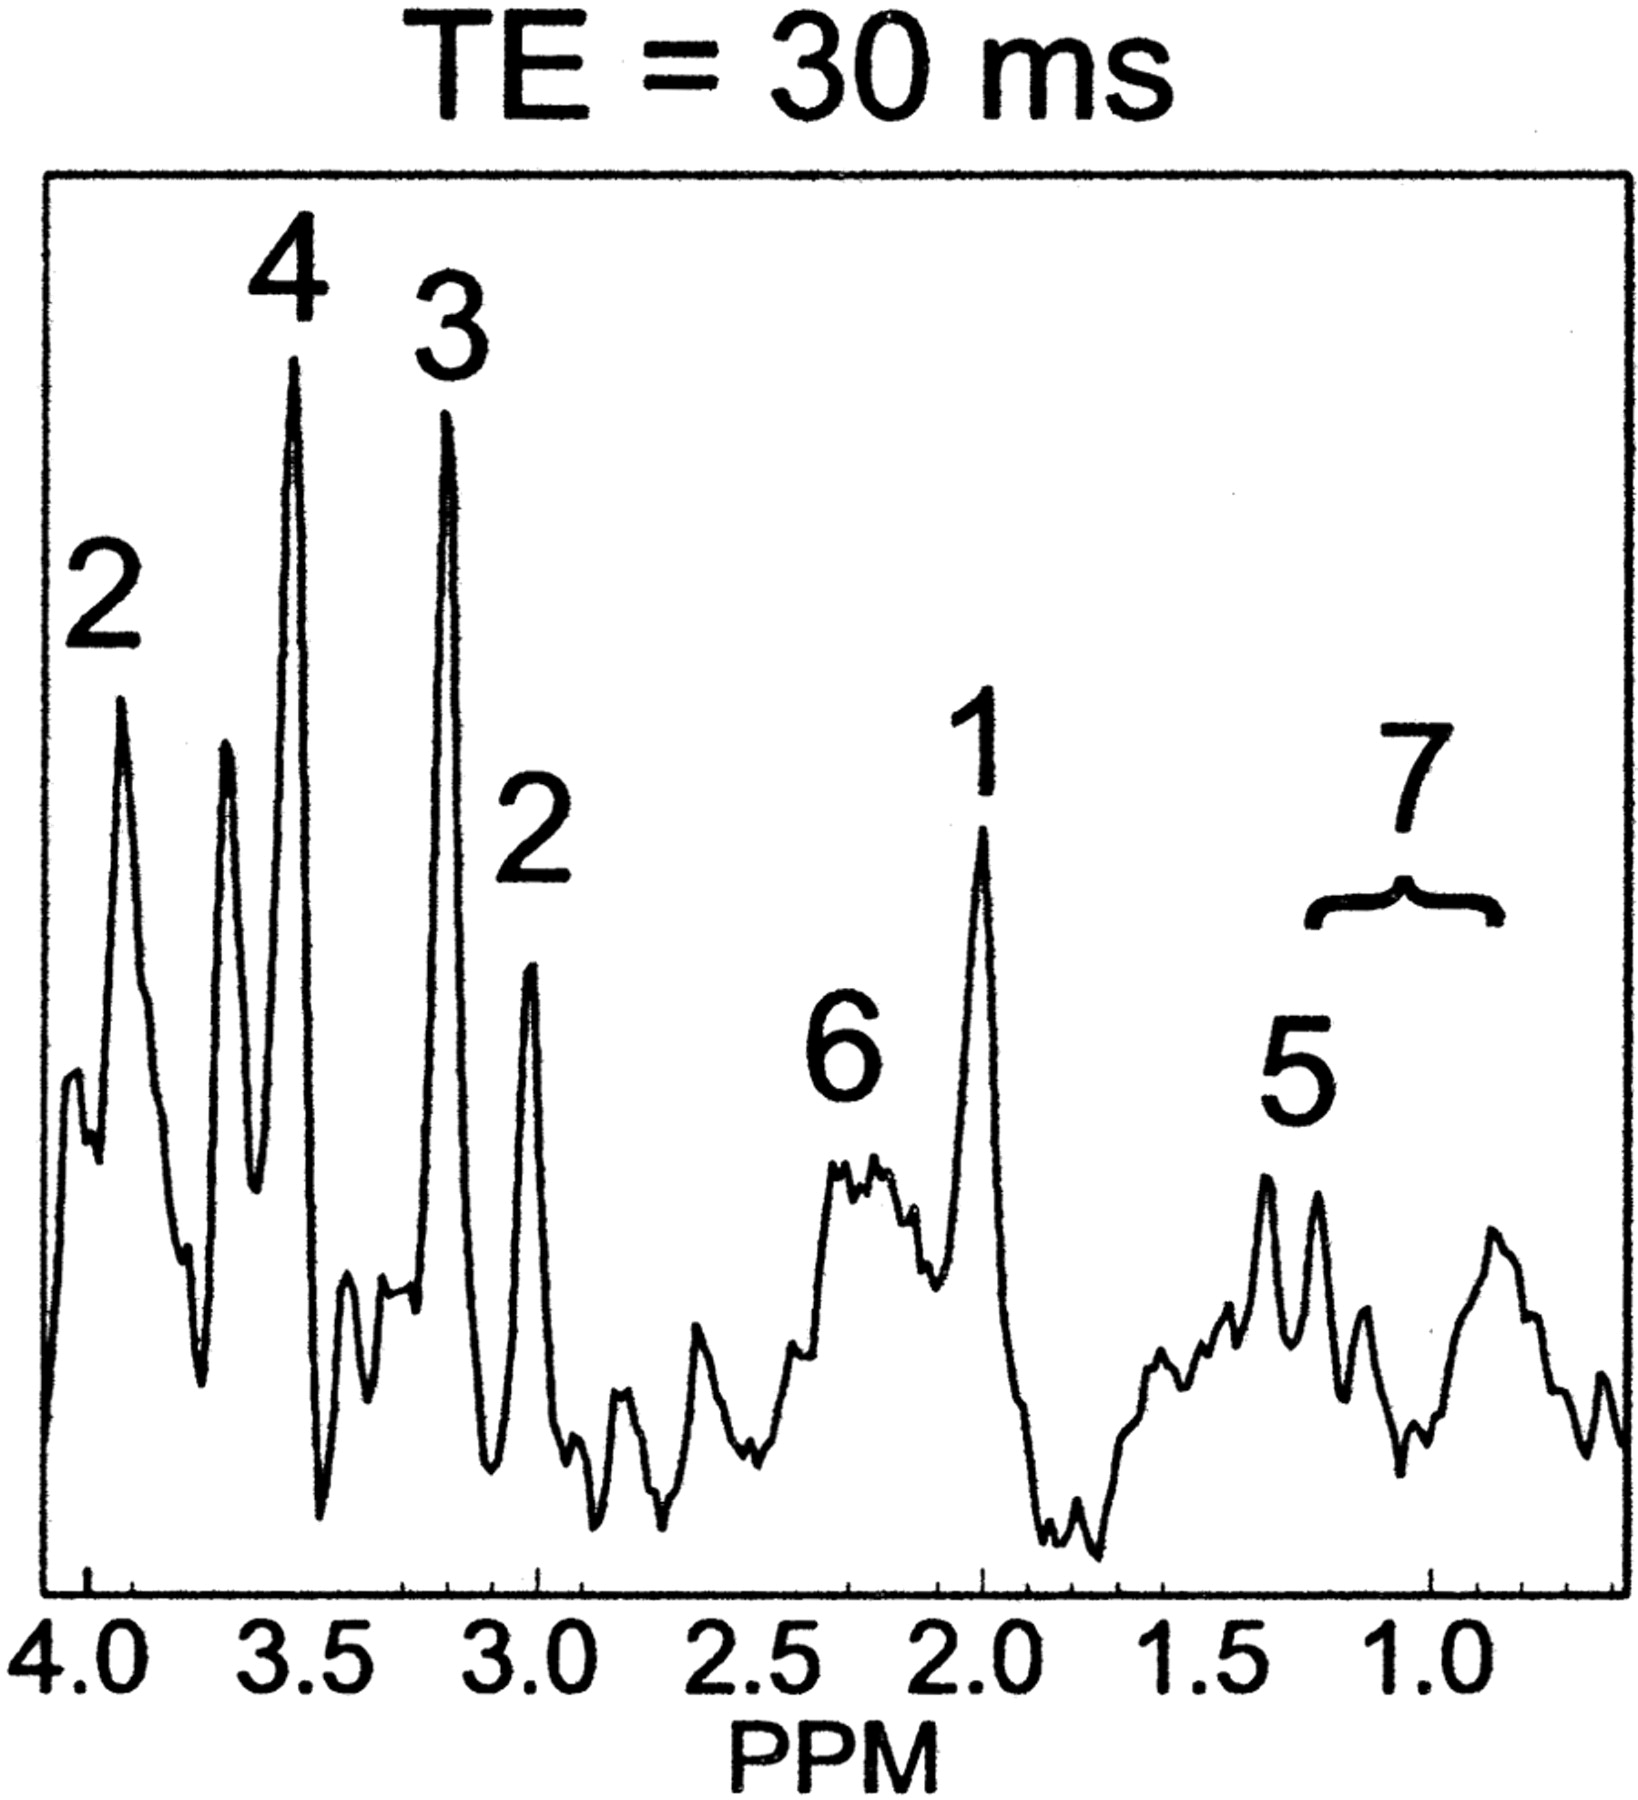
Figure 1 shows volumetric spectra obtained from a 31-week age-adjusted premature neonate. Four representative sections of spectroscopic data are shown along with the anatomic images. Spatially varying metabolite components can be seen. In general, individual metabolite levels are higher near the deep gray matter, which is in agreement with previous studies of early brain development. An analysis of the signal intensity–to-noise ratio (SNR) of the choline (Cho) peak showed values ≤40. The metabolite assignments of each peak are given in Fig 2, which was extracted from the emphasized voxel in Fig 1. Metabolites such as myo-inositol (mIns) and glutamate/glutamine (Glx) can be seen in addition to the metabolites normally observed for long TE acquisitions. The lactate (Lac) doublet peak at 1.3 parts per million (ppm) is well illustrated, though care must be taken in the interpretation because this region contains signal intensity contributions from macromolecules as well. Macromolecules also occupy small portions of the 2.3-ppm region whereas glycine overlaps with the mI molecule at 3.15 ppm.13 The Lac doublet peak was well resolved for several of the preterm infants, which confirmed previous observations of Lac in the white matter for premature infants.14

Volumetric dataset from a preterm neonate imaged at 31-week adjusted age. Shown are the T2 weighted images along with the spectra between the 4.0–1.0-ppm region. Regional variation is seen with the highest metabolite levels within the deep gray matter.

Representative spectra from a voxel in Fig 1. The labeled metabolites correspond to (1) NAA, (2) Cr, (3) Cho, (4) mIns, (5) Lac, (6) Glx, and (7) macromolecular baseline in the 2.0–1.0-ppm region.
Figure 3 shows representative short TE spectra typically obtained from the labeled regions for a prematurely born infant and a term infant. In general, the level of metabolites followed the previously described maturation process, with the deep gray matter maturing early and the frontal and temporal white matter maturing last. High levels of mIns were seen in the calcarine gray matter for premature infants. This is particularly interesting because topologic and temporal changes of mIns have not been well studied. mIns and its transporter are believed to play an important role in normal fetal brain development, though reasons for the elevated mIns in the neonatal brain and its function are not well understood. Previous studies in neonatal encephalopathy suggest increased mIns metabolites in the basal ganglia region.15 A clear benefit of the short TE sequence is the ability to help understand the function and distribution of these short T2 components.

Spectra extracted from a 33-week and a 40-week age-adjusted infant. Corresponding regions are indicated for the spectra. In general, the deep gray matter regions show higher metabolite levels indicating earlier development. Note the high levels of Cho in all spectra, which is typical of neonates. Finally, note the elevated mIns level in the calcarine gray matter of the 33-week baby.
Finally, Table 1 shows quantitative metabolite ratios obtained. Statistically significant differences were mostly obtained from regions in the deep gray matter corresponding to rapid changes in these regions. Elevated Cho/creatine (Cr) ratios were seen in preterm births in comparison with term births in regions of the basal ganglia, thalamus, and calcarine gray matter (P < .005). Decreases in the Cho concentration in this age group have been documented elsewhere.6 Elevated mIns/Cr ratios were also seen in the basal ganglia, thalamus (P < .005), and the frontal white matter (P < .05), which illustrates mIns decreasing with age. Overall, N-acetylaspartate (NAA) values increased with age suggestive of increased neuronal activity. No significant differences were found for Glx.
Quantitative metabolite ratios for preterm neonates (group 1) and term infants (group 2)
This study shows the feasibility of acquiring 3D MRSI data from most parts of the neonatal brain at a 1 cm3 nominal spatial resolution with an TE of 30 milliseconds in 9 minutes. The ability to robustly acquire short TE spectra from the brain has great potential in helping to understand regional and temporal variations of long and short T2 metabolites during normal brain development and in helping to diagnose causes of abnormal development. The use of repeated saturation pulses to eliminate lipid signals is a significant factor, because aliasing artifacts can be dramatically reduced.
To verify the technical feasibility, quantitative analysis, and statistical comparisons were performed for 2 groups—premature and term-born infants—which showed metabolite distributions in accordance with previous studies. Because the patients examined were not completely normal, however, these numbers should not be considered normative data. Indeed, even if early development of the patients were normal, it is likely that premature birth and congenital heart defects both have some effect on normal brain development. Previous studies of infants with congenital heart disease have indicated reduced NAA/Cho ratios compared with age-matched controls for these infants.16 These effects must be taken into consideration if the results were to be used for clinical diagnosis.
Acknowledgments
This study was supported by grants from the National Institutes of Health (NIH R01 NS40117 and NIH R01 NS046432). This study was carried out in part in the Pediatric Clinical Research Center, University of California, San Francisco, with funds provided by the National Center for Research Resources (5 M01 RR-01271), US Public Health Service.
References
- Received January 4, 2006.
- Accepted after revision January 9, 2006.
- Copyright © American Society of Neuroradiology


