
Abstract
PURPOSE: Our aim was to study the fractional anisotropy (FA) variations and the fiber tracking (FT) patterns observed in patients with myelitis.
MATERIAL AND METHODS: Fifteen patients with symptomatic myelitis and 11 healthy subjects were prospectively selected. We performed T2-weighted and diffusion tensor imaging on a 1.5T MR scanner. FA and apparent diffusion coefficient maps were computed in both healthy subjects and patients. In each patient, we performed FT to study pathologic aspects on this imaging method. FA data were analyzed by using z-scores.
RESULTS: For the healthy subjects, averaged FA values ranged from 0.745 to 0.751. All abnormal areas seen on T2-weighted imaging had a significantly decreased FA value. In 9 patients (60%), FA maps showed decreased FA areas, whereas T2-weighted imaging findings were normal. These areas matched the neurologic deficit in 33%. Eighty percent of patients had multiple decreased FA areas. Five patients (33%) had increased FA values in normal T2-weighted areas.
CONCLUSION: We observed specific FA and FT pattern variations in patients with myelitis.
Myelitis represents a heterogeneous group of disorders with various etiologies, such as viral or bacterial infections, autoimmune disorders, and multiple sclerosis. It can result in disabling motor and sensory dysfunctions. Diagnosis depends on clinical manifestations, blood or CSF study, and MR imaging findings.1
MR imaging is first required to rule out spinal cord compression and is a support for initial diagnosis; then it is used to assess treatment efficacy in the follow-up. When the spinal cord is involved, MR imaging shows abnormal signal intensity on T2-weighted imaging sequences. However, MR imaging findings can be normal, whereas diagnosis is established on the basis of clinical and biologic abnormalities.2 Preliminary studies3–4 previously assessed the feasibility of MR imaging spinal cord studies by using diffusion-weighted imaging (DWI) and diffusion tensor imaging (DTI). DTI is an MR imaging technique that evaluates the scalar properties of the diffusivity of extracellular water molecules within the white matter fibers5 and enables the reconstruction of 3D images of white matter tracts in the spinal cord6 by using specialized fiber tracking (FT) algorithms. Fractional anisotropy (FA), a parameter derived from DTI computations, reflects the global anisotropy of the analyzed structure. FA values depend on the water diffusivity in the extracellular space along the axon fibers. Parameters like myelination and axonal membrane thickness and changes in extra- or intracellular components can affect FA values. The closer to 1 the FA value is, the more anisotropic is this structure.
In the spinal cord, decreased FA values may be related to an increase of the extracellular space (dysmyelination, axonal loss, unpacking of white matter fibers, and so forth) as well as a decrease of the intracellular space (edema). It has been previously reported that DTI with FA computation is more sensitive than T2-weighted imaging in multiple sclerosis to detect white matter involvement.7 We, therefore, studied the FA variations in patients with myelitis and tried to assess FT 3D reconstructions to locate the lesions precisely.
Materials and Methods
Subjects
Fifteen patients (6 women, 9 men; ages ranging from 20 to 64 years of age; mean age, 42.9 years), referred to our institution from the neurology department, were prospectively selected between May 2004 and October 2004. The inclusion criterion was a clinical diagnosis of myelitis (complete patient history, biologic features like CSF and serum analysis, and neurologic deficit compatible with medullar involvement). Exclusion criteria were the following: the presence of spinal cord compression, previous spine surgery, spine radiation therapy, or contraindication to MR imaging. Myelitis etiologies were the following: multiple sclerosis (9 patients, 60%), neurosarcoidosis (3 patients, 20%), transverse myelitis (2 patients, 13%), polyradiculoneuritis (1 patient, 7%). Five patients (33%) had acute or subacute symptoms (for <3 weeks). As a control group, we used the DTI datasets of previously enrolled healthy volunteers8 (8 men, 3 women; ages ranging from 20 to 67 years; mean age, 36.7 years). Our MR imaging protocol was approved by our institutional board, and all patients gave informed consent.
MR Imaging Technique, Image Analysis, and Fiber-Tracking Procedure
We used MR imaging techniques similar to those previously reported,8 except for the DTI directions, which were 25 instead of 6. Image analysis and FT procedures remained unchanged. On the healthy volunteers, we tested 4 b values (300, 500, 750, and 1000 s/mm2) to assess the feasibility of the FT reconstruction for each b value. The software we used (DPTools, http://www.fmritools.org) had thresholding FA values of 0.17 and a transition angle of 45°.
Measurements
In healthy volunteers and patients, apparent diffusion coefficient (ADC) and FA measurements were made at 3 different levels (cervical, C2 through C5; high thoracic, T1 through T6; and low thoracic, T7 through T12) by using regions of interest (ROIs, averaged area = 20 mm2; 10 voxels) on the spinal cord and the most accurate bo image and then were reported on FA maps. Special attention was paid to avoid partial CSF volume effect, magnetic susceptibility effects, and motion artifacts in ROI selection. A reference data base was created with pooled FA spinal cord measurements at different levels. The ROIs in patients and healthy volunteers were matched in size.
Two neuroradiologists independently assessed the presence of abnormal hyperintense areas on T2-weighted images and performed ADC and FA measurements on the patients’ spinal cords. ADC and FA measurement variations were compared between the 2 neuroradiologists to assess interobserver variability and were repeated to assess intraobserver variability. Complementary ADC and FA measurements were made at the precise site of myelitis seen on bo images (and correlated to T2 images (Fig 1). When no abnormality was seen on these images, we set the ROI on the spinal cord level that matched the neurologic deficit. FT 3D reconstructions were coregistered on bo and then on FA parametric maps by using our dedicated software.8
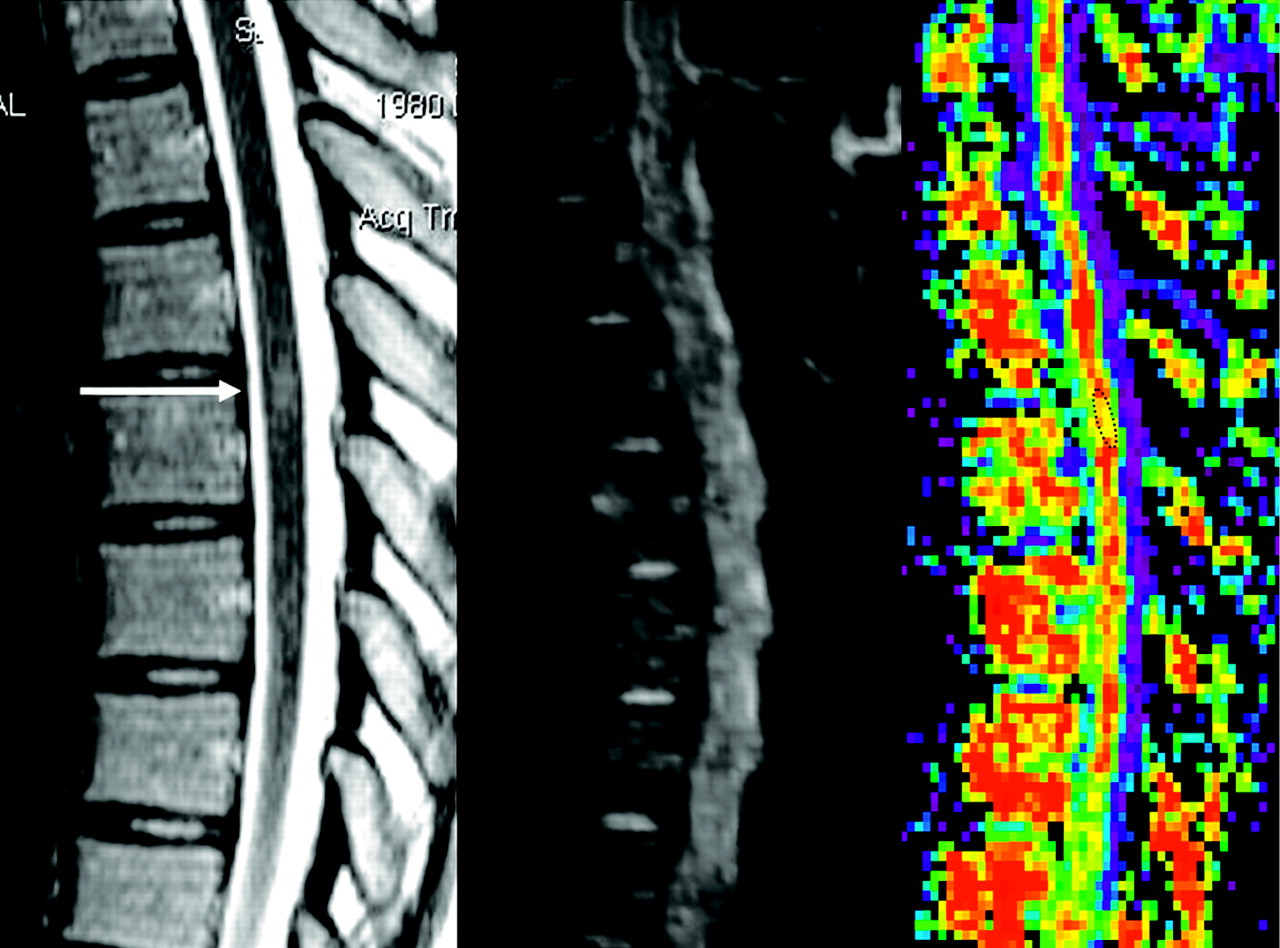
T2-weighted bo image and FA map in the same patient. The lesion was not visible on bo images, and we used T2-weighted images to set the ROI (FA = 0,58). Arrow indicates ADC and FA areas.
Statistical Analysis
Analyses were performed by using SPSS software (SPSS, Chicago, Ill). Data of healthy volunteers and patients were described by using mean, SD, and minimal and maximal values for quantitative variables. We first calculated the mean FA for cervical, high thoracic, and low thoracic spinal cord levels in all the healthy volunteers. Then we measured the FA in patients at lesion level and computed z scores by using the mean and SD values obtained in volunteers at the same level. Abnormal values were those of z > 1.96 (P < .05).
Results
The results for healthy volunteers are reported in Table 1. In healthy volunteers, normal ADC values ranged from 0.96 × 10⁻³ mm2/s to 1.05 × 10⁻³ mm2/s, and normal averaged FA values ranged from 0.745 to 0.751. The results for patients are reported in Tables 2–5. There was a statistically significant difference between FA measurements performed at the myelitis site (Z-score = 5.9) in healthy volunteers and patients.
Comparison of FA values according to medullar level in healthy volunteers
Selected patient data
Patients’ results with estimate of fractional anisotropy
Average fractional anisotropy (FA) values in patients in the normal and abnormal spinal cord areas
T2-weighted imaging observed in patients and volunteers
All patients (100%) had 1 (100%) or multiple (80%) focal areas of decreased FA values (mean value, 0.59 ± 0.089), but only 12 patients (80%) had abnormal T2-weighted imaging areas. In 5 of these 12 patients, clinical manifestations matched abnormal areas seen on T2-weighted imaging. Nine patients had decreased FA value areas that were normal on T2-weighted imaging but matched the clinical deficit in 3 of the 9 patients. Five patients (33%; 3 with multiple sclerosis, 1 with polyradiculoneuritis (PRN), and 1 with sarcoidosis) had increased FA values in normal T2-weighted areas. None of these areas matched the neurologic deficit. These areas were either adjacent to the lesions seen on FA maps or far from these lesions.
ADC and FA measurement variations had a good intra- and interobserver (2 neuroradiologists performing ROI positioning 4 times independently) reproducibility (±5% in both cases). ADC was increased in 1 patient with multiple sclerosis, decreased in 3 patients (1 multiple sclerosis, 1 PRN, and 1 sarcoidosis), and was normal in 1 patient with multiple sclerosis. In 2 of these 3 patients with increased FA and decreased ADC (67%), clinical manifestations were acute. The last patient had intensive immunosuppressive therapy. When increased and decreased FA areas were situated side by side, ADC was high or normal. When these areas were far from each other, ADC was low (Fig 2).

ADC variation patterns and increased FA area locations. MS indicates multiple sclerosis.
Fiber tracking performed on the spinal cord showed the main white matter tracts (posterior corticospinal tracts with nerve root visualization and posterior cordonal tracts) in all healthy volunteers and patients (Fig 3). FT showed spreading fibers in the spinal cord areas that were abnormal on the T2-weighted imaging and in the areas that were normal on the T2-weighted imaging but had abnormal FA values (Fig 4). In 3 patients, FT also showed fiber interruption in these areas (Fig 5).

3D FT reconstruction of the cervical cord in a healthy subject.
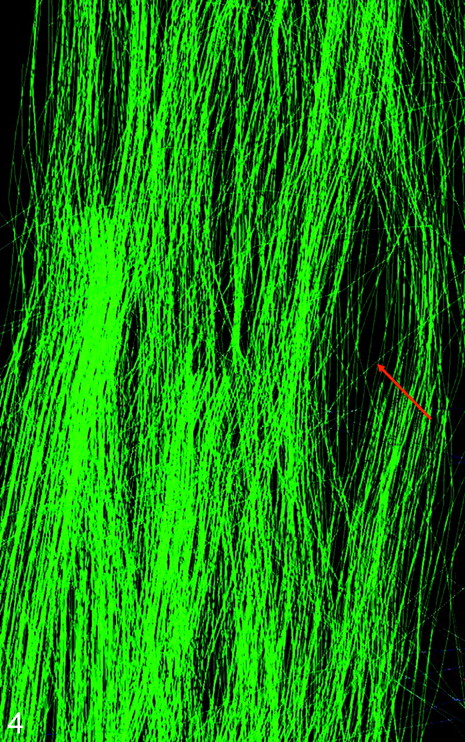
3D FT reconstruction of a patient’s cervical cord shows spreading fibers (red arrow).
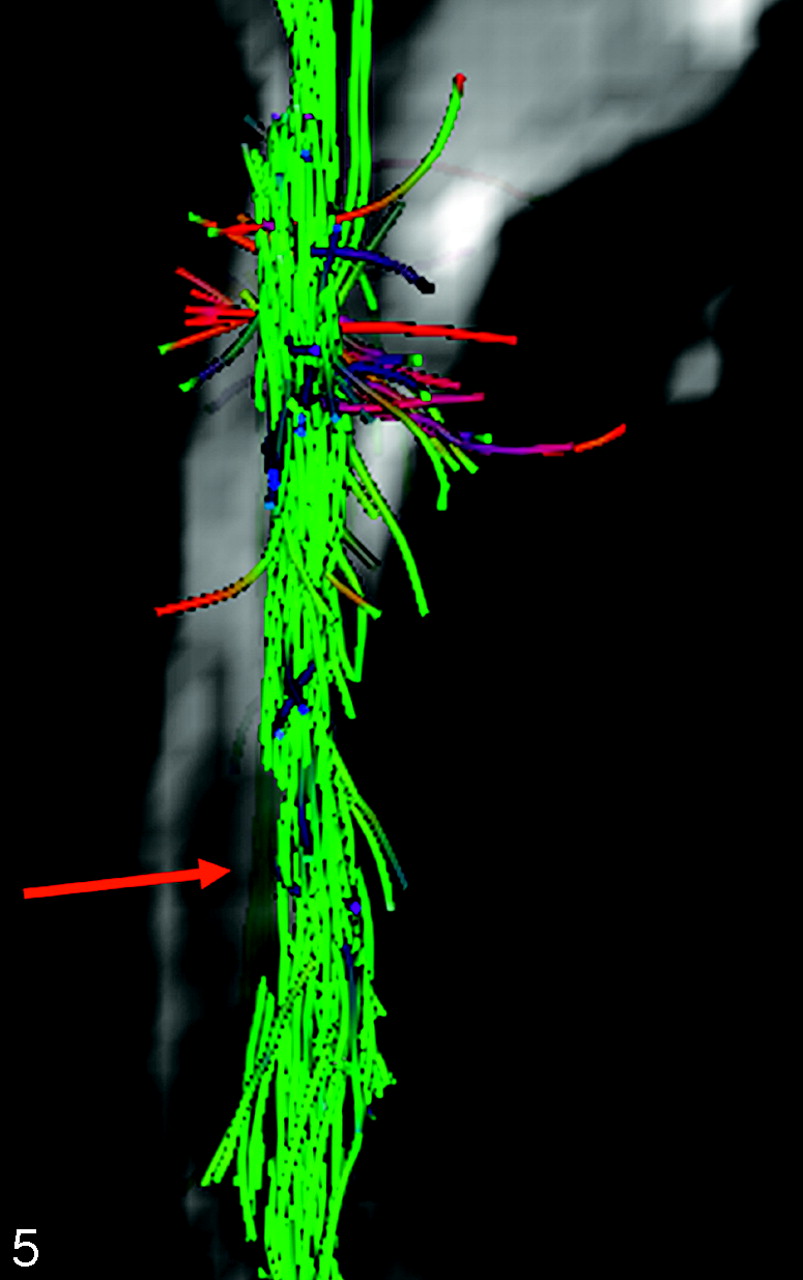
3D FT reconstruction of a patient’s cervical cord shows the “broken” fibers (red arrow) aspect.
We found that b values above 500 yielded altered 3D FT reconstructions (with many holes in the white matter tracts) due to the high-signal-intensity attenuation. Values below 500 had too many T2 shinethrough effects and yielded aberrant white matter tracts.
Discussion
The diagnosis of myelitis is usually assessed on the basis of clinical data, and MR imaging shows the white matter tract involvement. This T2-weighted evidence is inconstant, and previous studies reported MR imaging to have a low sensitivity index for the detection of spinal cord myelopathies.2
DTI MR imaging performed in spinal cord diseases has been reported to improve the diagnostic sensitivity of chronic spinal injury.8–10 To our knowledge, no one has studied the FA variations in myelitis, regardless of the fact that the FA parameter has the advantage of a better directional evaluation of water diffusivity (due to its scalar information) in abnormal areas, as previously reported in brain diseases.11
In our study, we decided to investigate the use of this parameter in myelitis. In the spine, surrounding bone causes susceptibility artifacts. DTI MR imaging yields voxel signal-intensity attenuation on the DWI. The higher the b value is, the higher is the signal intensity attenuation. Among the 4 b values we tested, b values above 500 yielded altered 3D FT reconstructions (with many holes in the white matter tracts) because of the high-signal-intensity attenuation. Values below 500 had too many T2 shinethrough effects and yielded aberrant white matter tracts. We, therefore, concluded that b value of 500 was the most accurate for FT purposes.
Previous studies, centered only on the cervical spine in healthy volunteers,3,12 reported FA values ranging from 0.52 to 0.83.4,12 The FA values we found matched and supplemented these results because we reported values from the cervical to the lower thoracic spine. In setting ROIs, we had to pay special attention to avoid partial volume effects due to the CSF around the spinal cord, which, when included in ROI, may have decreased the FA values. A specialized segmentation algorithm, which could automatically separate spinal cord from CSF, would have enabled us to perform the measurements faster and to reduce the problem of partial volume effects of the ROI method, but we unfortunately lacked such software. To avoid the CSF pitfall, we had to draw ROIs over both gray and white matter inside the cord; therefore, the values we reported were gray and white averaged FA values. Spinal white matter fibers have a craniocaudal orientation and thus are very anisotropic, contrary to gray matter, which is more isotropic. FA values reflect the global anisotropy of an analyzed structure. The closer to 1 the FA values, the more anisotropic is the structure; conversely, the closer to 0 the FA values, the more isotropic is the structure. When compared with values reported in experimental studies that found 0.92 in white matter and 0.59 in gray matter,13 our results corresponded to the average of these 2 components, ROIs covering both gray and white matter.
The FA parameter has a good sensitivity of 80%8 to detect abnormal areas inside the cord and is even better than conventional T2-weighted imaging; this finding confirms results from previous studies8 and is probably due to a complete evaluation of the water diffusivity by using scalar properties of the DTI sequence. All patients had decreased FA values, suggesting either local extracellular edema or a decreased number of fibers that matched an increased extracellular space or both.
Nevertheless, we observed increased FA values in 5 patients with myelitis. To our knowledge, this has never been reported, even in experimental studies, but may be due to modifications of the extracellular compartment. These data suggest either intracellular edema with inflow of the extracellular water in axon or in Schwann cells or suggest decreased extracellular space due to cellular infiltration by inflammatory cells. In our study, areas with increased FA never corresponded to the lesions and were adjacent to them or far from them. ADC assessment showed an increased or normal extracellular space in 2 patients with multiple sclerosis and a decreased one in the other patients, maybe due to the wallerian degeneration,14 in which a reduction of the extracellular space may be observed when the Schwann sheath gets thicker after axonal degeneration or when clusters of regeneration appear. A time gradient may exist in myelitis, with early decrease of extracellular space far from the lesion and normalization at the chronic phase. Larger studies focused on that point would clarify these findings.
Experimental studies15 have highlighted the usefulness of FA parameters to assess response to a neuroprotective therapy. These data suggest that FA and ADC values correlated with clinical history could help distinguish old and active lesions, to decide whether treatment is necessary or to assess its efficacy.
This study emphasizes some specific aspects of myelitis and may help with diagnosis: Multiplicity of the lesions (some of them are not seen on the regular T2-weighted imaging) is the main indication (we found more than 1 lesion in 80% of the patients). Patients with increased FA areas away from and next to the lesions have never been described in other studies and may correspond to a specific pattern of multiple sclerosis. We used fast spin-echo T2-weighted imaging as a reference standard to assess the number and the location of spinal cord lesions, but we should have used other imaging techniques (such as short τ inversion recovery [STIR] or gradient-echo T2-weighted imaging) that are known to be more accurate in detecting lesions. It would have been interesting to correlate FA lesion-detection capabilities with STIR, for example. This may be done in a future work.
FT seems to be more than just a visualization tool of the white matter tracts inside the spine. Anatomic correlations with corticospinal and lemniscal pathways are excellent. Moreover, it can readily be used in clinical routine to view the inflammatory tracts and can help establish a positive diagnosis of spinal cord anomaly by locating the precise pathologic area. Our material allowed a qualitative study on FT, but we could not find any objective pathologic criteria. Therefore, we only reported the different aspects seen on pathologic areas.
Interrupted fibers on FT maps corresponded to FA values below 0.17 or a rupture angle of 45°, and this aspect did not mean that fibers were actually interrupted. We believed that the other aspect with spreading fibers corresponded to edema, but we did not have any objective proof. This hypothesis has to be explored by further studies.
Current research on the brain using DTI is performed with >25 gradient directions.16 Adding gradient directions may help improve the scalar sampling of water diffusivity and may correct some known pitfalls of the echo-planar imaging sequence on 3D reconstructions.16 Despite these drawbacks, the images we obtained were of sufficient quality to analyze FA variations in myelitis, and FT helped us see the precise site of involvement and make a positive diagnosis.
Conclusion
In this study, we found that FA detected spinal cord abnormalities in patients with myelitis better than T2-weighted imaging. Moreover, we found specific patterns of myelitis with DTI because it showed other pathologic areas not seen with routine imaging. This finding derived from DTI MR images may help assess the positive diagnosis. Larger studies are needed to better understand the pathophysiology of FA variations in myelitis. Spinal cord FT enables the visualization of the main white matter tracts in the spinal cord and shows involved areas that are otherwise invisible. It could become a useful tool to visualize diseases from nerve root to brain.
References
- Received November 18, 2005.
- Accepted after revision January 2, 2006.
- Copyright © American Society of Neuroradiology
In this issue


Jump to section
Related Articles
Cited By...
- Cervical Spinal Cord DTI Is Improved by Reduced FOV with Specific Balance between the Number of Diffusion Gradient Directions and Averages
- Pulse-Triggered DTI Sequence with Reduced FOV and Coronal Acquisition at 3T for the Assessment of the Cervical Spinal Cord in Patients with Myelitis
- Assessment of spinal somatosensory systems with diffusion tensor imaging in syringomyelia
- Comparison Between Diffusion Tensor Imaging and Conventional MR Imaging Sequences in the Detection of Spinal Cord Abnormalities