
Abstract
BACKGROUND AND PURPOSE: To establish intraobserver and interobserver variability for regional measurement of CT brain perfusion (CTP) and to determine whether reproducibility can be improved by calculating perfusion ratios.
MATERIALS AND METHODS: CTP images were acquired in 20 patients with unilateral symptomatic carotid artery stenosis (CAS). We manually drew regions of interest (ROIs) in the cortical flow territories of the anterior (ACA), middle (MCA), and posterior (PCA) cerebral arteries and the basal ganglia in each hemisphere; recorded cerebral blood volume (CBV), cerebral blood flow (CBF), and mean transit time (MTT); and calculated ratios of perfusion values between symptomatic and asymptomatic hemisphere. We assessed intraobserver and interobserver variability by performing a Bland-Altman analysis of the relative differences between 2 observations and calculated SDs of relative differences (SDDrel) as a measure of reproducibility. We used an F test to assess significance of differences between SDDrel of absolute CTP values and CTP ratios, and the Levine test to compare the 4 perfusion territories.
RESULTS: MTT was the most reproducible parameter (SDDrel ≤ 10%). Intraobserver and interobserver variability were higher for absolute CTP values compared with CTP ratios for CBV (16%–17% versus 11%–16%) and CBF (18% versus 10%–13%) but not for MTT (5%–9%). Reproducibility was best in the MCA territory: SDDrel was ≤11% for perfusion ratios of all 3 parameters.
CONCLUSION: MTT is the most reproducible CTP parameter in patients with unilateral symptomatic CAS. Measurement variability in CBV and CBF can be improved if CTP ratios instead of CTP values are used. The MCA territory shows the least measurement variability.
CT perfusion (CTP) is a widely available diagnostic tool that provides quick and minimally invasive assessment of brain perfusion.1, 2 Its main current use is to identify patients with acute stroke who may benefit from thrombolysis by discriminating penumbra (tissue with reduced perfusion but potentially salvageable) from irreversible ischemia. CTP has also been used for other kinds of cerebrovascular disease: to predict delayed ischemia in patients with subarachnoid hemorrhage,3 to measure the reserve capacity in patients with carotid occlusive disease using acetazolamide,4 and to evaluate the effect of endovascular treatment.5
Analysis of CTP can be based on visual interpretation of perfusion maps or on quantitative perfusion measurements. Visual interpretation relies on the analysis of color-coded perfusion maps, where regions with reduced perfusion can be detected by visual comparison with the surrounding tissue or the contralateral hemisphere.6, 7
Quantitative analysis can be performed using a pixel-by-pixel analysis or by measuring average values in regions of interest (ROIs) in various anatomic perfusion territories of the brain. The pixel-based analysis is applied in acute stroke, where a threshold value has been suggested to distinguish between infarcted and potentially salvageable tissue.8 Regional analysis using ROIs can rely on manual tracing of anatomic regions9, 10 or on placing circular ROIs.11, 12 ROIs can be mirrored to compare the affected to the nonaffected hemisphere.
Quantitative measurements are complicated by the large variability of absolute perfusion values found in normal subjects and clinical patients.13 This variability makes the discrimination between normal and reduced perfusion difficult. Several authors have therefore suggested using relative perfusion data based on the ratio between measurements in the symptomatic and asymptomatic hemisphere.14–16 This method takes advantage of the basic symmetry of the brain and may correct for interpatient variability of absolute perfusion values.
CTP is becoming a widely used tool for analyzing brain perfusion,17, 18 even though measurement variability (precision) is in the range of 15%–30% when ROI-based techniques are used.12 This is due to observer-dependent postprocessing steps, which can strongly influence absolute perfusion values.19–21 Several of these observer-dependent steps are likely to affect both hemispheres equally. The goal of our study was to examine whether variability of ROI-based measurements could be reduced when perfusion ratios between the symptomatic and asymptomatic hemispheres are used instead of absolute perfusion values. A secondary goal was to study whether the measurement variability differed between the various cerebral flow territories in patients with symptomatic unilateral carotid artery stenosis.
Materials and Methods
Patient Group
Between September 2003 and May 2005, CTP imaging was performed in 27 patients with symptomatic carotid artery stenosis (CAS). Patients were known to have more than 50% CAS based on sonography results and were referred to our department for endovascular treatment (carotid artery stent placement) or carotid endarterectomy (CEA) as part of the International Carotid Stent placement Study (ICSS) trial (http://www.cavatas.com). At our institution, CTP measurements were added to the ICSS protocol to study the effect of the intervention on brain perfusion. Our institutional review board approved the study, and all patients had signed informed consent.
Exclusion criteria were the presence of 1) >50% contralateral stenosis (n = 2), 2) motion artifacts (n = 2), or 3) manifest large territorial infarct (n = 3). Consequently, we could evaluate 20 scans from 20 patients. Patient characteristics are shown in Table 1.
Patient characteristics (n = 20)
CTP Scanning
The CTP scans were acquired on a 16-channel scanner (MX 8000 IDT or Brilliance-16; Philips Medical Systems, Cleveland, Ohio). The level of the scan was set at the basal ganglia, just above the level of the circle of Willis, with the scan angle parallel to the orbitomeatal line to prevent incorporation of the eye lenses. We used a collimation of 8 × 3 mm with a cycle time of 1 second and acquired 40 datasets during 40 seconds of scanning. For a compromise between patient dose and signal-to-noise ratio, a tube voltage of 90 kVp in combination with 150 mAs22 was used. The CT dose index-volume for a single scan was 8.9 mGy, and the dose length product for the whole series of scans amounted to 854.4 mGy/cm. Using the dose calculator provided by IMPACT Website (http://www.impactscan.org), we estimated an effective dose of 1.8 mSv for the CTP examination. Reconstruction of 2 adjacent 12-mm slabs was performed by using a slightly smoothing head filter (UB) and a field of view of 160 mm. Thus, a total of 2 × 40 images were available from each examination and were processed to obtain perfusion maps of 2 adjacent slabs.
For all perfusion scans, we injected a bolus of 40 mL of contrast (Ultravist 300; Schering, Berlin, Germany) with 300 mg of iodine/mL at a flow rate of 5 mL/s followed by 40 mL of 0.9% saline using the same flow rate. Contrast material and saline chaser bolus were administered using a power injector with a dual head system (Stellant Dual CT injector; Medrad Europe BV, Beek, the Netherlands). To achieve nonenhanced baseline images, the scan was started 5 seconds after commencing the bolus injection in an antecubital vein.
Measurement of Absolute CTP Values and Relative CTP Ratios
CTP maps were calculated using CTP prototype software (Philips Medical Systems, Best, the Netherlands). The software first performs a motion correction and then uses an anisotropic, edge-preserving spatial filter to reduce image noise. The resulting spatially aligned and noise-reduced dataset is further processed to obtain CTP values for each voxel in the dataset.
CTP analysis is based on temporal changes in signal intensity during the first pass of a bolus of an iodinated contrast agent. Changes in CT numbers in a voxel over baseline (precontrast CT numbers) are linearly related to the concentration of the contrast agent in that voxel. Thus, a time concentration curve can be calculated for each voxel. The software used relies on the central volume principle to calculate perfusion values from the time concentration curve for each voxel.23
The first step in the evaluation process is the manual selection of the arterial input function (AIF) and venous output function (VOF). For that purpose, the user selects oval ROIs that incorporate the anterior cerebral artery (for AIF) and superior sagittal sinus (for VOF), after which the software then automatically identifies appropriate reference voxels for deriving AIF and VOF.
For each voxel, the cerebral blood volume (CBV) is calculated as the ratio of the area under the time-concentration curve (AUC) of this voxel to the AUC of the first passage through an artery. A correction factor, H, is applied to account for the difference in the hematocrit in small versus large vessels; CBV = H × AUCtissue/AUCAIF. Therefore, an absolute measurement of the AIF is required; AIF should be measured in an arterial pixel devoid of partial volume effect. Because arterial pixels without partial volume effect are not available at this level, and because the AUC of the first passage of contrast agent through a vein is equal to the AUC of an artery when the blood-brain barrier is intact, usually the superior sagittal sinus is preferred as reference; CBV = H × AUCtissue/AUCVOF. The mean transit time (MTT), the average time taken by the blood to cross the capillary network, is calculated by a deconvolution operation from the time concentration curve of a particular voxel and the AIF,24 whereby the MTT is related to the difference between the width of the tissue curve and the width of the AIF. Cerebral blood flow (CBF) for each voxel is finally calculated according to the formula: CBF = CBV/MTT.25 A threshold value of 85 HU was used for exclusion of vascular pixels.
Thereafter, free-form ROIs were drawn to outline various cerebral flow territories on each of the 2 slabs, separately for each hemisphere. The territories were selected according to the maps of Damasio,26 assuring that the ROIs were securely within the margin of the territory that belonged to a certain artery and excluded possible watershed areas (Fig 1). We included the cortical flow territory of the anterior cerebral artery (ACA), middle cerebral artery (MCA), posterior cerebral artery (PCA), and the basal ganglia (BG), which contained both deep ACA and deep MCA territories. ROIs were chosen to include mainly gray matter and as little subcortical white matter as possible.
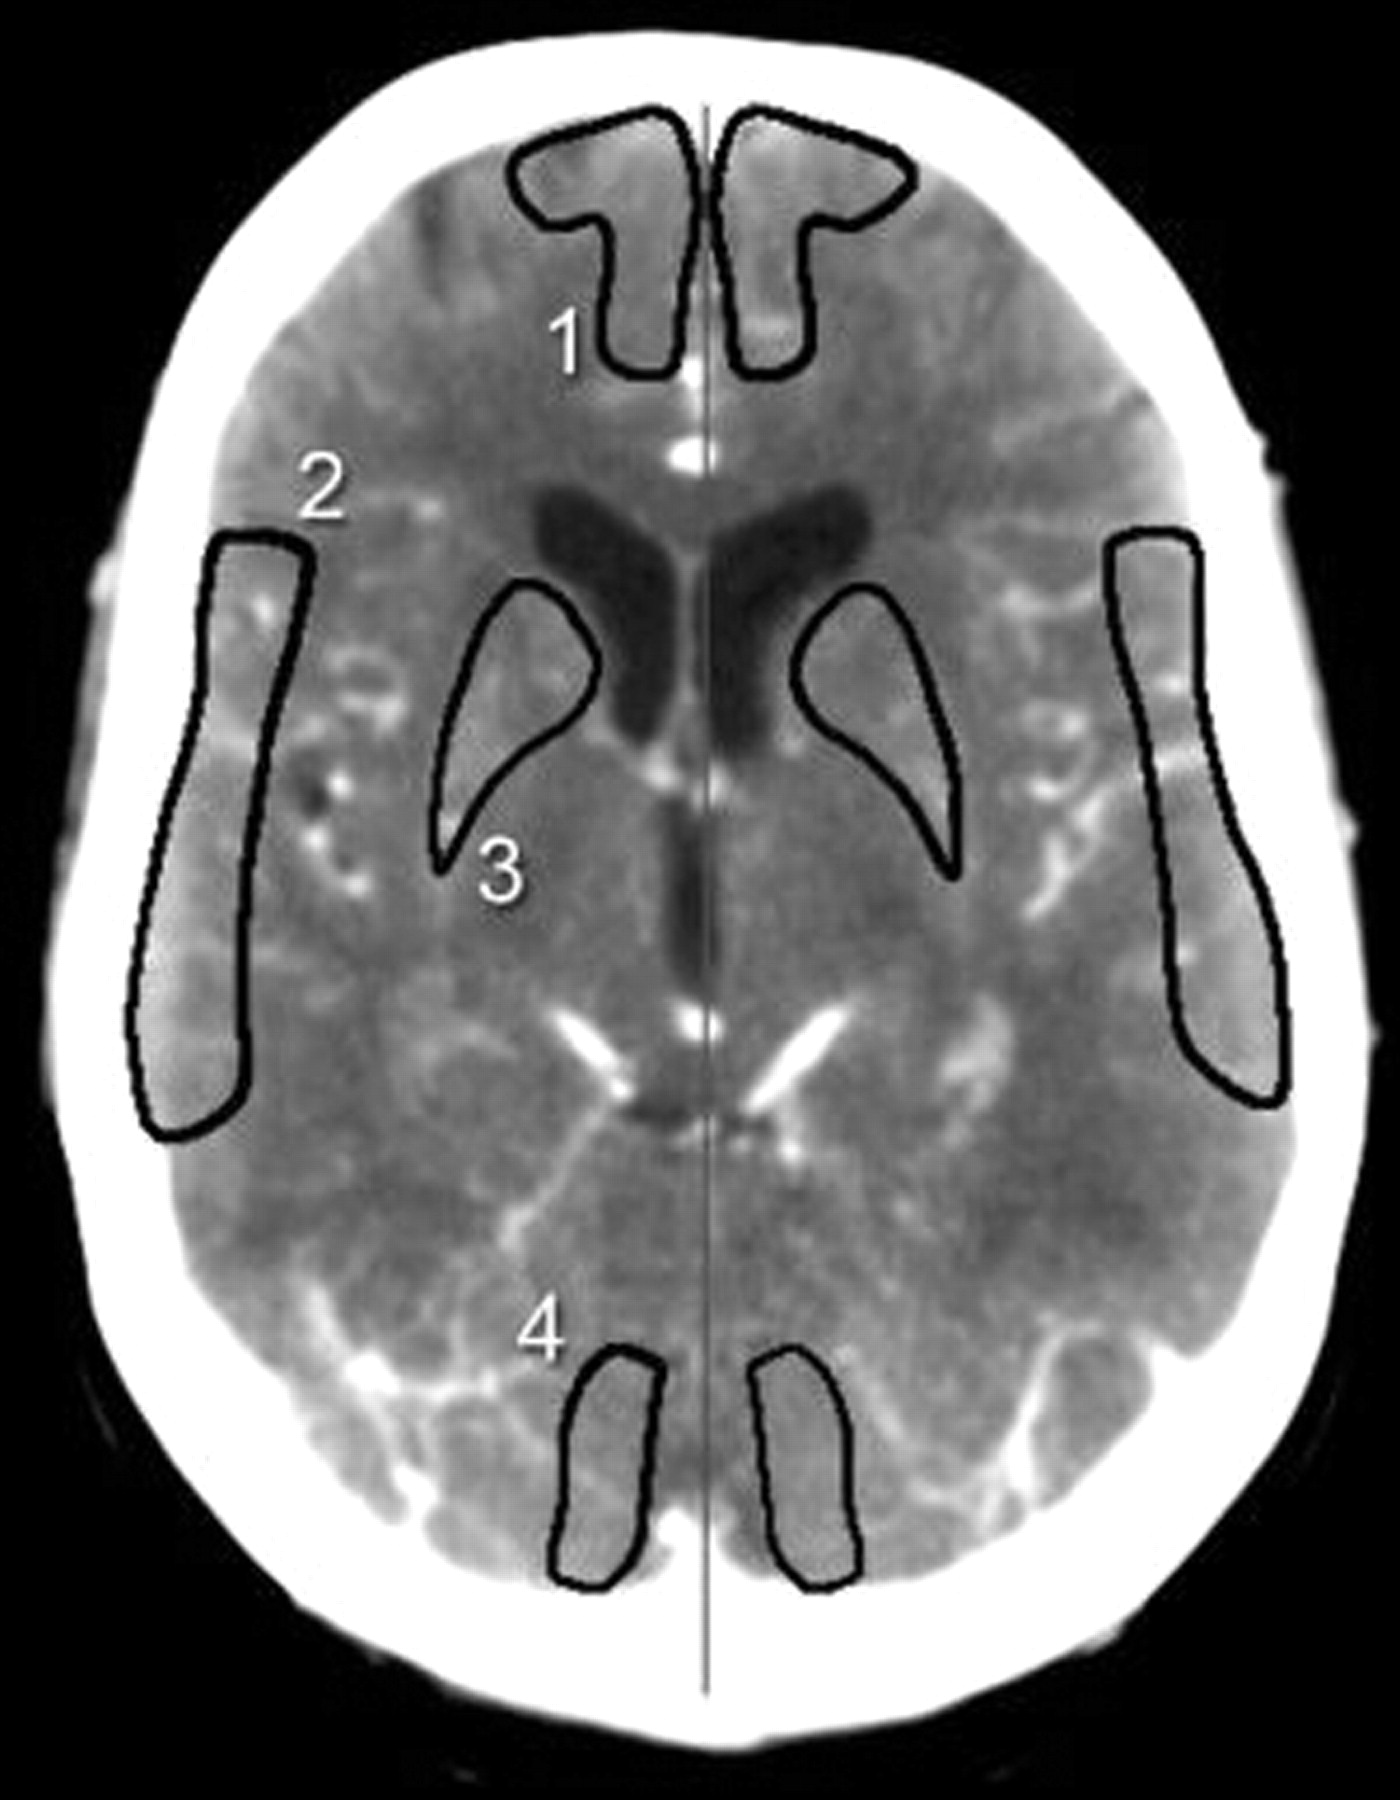
Analysis of manual outlined ROIs according to territorial division of Damasio.26 1, ACA territory; 2, MCA territory; 3, basal ganglia; 4, PCA territory.
Given 4 territories per hemisphere and 2 slabs per patient, 16 ROIs per patient were available. The average values for CBV, CBF, and MTT within each ROI were recorded. We then calculated CTP ratios by dividing the CTP values in flow territories in the symptomatic hemisphere by the CTP values in the corresponding asymptomatic hemisphere.
Data Analysis
Measurements were acquired by 2 observers (A and B) and repeated after 1 week by observer A. For this purpose, all steps from loading of the 2 × 40 slabs to drawing and evaluating the ROIs in the various perfusion territories were repeated.
For assessment of intraobserver and interobserver variability, we determined the relative differences between 2 observations and calculated the mean relative differences (mean bias) and the SD of these differences (SDDrel) according to the principle of Bland and Altman.27 The relative difference indicates the difference for each pair of observations divided by the mean of the 2 observations (eg, [ΔCBV/mean CBV] × 100%) and allows for comparing absolute CTP values and CTP ratios. For determination of interobserver variability, the first of the 2 observations of observer A was used.
First, we pooled the perfusion data from all territories to calculate global numbers for intraobserver and interobserver variability. We performed an F test to compare the intraobserver and interobserver variability for absolute CTP values to that for CTP ratios. Second, we separately analyzed intraobserver and interobserver variability for each of the 4 flow territories and compared the variability for the various flow territories using the Levine test for homogeneity of variance. We also evaluated whether there was a difference in variability for absolute values between the symptomatic and asymptomatic hemispheres using a Student t test. A test result with a P value of less than .05 was considered statistically significant.
Results
Patient Characteristics
The mean and SD for the absolute CT perfusion values (CBF, CBV, and MTT) and relative CT perfusion ratios are shown in Table 2.
Perfusion characteristics
Intraobserver and Interobserver Variability
When evaluating the perfusion data from all territories together, analysis of intraobserver variability revealed a mean bias that varied between −1.1% and 2.2%. This range was slightly larger, between −4.4% and 2.7%, for interobserver variability. The relative SDs of the differences (SDDrel) found for intraobserver and interobserver variability are given in Table 3.
Comparison of intraobserver and interobserver variability for CT perfusion values and CT perfusion ratios
Intraobserver and interobserver variability for absolute values separated for both hemispheres is shown in Table 4. Because no systematic difference was found, for further analysis, data from each hemisphere were pooled together. Intraobserver and interobserver variability was significantly lower for MTT than for CBV or CBF, independent of whether absolute CTP values or CTP ratios were considered. Intraobserver and interobserver variability for MTT values and MTT ratios were not substantially different. However, intraobserver variability for CBF and CBV ratios was significantly lower than for absolute CBF and CBV values. Interobserver variability for CBF ratios was also significantly lower than for absolute CBF values, but no significant improvement of interobserver variability could be shown if CBV ratios were used instead of absolute CBV values.
Comparison of intraobserver and interobserver variability for CT perfusion values separately for the symptomatic and asymptomatic hemisphere
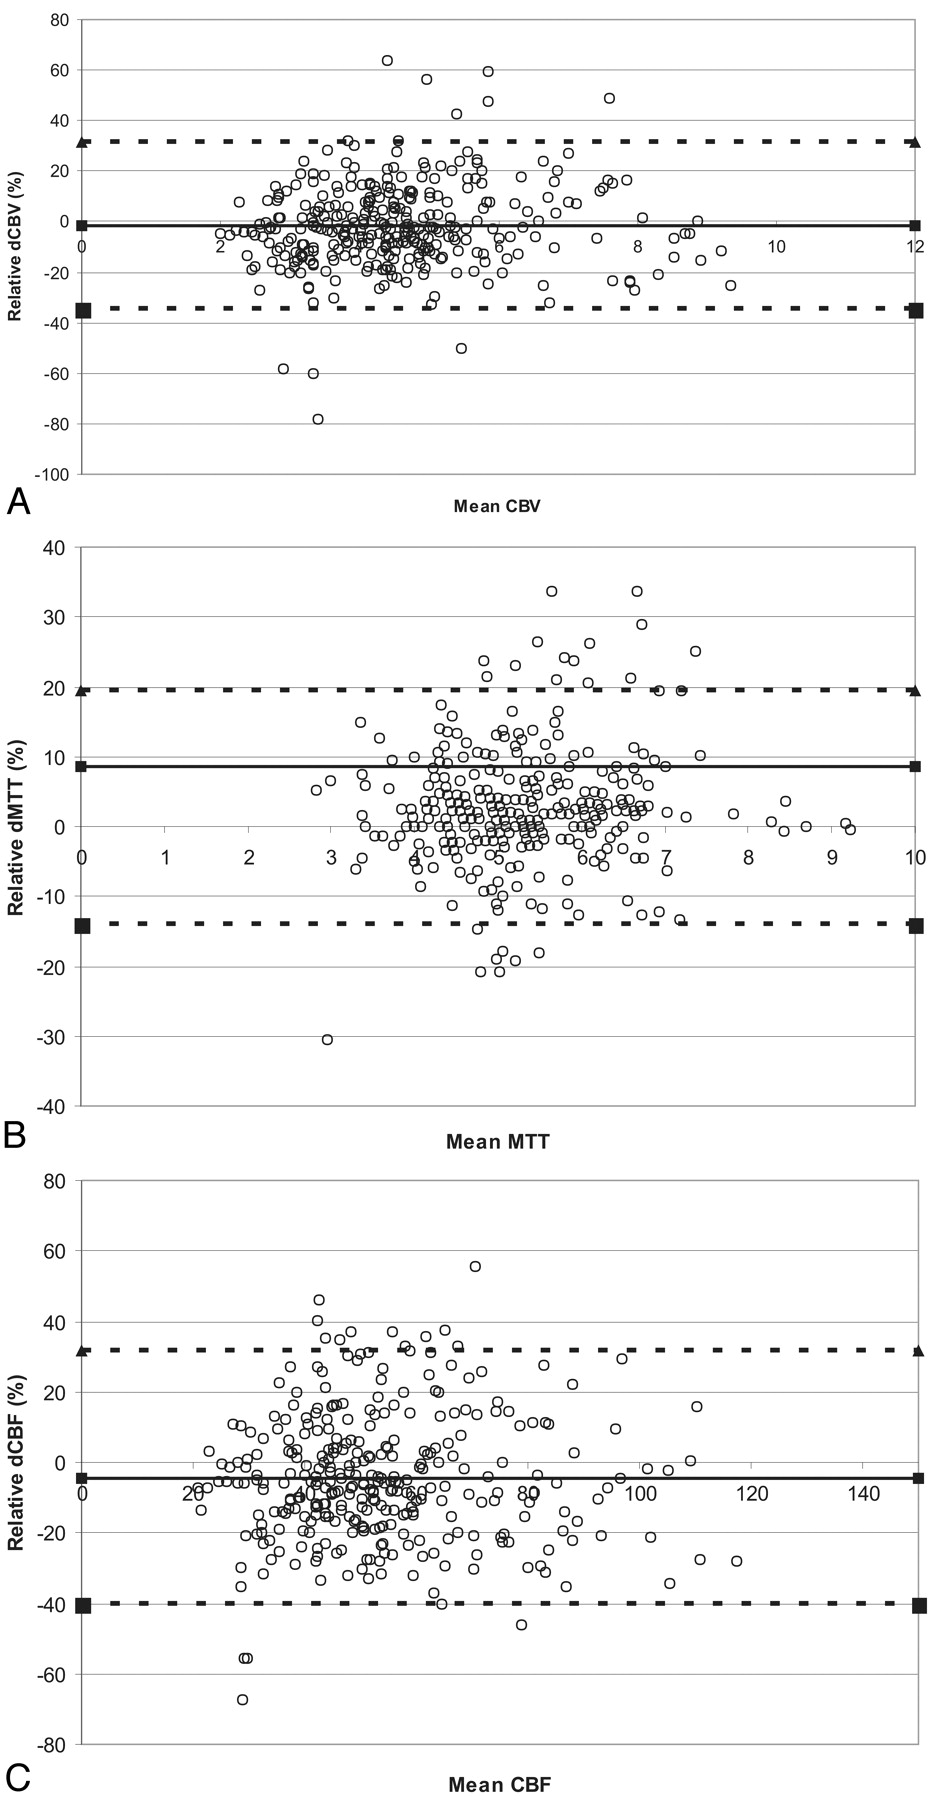
Bland-Altman plots that relate relative differences between observations to the various absolute perfusion parameters are given in Fig 2 (interobserver variability). The figures demonstrate that the relative differences were independent of the magnitude of the absolute perfusion values.

Bland-Altman plots of the relative differences (interobserver variability, pooled data) against the mean absolute value for CBF (milliliters per 100 g per minute) (A), CBV (milliliters per 100 g) (B), and MTT (seconds) (C). The relative ΔCBV, ΔCBF, and ΔMTT indicate the difference between 2 observations divided by the mean of those 2 observations, given as a percentage. The thick line represents the mean bias, and the dotted lines indicate the upper and lower limits of agreement. These upper and lower limits of agreement for the relative differences were 37% and −37% for CBV, 38% and −43% for CBF, and 21% and −16% for MTT, respectively.
Dependence of Observer Variability on Flow Territories
Intraobserver and interobserver variability for absolute MTT values was less than 10% for all territories, and no significant differences between the different territories was seen (Table 5). Absolute perfusion values ranged from 11% to 18% for CBV and from 15% to 19% for CBF.
Comparison of intraobserver and interobserver variability (SDDrel) in the four flow territories
The introduction of ratios between CTP values in the symptomatic and asymptomatic hemisphere did not substantially change variability for MTT but mostly reduced variability for CBV and CBF. For intraobserver variability, the use of ratios improved reproducibility in all territories, but the difference between the 4 flow territories was significant for CBF only (P < .05). The variability was ≤8% for CBV, CBF, and MTT in the MCA and BG territory. For interobserver variability, improvement was seen in all territories except the PCA territory. The difference between the 4 territories was significant for all parameters and was best in the MCA territory (≤11%).
Discussion
This study in patients with unilateral symptomatic carotid disease reveals 3 major findings: 1) the MTT is the most reproducible parameter for regional measurements of CTP, 2) the use of CBV and CBF ratios results in better reproducibility compared with absolute CBV and CBF values for this patient group, and 3) when separate flow territories are analyzed in such a patient group, the best reproducibility is observed in the MCA territory.
Our finding that MTT is the most reproducible parameter is in concordance with literature reports.12 This may be explained by the fact that manual outlining of an ROI will inevitably introduce variability in the amount of included white matter. It is known that there is almost no difference in MTT between gray and white matter, whereas there are major differences in CBV and CBF between these 2 tissue types.22, 28, 29 The fact that MTT showed less than 10% variability for both absolute and relative values indicates that absolute and relative values are robust measures for use in clinical practice. This is confirmed by a recent publication by Wintermark et al,30 who showed that both relative and absolute MTT can be used as threshold for discrimination between final infarct size and penumbra.
Perfusion techniques such as positron-emission tomography and single-photon emission CT use CBF as the main perfusion parameter. MTT, which is defined as CBV/CBF, can be measured by using CT or MR imaging but has thus far been used as a nonspecific indicator of a perfusion disturbance. However, the inverse of this ratio (CBF/CBV) was shown to be strongly related to cerebral perfusion pressure (CPP) and has even been suggested as a surrogate for CPP, a parameter that thus far can only be measured invasively.31 The CPP is responsible for maintenance of sufficient perfusion pressure in case of ischemia by means of the autoregulation mechanism. Although CBF is used mostly in clinical practice, the regional CBF is an insensitive indicator of the severity of occlusive cerebrovascular disease32 because it does not change with small changes of CPP. In addition, clinical studies have shown that the ratio of CBF/CBV provides better information than either of these parameters alone.32, 33 MTT is easily obtained from CTP studies and has the lowest measurement variability. Given its close relation to CPP, it may become an important parameter for evaluating perfusion disturbances in clinical practice.
Our second result indicates that intraobserver and interobserver variability for absolute CTP values can be significantly improved when CTP ratios between measurements in the symptomatic and asymptomatic hemisphere are used in patients with unilateral stenoses. This can be explained by technical reasons. Calculation of ratios eliminates variations caused by the choice of the AIF and VOF. In addition, it may also reduce the variability in the proportion of gray and white matter that is included in the regional analysis; if the ROIs drawn in both hemispheres are symmetrically placed, the relative amounts of gray and white matter should be similar. Calculating ratios will therefore eliminate part of the resulting measurement variability.
The third result indicated least variability in the MCA territory. Placement and size of ROIs may be a factor that can help explain this finding. The ROIs in the MCA territory tended to be larger than the ROIs in the other territories. This makes it likely that there is a larger overlap between ROIs drawn at repeated measurements or by different observers, which should positively influence reproducibility. The ROIs in the ACA and PCA territories were smaller, and although the medial extent of these territories is well defined by the interlobar fissure, the lateral extent is more difficult to define. This may result in variability in the amount of white matter that is included with resultant higher interobserver and intraobserver variability (Fig 1). Finally, intraparenchymal vessels such as distal ACA, MCA, and PCA branches or venous structures can lead to very high measured cerebral blood volumes when these are mistaken for parenchyma.10 Although we set a threshold value for removing these structures, the absolute value of CBV and CBF is influenced by AIF and VOF selection, which can lead to observer dependency in the extent of the removal of vascular structures. In summary, we found that in the most optimized situation a measurement variability of 5%–10% can be achieved. In this case, we used the relative perfusion values in the MCA territory. Normal left-right differences are known to vary ± 10%, whereas intrapatient differences for repeated measurements are in the range of 10%–20%.13 Therefore, measurement variability between 2 observers should not be more than 10%. This implies that measurement of true perfusion abnormalities requires intrapatient comparison using relative values. In our hospital, no clinical decisions are yet based on quantitative perfusion data, but further research will have to reveal whether the use of CTP ratios could improve clinical care. Our study has some limitations. First, the presence of a carotid artery stenosis influences the AIF and thereby the measured absolute MTT and CBF.34 However, because we used relative differences for further analysis, the absolute height of perfusion values is no longer influencing the intraobserver and interobserver variability. A second difficulty in choice of AIF selection in the ACA is the assumption that this input function is equal over all brain voxels, which is probably not true in these patients. However, the search for a method to define the localized AIF is still problematic and is currently under study.35 In addition, the determination of CBV carries uncertainty, because the VOF is also generalized for all voxels.23 However, it is expected that the AUC of the VOF is unaffected by local pathology. In addition, these effects are expected to be equally distributed over voxels in both hemispheres and all territories; the use of relative data will largely eliminate these effects. Third, we have excluded patients with large territorial infarcts from further analysis. We have done so because perfusion measures are clinically more interesting for tissues with reduced perfusion and less so for manifest (chronic) infarcts. In the latter case, the abnormality is already immediately evident from noncontrast CT, and CTP has little added value.
In conclusion, this study shows that when performing CTP studies, MTT is the most reproducible parameter independent of flow territory or the use of absolute values or perfusion ratios. Substantial intraobserver and interobserver variability ranging between 16% and 21% can be expected if regional measurements of absolute CBV and CBF values are performed. In clinical practice, such quantitative regional analysis of CBV and CBF values should therefore be interpreted with caution. Variability can be reduced by using the ratio between symptomatic and asymptomatic hemispheres. A variation on the order of ≤10% can be expected for CBV and CBF ratios in the MCA territory, which makes such ratios more suitable for clinical application. MTT measurements show a similar low variability, independent of flow territory or whether absolute or relative values are used.
References
- Received April 25, 2006.
- Accepted after revision September 11, 2006.
- Copyright © American Society of Neuroradiology
In this issue


Jump to section
Related Articles
Cited By...
- Can Iterative Reconstruction Improve Imaging Quality for Lower Radiation CT Perfusion? Initial Experience
- Evaluation of CT Perfusion in the Setting of Cerebral Ischemia: Patterns and Pitfalls
- Intra- and Interobserver Agreement and Impact of Arterial Input Selection in Perfusion CT Measurements Performed in Squamous Cell Carcinoma of the Upper Aerodigestive Tract
- The Acetazolamide Challenge: Techniques and Applications in the Evaluation of Chronic Cerebral Ischemia