
Abstract
BACKGROUND AND PURPOSE: Noninvasive grading of gliomas remains a challenge despite its important role in the prognosis and management of patients with intracranial neoplasms. In this study, we evaluated the ability of cerebral blood flow (CBF)-guided voxel-by-voxel analysis of multivoxel proton MR spectroscopic imaging (1H-MRSI) to differentiate low-grade from high-grade gliomas.
MATERIALS AND METHODS: A total of 35 patients with primary gliomas (22 high grade and 13 low grade) underwent continuous arterial spin-labeling perfusion-weighted imaging (PWI) and 1H-MRSI. Different regions of the gliomas were categorized as “hypoperfused,” “isoperfused,” and “hyperperfused” on the basis of the average CBF obtained from contralateral healthy white matter. 1H-MRSI indices were computed from these regions and compared between low- and high-grade gliomas. Using a similar approach, we applied a subgroup analysis to differentiate low- from high-grade oligodendrogliomas because they show different physiologic and genetic characteristics.
RESULTS: Choglioma (G)/white matter (WM), GlxG/WM, and Lip+LacG/CrWM were significantly higher in the “hyperperfused” regions of high-grade gliomas compared with low-grade gliomas. ChoG/WM and Lip+LacG/CrWM were also significantly higher in the “hyperperfused” regions of high-grade oligodendrogliomas. However, metabolite ratios from the “hypoperfused” or “isoperfused” regions did not exhibit any significant differences between high-grade and low-grade gliomas.
CONCLUSION: The results suggest that 1H-MRSI indices from the “hyperperfused” regions of gliomas, on the basis of PWI, may be helpful in distinguishing high-grade from low-grade gliomas including oligodendrogliomas.
The clinical management of glioma presents a considerable challenge, and presurgical grading is important for prognosis and the planning of treatment strategies.1,2 It has been shown that proton MR spectroscopy (1H-MR spectroscopy) and perfusion-weighted imaging (PWI) can evaluate the degree of malignancy of brain tumors.3–5 Anecdotal studies6,7 also report the potential of these techniques in differentiating the grade of oligodendrogliomas, a subgroup of gliomas that possesses unique genetic and physiologic characteristics.8 Despite favorable results, the ability to use 1H-MR spectroscopy and PWI data in predicting the histologic grade is a subject of considerable controversy, particularly in the subgroup of oligodendrogliomas.9–13 Owing to inherent heterogeneity of gliomas, 1H-MR spectroscopy indices and perfusion measurements vary considerably, and there are reports of overlap of choline/creatine (Cho/Cr) ratio, relative cerebral blood volume (rCBV), and cerebral blood flow (CBF) values between different grades of glioma.7,14–17
There have been some efforts to combine 1H-MR spectroscopy and PWI in characterizing gliomas to improve the accuracy in predicting the tumor grade.5,15,18 In one study,19 maximum rCBV was shown to be superior to 1H-MR spectroscopy in predicting glioma grade. On the other hand, Fayed et al15 reported that 1H-MR spectroscopy was better than rCBV, whereas Yang et al5 suggested a complementary role of these 2 techniques in separating different grades of the gliomas. One possible explanation for conflicting results in these studies might be that 1H-MR spectroscopy voxels may not have corresponded to regions of maximum CBF or rCBV on PWI. With these limitations in mind, our study was designed to evaluate the hypothesis that the combined voxel-by-voxel analysis of PWI and 1H-MRSI indices can improve the preoperative diagnostic efficacy of these methods in differentiating high-grade from low-grade gliomas including oligodendrogliomas.
Materials and Methods
Subjects
We obtained approval for this study from the Institutional Review Board and informed consent from all patients. For comparison, we retrospectively evaluated 35 subjects (21 men and 14 women; mean age, 45.46 years; age range, 20–68 years) who had histopathologic results. All patients underwent MR examination before surgery, radiation, or chemotherapy. Patients were divided into 2 groups: high-grade (grades 3 and 4, n = 22) and low-grade gliomas (grades 1 and 2, n = 13). Among those with low-grade gliomas, 11 patients had oligodendrogliomas, 1 patient had an astrocytoma, and 1 had a ganglioglioma. Of the 35 patients, 16 with oligodendrogliomas were included in a separate subgroup analysis. These patients were divided into 2 groups: high-grade (grade 3, n = 5) and low-grade (grade 2, n = 11). Of these patients, 4 had mixed oligoastrocytomas (3 low-grade and 1 high-grade) with prominent composition of oligodendroglial cells and were thus included in this group (Table 1).
Subject demographics
Data Acquisition
Conventional MR Imaging.
We performed MR imaging and 1H- MRSI on a 3T Magnetom Trio scanner (Siemens, Erlangen, Germany) equipped with a standard quadrature head coil provided by the manufacturer. The imaging protocol included a 3-plane scout localizer axial 3D T1-weighted magnetization-prepared rapid acquisition of gradient echo (MPRAGE) (TR 1620 ms; TE, 3.9 ms; TI, 950 ms, 192 × 256 matrix size, 1-mm section thickness); and axial fluid-attenuated inversion recovery (FLAIR) (TI, 2500 ms; TR, 9190 ms; TE, 97 ms) or axial T2-weighted turbo spin-echo (TR, 4000 ms; TE, 85 ms) sequences.
PWI.
For continuous arterial spin-labeling (CASL) perfusion MR imaging, twelve 6-mm-thick axial sections with a 1.5-mm intersection gap were acquired. Other parameters included FOV, 22 × 22 cm2; matrix size, 64 × 64 (3.44 mm in-plane resolution); TR, 4000 ms; and TE, 17 ms. We applied the labeling for the control pulse at the level of the cervicomedullary junction by using a postlabeling delay of 1.2 s and labeling duration of 2 s,20 along with radio frequency (RF) amplitude of 2.25T and a gradient strength of 1.6 mT/m for the labeling pulses. These power levels were within the FDA guidelines for RF deposition and provided a labeling efficiency of 68%.21 We implemented the control pulses by using amplitude modulation of labeling pulses on the basis of a sinusoid function with a frequency of 100 Hz.
1H-MRSI.
We performed a 2D multivoxel 1H-MRSI by using a spin-echo (point-resolved spectroscopy) sequence with water suppression by means of selective excitation. Sequence parameters included TR, 1700 ms; TE, 30 ms; NEX, 3; FOV, 16 × 16 cm2; section thickness, 15 to 20 mm; bandwidth, 1200 Hz; and matrix size, 16 × 16 to obtain a good signal-to-noise ratio within a reasonable acquisition time of 7 minutes. We selected the volume of interest (VOI) to include the neoplasm as well as areas of normal-appearing contralateral brain parenchyma, avoiding the scalp, base of the skull, or sinuses. We placed 8 outer volume saturation slabs (30-mm thick) outside the VOI to suppress lipid signals from the scalp. We acquired the dataset by using elliptical k-space sampling with weighted phase encoding to reduce the acquisition time. To minimize the effect of increased nominal voxel size by elliptical k-space sampling, we applied a Hanning filter (50%) in the spatial dimensions. We then performed manual shimming to achieve an optimum full width at half maximum value (FWHM <20 Hz) of the water signal intensity.
Data Analysis
PWI.
We processed perfusion data off-line by using a program written in interactive data language (IDL) software (Research Systems, Boulder, Colo). The PWI series was generated by pair-wise subtraction of the label and control images followed by conversion to absolute CBF map on the basis of a 2-compartment CASL perfusion model.21 The resulting CBF maps were coregistered with T1-weighted MPRAGE images with use of statistical parametric mapping software (SPM99; Wellcome Trust Centre for Neuroimaging, London, UK). We performed the analysis of the PWI maps in 3 ways:
Because maximum perfused regions of the gliomas are suggestive of malignancy and aggressiveness,22 we analyzed the PWI data from the 3 maximally perfused regions of the entire volume of the glioma by drawing regions of interest (ROIs) comprising 30 pixels as the first analytical method. We averaged the values from these regions and normalized them to the contralateral normal white matter (NWM). These values are reported as CBFmaximum (max) and CBFmax/ white matter (WM), respectively.
In the second method, we measured CBF by drawing ROIs in the glioma from the 3 sections that corresponded to the approximate section thickness and location of the 1H-MRSI VOI. The ROIs were initially generated on coregistered T1-weighted MPRAGE images because these images are acquired at higher spatial resolution, providing a more accurate delineation of the tissue. The CBF values from these ROIs were then noted from the coregistered CBF maps. As with the first method, we averaged the data and normalized them to the contralateral NWM. These values are represented as CBFtotal or CBFtotal/WM, respectively.
In the third method of data analysis, we separated the glioma into 3 different categories as “hypoperfused,” “isoperfused,” and “hyperperfused” with respect to the contralateral NWM to assess the heterogeneity of CBF in the neoplasm. Different regions of the gliomas were categorized as “hyperperfused” if average CBF was more than 1 SD (25.86 mL/100 g/min), “hypoperfused” if less than 1 SD (20.45 mL/100 g/min), or “isoperfused” if CBF was within 1 SD of the mean value of CBF in NWM (20.45–25.86 mL/100 g/min). Average CBF from these areas were then normalized to the contralateral NWM and reported as CBFglioma (G)/WM.
1H-MRSI.
We analyzed the 1H-MRSI data from voxels (n = 4–13) that encompassed the glioma and exhibited good spectral resolution (FWHM <20Hz) and signal-to-noise ratio. The region between 0.2 and 4.0 ppm of the spectrum was processed. We evaluated the following 1H-MRSI indices: N-acetylaspartate (NAA), 2.02 ppm; Cr, 3.02 ppm; Cho, 3.22 ppm; myo-inositol (mIns), 3.56 ppm; and glutamine/glutamate (Glx), 2.35 ppm. The resonance at 1.3 ppm was assigned to a combination of lactate (Lac) and lipid (Lip) since it is difficult to differentiate contributions from Lac and Lip. We measured the absolute concentrations of metabolites by using a user-independent spectral fit program (linear combinations of models).23 To compare the 1H-MR spectroscopy findings with the PWI data, we analyzed the 1H-MRSI data according to the second and third approaches of the PWI data analysis:
In the first method, concentrations of each metabolite from the voxels (n = 4–13) covering the glioma were averaged and normalized to the voxels (n = 3–10) of the contralateral NWM. To avoid the effects resulting from variations in the intertumor and intratumor energy metabolism, we did not use concentration of Cr as a reference from the same voxel.
In the second method, a spectroscopic grid overlaid over a T1-weighted image was used to match the voxels of 1H-MRSI with different regions of gliomas on CBF map. Concentrations of metabolites of the voxels from “hyperperfused” (n = 3–12), “hypoperfused” (n = 1–5), and “isoperfused” (n = 1–6) regions of the glioma were individually normalized to the voxels in the contralateral NWM and averaged. Because Lip and Lac peaks are not observed in the normal brain, Lip+Lac from the voxels encompassing the glioma were normalized with respect to Cr from the NWM.
We also performed a similar subgroup analysis between low-grade (grade 2, n = 11) and high-grade oligodendrogliomas (grade 3, n = 5).
Statistical Analysis
We used a 2-tailed heteroscedastic Student t test to look for differences in CBFtotal, CBFtotal/WM, CBFmax, and CBFmax/WM between low-grade and high-grade gliomas. A comparison between CBFtotal/WM and 1H-MRSI indices from the central 3 sections corresponding to the 1H- MRSI VOI was performed. We also performed an independent comparison of CBFG/WM and 1H-MRSI indices from the “hypoperfused,” “isoperfused,” and “hyperperfused” regions of the glioma to differentiate low-grade from high-grade gliomas. A similar statistical approach was also applied for the subgroup analysis of oligodendrogliomas. A probability (P) value of <.05 was considered significant. Confidence intervals (CI, 95%) of ChoG/WM, GlxG/WM, and Lip+LacG/CrWM from low-grade and high-grade gliomas and ChoG/WM and Lip+LacG/CrWM from oligodendrogliomas were also computed.
Results
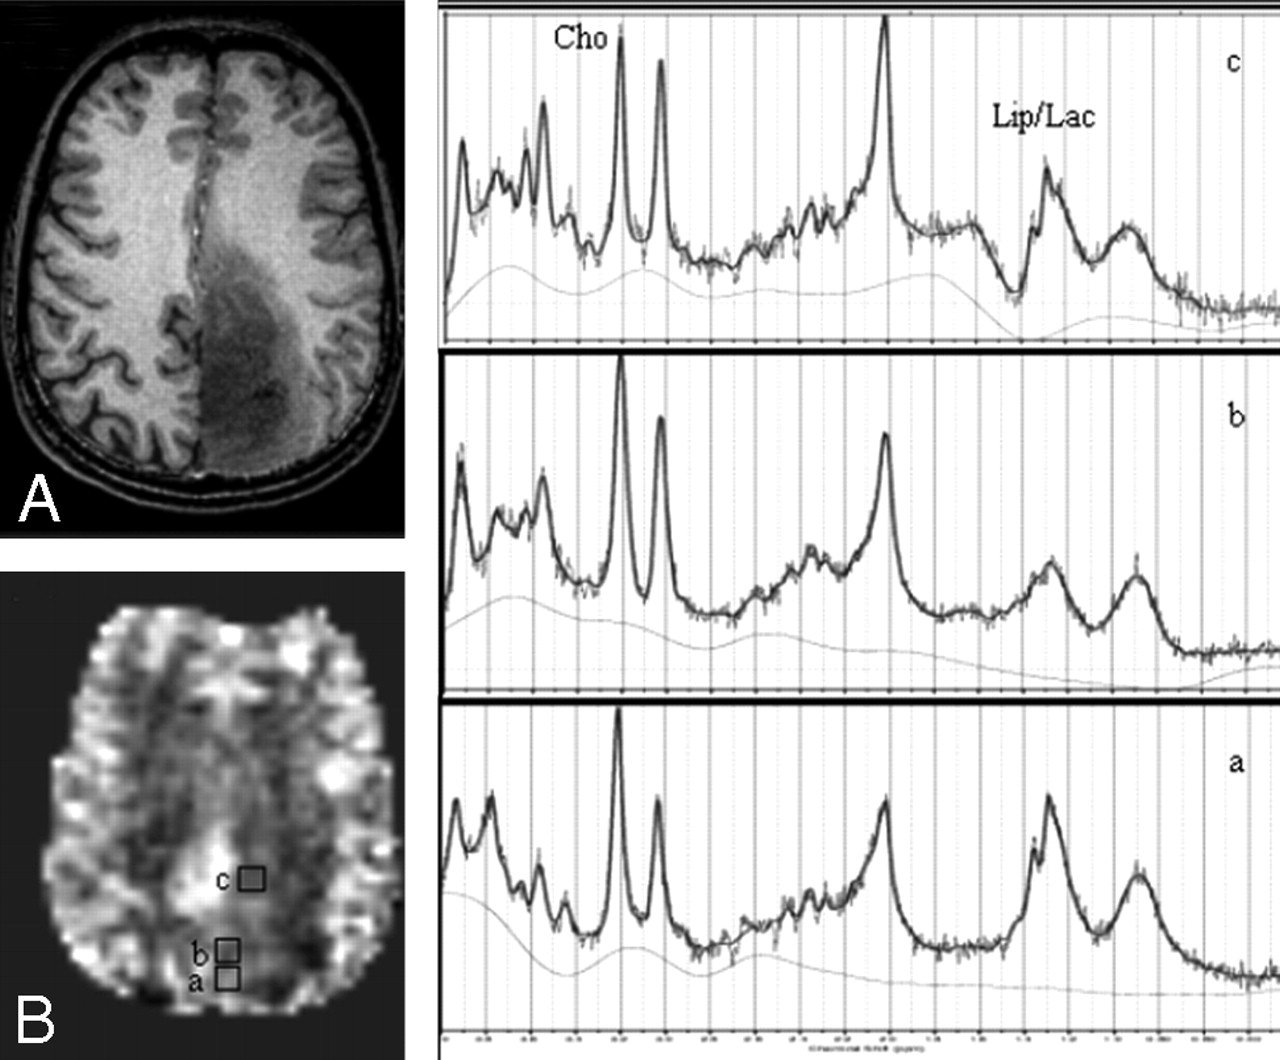
In general, high-grade gliomas showed foci of increased CBF, higher Cho, Lac+Lip, and Glx than low-grade gliomas (Figs 1, 2). We found significantly different CBFmax between low-grade (51.34 ± 16.85 mL/100 g/min) and high-grade (88.48 ± 65.28) gliomas (P < .05). However, CBFtotal from the 3 central sections from the glioma corresponding to the 1H-MRSI section was not significantly different between low-grade (37.28 ± 12.68) and high-grade (41.50 ± 18.48) gliomas (P > .05). Even when CBF was normalized to the contralateral NWM (CBFtotal/WM), the difference between low-grade (1.68 ± 0.44) and high-grade (1.90 ± 0.75) gliomas was not significant (P > .05).

Axial T1-weighted MPRAGE image (A) demonstrates a low-grade oligodendroglioma in the left parietal region; CBF map (B) shows voxels from “hyperperfused” (a), “isoperfused” (b), and “hypoperfused” (c) regions. 1H-MRSI spectra (a-c) are from the corresponding voxels shown on the CBF map.

Axial T1-weighted MPRAGE image (A) exhibits a case of GBM in the frontal lobe; CBF map (B) shows voxels from “hyperperfused” (a), “isoperfused” (b), and “hypoperfused” (c) regions of the glioma. 1H-MRSI spectra (a–c) are from the corresponding voxels shown on the CBF map.
When we compared 1H-MRSI data from all the voxels in the glioma with CBFtotal from the 3 central sections between low-grade and high-grade gliomas, we observed higher Chototal/WM (1.58 ± 0.41 vs 1.35 ± 0.32), Glxtotal/WM (1.24 ± 0.51 vs 1.18 ± 0.37), and Lip+Lactotal/CrWM (4.03 ± 3.24 vs 2.54 ± 0.73) in the high-grade gliomas compared with low-grade. However, no significant difference was obtained for any of the 1H-MRSI indices (P > .05).
The percentage of voxels with “hypoperfused,” “isoperfused,” and “hyperperfused” CBF values from the central 3 sections of low-grade gliomas was 31.05%, 30.56%, and 38.35%, respectively, whereas 17.13%, 27.67%, and 55.33% voxels had CBF values corresponding to the “hypoperfused,” “isoperfused,” and “hyperperfused” regions in high-grade gliomas. It was not possible to differentiate low-grade from high-grade gliomas on the basis of CBFG/WM alone (P > .05). However, on 1H-MRSI, ChoG/WM (2.11 ± 0.46 vs 1.15 ± 0.31), Glx G/WM (1.01 ± 0.52 vs 0.63 ± 0.21) and Lip+LacG/CrWM (6.83 ± 4.17 vs 2.23 ± 0.65) were significantly higher in the “hyperperfused” high-grade gliomas compared with low-grade (P < .05). The CI (95%) of ChoG/WM for low-grade and high-grade gliomas was 1.02 to 1.28 and 1.88 to 2.34, respectively. CI (95%) of Glx G/WM for low-grade and high-grade gliomas was 0.53 to 0.73 and 0.9 to 1.12, respectively. CI (95%) of Lip+LacG/CrWM for low-grade and high-grade gliomas was 1.67 to 2.79 and 5.13 to 8.53, respectively. There was no significant difference in the other metabolites (NAA, Cr, or mIns) between the 2 grades in the “hyperperfused” areas. Metabolite ratios from the “hypoperfused” or “isoperfused” regions did not exhibit any significant differences between the 2 glioma groups (Table 2). The ChoG/WM, GlxG/WM, and Lip+LacG/CrWM values from low-grade and high-grade gliomas are shown as scatterplots in Fig 3.

Scatterplots demonstrate the variations in ChoG/WM (A), Glx G/WM, (B), and Lip+LacG/CrWM (C) from the “hyperperfused” regions between the low-grade and high-grade gliomas.
CBF and metabolite ratios from different regions of gliomas
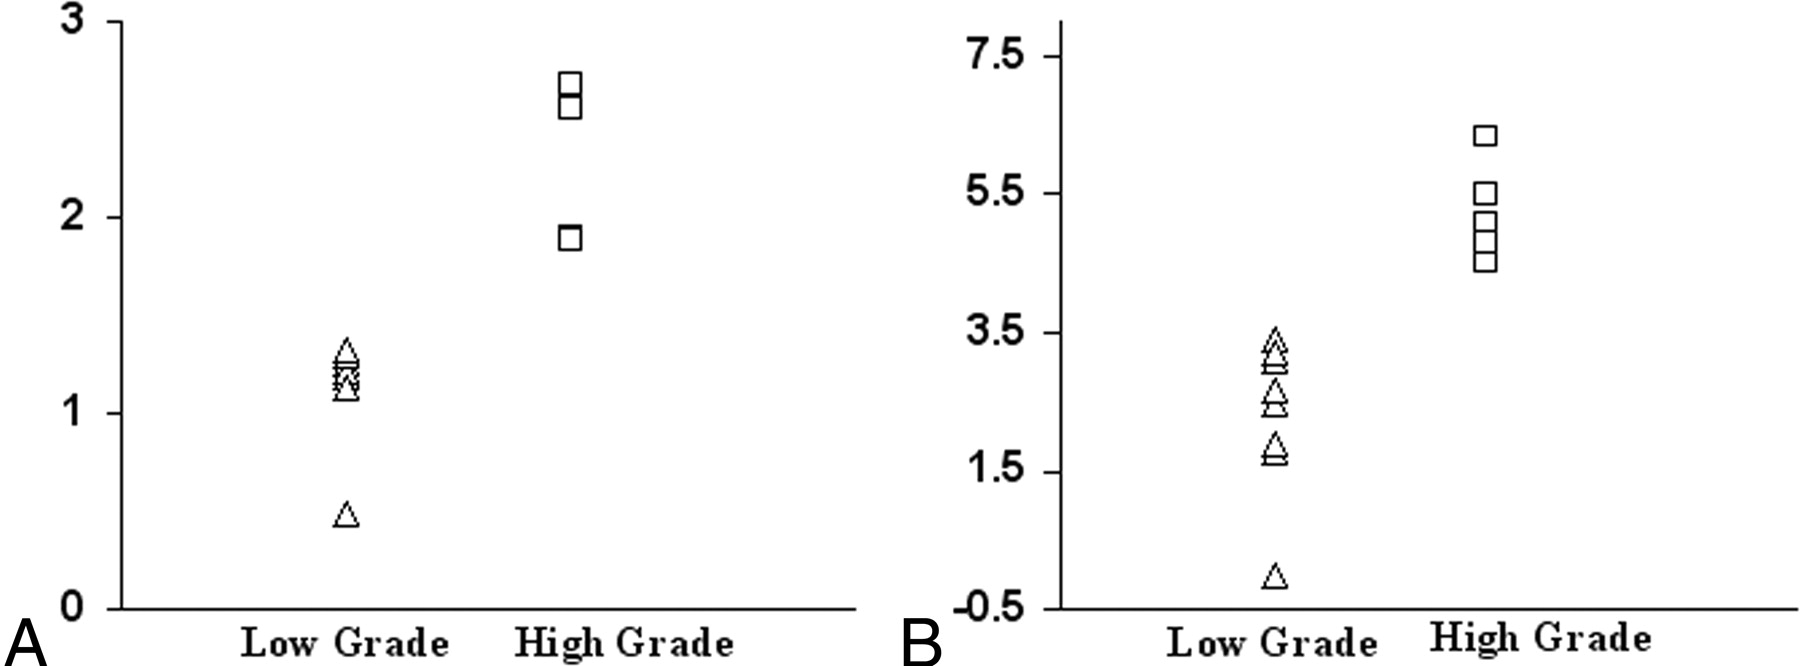
In the subgroup of patients with oligodendrogliomas, all 4 perfusion indices (CBFtotal, CBFtotal/WM, CBFmax, and CBFmax/WM) were not significantly different between the low-grade (grade 2) and high-grade (grade 3) oligodendrogliomas (P > .05). Moreover, CBFG/WM from the “hyperperfused,” “isoperfused,” or “hypoperfused” regions could not differentiate the 2 grades of oligodendrogliomas (P > .05). However, on 1H-MRSI, ChoG/WM (2.20 ± 0.35 vs 1.16 ± 0.25) and Lip+LacG/CrWM (5.15 ± 0.68 vs 2.64 ± 0.65) were significantly higher in the “hyperperfused” regions of high-grade oligodendrogliomas compared with low-grade (P < .05). CI (95%) of ChoG/WM for low-grade and high-grade oligodendrogliomas was 1.01 to 1.31 and 2.02 to 2.58, respectively. CI (95%) of Lip+LacG/CrWM for low-grade and high-grade oligodendrogliomas was 2.24 to 3.04 and 4.61 to 5.69, respectively. There was no significant difference in the other metabolites (NAA, Cr, mIns, or Glx) between the 2 grades in the “hyperperfused” areas. None of the metabolite ratios from the “hypoperfused” or “isoperfused” regions exhibited any significant differences between the 2 oligodendroglioma groups (Table 3). The scatterplots of ChoG/WM and Lip+LacG/CrWM between the low-grade and high-grade oligodendrogliomas demonstrate this variability in the 2 groups (Fig 4).

Scatterplots demonstrate the variations in ChoG/WM (A), and Lip+LacG/CrWM (B) from the “hyperperfused” regions between the low-grade and high-grade oligodendrogliomas.
CBF and 1H-MRSI indices from different regions of oligodendrogliomas
Discussion
From a histologic standpoint, gliomas are heterogeneous, with components that include varying degrees of cellular and nuclear pleomorphism, mitotic activity, vascular proliferation, and necrosis.24,25 Our results show that if the analysis of 1H- MRSI data are restricted to the “hyperperfused” regions, it is possible to differentiate high-grade gliomas from low-grade ones.
In the present study, we used CBF-guided voxel-by-voxel analysis of 1H-MRSI to evaluate the efficacy of this method in differentiating low-grade from high-grade gliomas. Although arterial spin-labeling (ASL) techniques may not be available in all clinical scanners, we believe that MRSI analysis guided by blood volume data may equally be used with methods that use the dynamic susceptibility contrast (DSC) enhancement to measure relative cerebral blood volume (rCBV). A close correlation between DSC and ASL techniques for determination of blood flow in brain tumors has recently been reported.26 Postcontrast-enhanced T1-weighted images can also be potentially used to select the MRSI voxels of interest. However, contrast enhancement is not always accurate in predicting the grade of a tumor, and all high-grade tumors do not enhance.27 Moreover, it has been shown previously that metabolic abnormality extends beyond the contrast-enhanced areas in brain tumors.12 Perfusion-weighted images (ASL, DSC, or dynamic contrast enhanced), reflect true alterations in the physiology of a tumor.28 Thus, we believe that analysis of PWI-guided 1H-MRSI indices may allow more sensitive differentiation of glioma grades than contrast-enhanced image analysis.
Significantly elevated CBFmax and CBFmax/WM were found in high-grade gliomas compared with low-grade ones, and our results are in agreement with reports in the literature.14,19 However, in a subgroup analysis of oligodendrogliomas, there was no significant difference in CBFmax and CBFmax/WM between the 2 grades. Oligodendroglial tumors, which consist of oligodendrogliomas and mixed oligoastrocytomas, account for 5% to 18% of all gliomas.29 Combined loss of heterozygosity (LOH) on chromosomal arms 1p and 19q are molecular signatures that distinguish oligodendrogliomas from other subtypes of gliomas. LOH 1p/19q has emerged as an independent predictive marker of better response to radiotherapy and chemotherapy as well as longer survival in patients with anaplastic oligodendroglial tumors.30–33 In a recent report, Spampinato et al6 have successfully separated low-grade from high- grade oligodendrogliomas on the basis of maximum rCBV values. However, few studies have reported high perfusion from low-grade oligodendrogliomas and low perfusion from high-grade oligodendrogliomas.7,14,22 In a previous study, Wolf et al14 reported normalized CBFmax of less than one in 2 cases of gliomas, which were later found to be grade 3 gliomas with oligodendroglial components. Using a DSC perfusion MR imaging technique, Xu et al7 did not find any difference between low-grade and high-grade oligodendrogliomas. Similarly, Lev et al22 reported a poor correlation between tumor perfusion and grade in a subpopulation of 8 oligodendrogliomas. These observations may reflect the inherently vascular nature of some low-grade oligodendrogliomas, which have been classically described as having a attenuated network of branching capillaries.34 The possible explanation for the successful attempt by Spampinato et al6 in differentiating the 2 grades of oligodendrogliomas may be that these authors used smaller ROIs than used in previous studies and thus avoided volume averaging.
Although no tumor-specific metabolite is detectable with in vivo 1H-MR spectroscopy, it is possible to detect specific changes in the pattern of spectral features of a tumor that are different from those of the normal brain. Few studies have shown the potential of 1H-MR spectroscopy to differentiate low-grade from high-grade gliomas3–5,19 including oligodendrogliomas.6,7 The authors of these studies have observed significantly higher maximum Cho/Cr in high-grade gliomas compared with low-grade ones. Even with these promising results, the objective of accurately grading gliomas on the basis of 1H-MR spectroscopy findings alone has not been completely achieved.9–13 In general, Cho is higher in high-grade gliomas.3,4,35 However, some glioblastoma multiformes (GBMs) have been reported to have low Cho levels.36 On the other hand, there are also reports of elevated Cho in low-grade gliomas compared with high-grade ones.19 In our study, when 1H-MRSI data from all the voxels in the glioma were compared with CBF from the glioma involving 3 central sections, no significant difference was obtained for any of the 1H- MRSI indices between low-grade and high-grade gliomas, probably because of the averaging effect by heterogeneous voxels encompassing the glioma. However, when we performed a voxel-by-voxel analysis of 1H-MRSI indices, we observed a significantly higher ChoG/WM, Glx G/WM, and Lip+LacG/CrWM in high-grade compared with low-grade gliomas only from the “hyperperfused” regions. However, oligodendrogliomas still pose a challenge.
Cho compounds (choline, phosphocholine, and glycerophosphocholine) are part of the normal phospholipid pathways that maintain the integrity of the cell membrane and its associated biochemical functions. These compounds are thought to be markers for increased membrane turnover or high cell number.37–40 Regions of high rCBV have been correlated with increased mitotic activity,8 indicating high cell proliferation and thus increased Cho, as observed in our study. Most gliomas demonstrate elevated rCBV that has been correlated with neovascularity.8,22,41 It has been suggested that hypoxia is one of the leading factors for the development of angiogenesis.42 In tumors, rapid proliferation of cells leads to hypoxic regions that are distal to the nearby vasculature. Under hypoxic conditions, increased anaerobic glycolysis may lead to an elevation of Lac in the tumor. Overexpression of the hypoxia-inducible factor −1 (HIF1α) may stimulate the dilation of existing vessels or generation of new blood vessels, initiating the process of angiogenesis.43 The resultant heterogeneous perfusion, in addition to elevated metabolic rates, leads to even more hypoxic regions. This cycle of events ultimately leads to energy failure and cell death that results in necrosis. Although gross regions of necrosis can be imaged by MR imaging, areas of micronecrosis that occur before this situation are hard to detect by conventional T2- or T1-weighted MR imaging. The presence of Lip in MR spectra of tumors has, in fact, been attributed to micronecrosis.5,19,44 We believe that the presence of significantly elevated Lip and Lac in high-grade gliomas in our study is the result of a combined process of hypoxia, microscopic cellular necrosis, and cell proliferation in “hyperperfused” regions of the gliomas.
Anecdotal in vivo 1H-MR spectroscopy studies have reported high Glx (glutamate [Glu] and glutamine [Gln]) in meningiomas and GBM relative to a normal brain.45 Elevated Glx has also been observed on in vitro 1H-MR spectroscopy studies of perchloric acid extracts of GBM specimens.46,47 In our study, we observed significantly high GlxG/WM from the “hyperperfused” regions of the high-grade gliomas compared with the low-grade gliomas. In the subgroup analysis of oligodendrogliomas, higher GlxG/WM was also observed in high-grade oligodendrogliomas; however, this difference was not significant. Bouzier et al48 reported that Glx is necessary for C6 glioma growth in vivo and is taken up from the blood. In addition to its role as an energy fuel, Glx is also involved in the cellular anabolic pathways. In particular, it is essential for the synthesis of purine and pyrimidine bases as a carbon (via aspartate) and nitrogen donor and therefore necessary for tumor cell growth.49 Some authors have also reported tumors as being a Glx trap.50 Tumors have been shown to release Glu at high levels, which may stimulate tumor cell proliferation via activation of Glu receptors. Glu has also been found to facilitate tumor invasion by causing excitotoxic damage to normal brain, thereby paving a pathway for tumor migration.51 We believe that increased mitotic activity of glioma cells in the “hyperperfused” regions may necessitate the need for Glx. High GlxG/WM was also observed in the “isoperfused” and “hypoperfused” regions of the tumors; however, the difference between low-grade and high-grade gliomas was not significant. The precise explanation for this behavior in not known. However, this may be attributed to the reduced mitotic activity resulting from decreased blood flow in these regions. Therefore, it may be necessary to target the “hyperperfused” regions of the gliomas and look for a metabolite pattern on 1H-MRSI to differentiate low-grade from high-grade gliomas.
1H-MR spectroscopy of brain tumors has been performed with use of different TE for the acquisition of spectra.10,13,52 A long TE (270 ms) allows observation of a reduced number of metabolites; the spectrum has less baseline distortion and is easy to process, analyze, and interpret. At an intermediate TE of 135 ms, the Lac doublet is inverted because of J-coupling, which makes it easier to differentiate it from Lip and other macromolecules. However, at short TE (20–30 ms), many more metabolites (Lip, mIns, and Glx) are observed in addition to NAA, Cr, and Cho. Because of the relatively short T2 values, signals from these compounds may be attenuated or may completely disappear at higher or intermediate TE. These short T2 metabolites play an important role in the diagnosis and characterization of brain tumors.10,13,53 Majós et al54 have also advocated the use of short TE 1H-MR spectroscopy to classify tumors into different grades. In our study, we used a short TE (30 ms), and we assigned the resonance at 1.3 ppm as a combination of both Lac and Lip. Care was taken to avoid contamination of Lip signals from the scalp and bone by placing outer volume saturation slabs around the VOI. To reduce the acquisition time, we used a TR of 1700 ms in our study, which may not have been long enough for the complete relaxation of metabolites. We used the linear combinations of models software to quantify metabolite concentrations, which takes into account the effect of sequence parameters and tissue T1 and T2 values at particular field strength. Moreover, because the metabolite concentration from the tumor was normalized to that of the contralateral NWM, any adverse effects in quantification as a result of the intermediate TR might not have contributed to the overall results, as has been reported previously.55
We observed a significant difference in the CBFmax values from high-grade and low-grade gliomas; however, this difference was not observed when oligodendrogliomas were analyzed separately. Because it may be difficult to predict the tumor subtype presurgically on the basis of radiologic diagnosis alone, we believe that inclusion of voxel-by-voxel analysis of 1H-MRSI will aid in separating low-grade from high-grade gliomas regardless of the histologic subtypes, including oligodendrogliomas.
A limitation of our study was that most of the patients (84.61%) among the low-grade glioma group were comprised of oligodendrogliomas. Although we did not have any selection bias for this group, incidentally most of the patients with low-grade gliomas turned out to be low-grade oligodendrogliomas, which substantially biased our study toward oligodendrogliomas. Another limitation of our study was that we performed 2D 1H-MRSI that limited the correlation with CBF maps from only 3 sections corresponding to the thickness of VOI. To cover the whole, or at least the bulk of the tumor volume, it will be necessary to use a 3D 1H-MRSI sequence with higher spatial resolution. Multisection or 3D chemical shift imaging studies with higher spatial resolution would also help in a better voxel-to-voxel correlation of the 1H-MR spectroscopy with PWI studies. However, multisection or 3D MRSI techniques lead to increased acquisition time that could be prohibitive in routine clinical settings. A strategy to overcome this shortcoming may be the use of parallel MR spectroscopy imaging (sensitivity encoding or generalized auto-calibrated, partially parallel acquisitions) or echo-planar spectroscopic imaging techniques. Our study was also limited by the fact that separation of gliomas into 3 different categories as “hypoperfused,” “isoperfused,” and “hyperperfused” with respect to the contralateral NWM was based on a simplistic, manually selected, region-of-interest-based method. To accurately match the CBF voxels with the MRSI voxels, we would need a rigorous approach of tissue segmentation.
Conclusion
Our results suggest the complementary role of PWI and 1H- MRSI in the prediction of grading gliomas. We believe that PWI-guided voxel-by-voxel analysis of 1H-MRSI indices from the regions of high blood flow may be helpful in distinguishing low-grade from high-grade gliomas, including oligodendrogliomas.
Acknowledgments
The authors thank MR imaging coordinators Lisa M. Desiderio and Shannon D'Arcy and technologists Norman Butler, Doris Cain, and Tonya Kurtz for their support.
References
- Received September 13, 2006.
- Accepted after revision March 27, 2007.
- Copyright © American Society of Neuroradiology
In this issue


Jump to section
Related Articles
Cited By...
- Imaging Cancer Metabolism: Underlying Biology and Emerging Strategies
- Arterial Spin-Labeling in Children with Brain Tumor: A Meta-Analysis
- 3D Pseudocontinuous Arterial Spin-Labeling MR Imaging in the Preoperative Evaluation of Gliomas
- Arterial Spin-Labeling Perfusion MRI Stratifies Progression-Free Survival and Correlates with Epidermal Growth Factor Receptor Status in Glioblastoma
- MRI Grading versus Histology: Predicting Survival of World Health Organization Grade II-IV Astrocytomas
- Comparison of Multiple Parameters Obtained on 3T Pulsed Arterial Spin-Labeling, Diffusion Tensor Imaging, and MRS and the Ki-67 Labeling Index in Evaluating Glioma Grading
- Arterial Spin-Labeling Assessment of Normalized Vascular Intratumoral Signal Intensity as a Predictor of Histologic Grade of Astrocytic Neoplasms
- Differentiation between Oligodendroglioma Genotypes Using Dynamic Susceptibility Contrast Perfusion-Weighted Imaging and Proton MR Spectroscopy
- Multimodal MR Imaging (Diffusion, Perfusion, and Spectroscopy): Is It Possible to Distinguish Oligodendroglial Tumor Grade and 1p/19q Codeletion in the Pretherapeutic Diagnosis?