
Abstract
BACKGROUND AND PURPOSE: Diffusion-weighted MR imaging studies of the adult brain have shown that contrast between lesions and normal tissue is increased at high b-values. We designed a prospective study to test the hypothesis that diffusion tensor imaging (DTI) obtained at high b-values increases image contrast and lesion conspicuity in the neonatal brain.
MATERIALS AND METHODS: We studied 17 neonates, median (range) age of 10 (2–96) days, who were undergoing MR imaging for clinical indications. DTI was performed on a Philips 3T Intera system with b-values of 350, 700, 1500, and 3000 s/mm2. Image contrast and lesion conspicuity at each b-value were visually assessed. In addition, regions of interest were positioned in the central white matter at the level of the centrum semiovale, frontal and occipital white matter, splenium of the corpus callosum, posterior limb of the internal capsule, and the thalamus. Apparent diffusion coefficient (ADC) and fractional anisotropy (FA) values for these regions were calculated.
RESULTS: Isotropic diffusion image contrast and lesion-to-normal-tissue contrast increased with increasing b-value. ADC values decreased with increasing b-value in all regions studied; however, there was no change in FA with increasing b-value.
CONCLUSIONS: Diffusion image contrast increased at high b-values may be useful in identifying lesions in the neonatal brain.
Diffusion-weighted MR imaging is increasingly being used to investigate neonatal cerebral pathologic lesions. Previous studies have shown that diffusion-weighted imaging (DWI) is able to demonstrate lesions that are not always discernible on conventional MR imaging, and the usefulness of this imaging technique to assess infarction1-3 and metabolic disorders4,5 in the neonatal brain is established. In addition to the qualitative assessment of injury, diffusion tensor imaging (DTI) provides directionally invariant measurements of mean diffusivity and diffusion anisotropy. These objective measurements provide information regarding water molecular mobility, which reflect tissue microstructure and thereby provide insight into mechanisms of brain development and disease processes.
Diffusion-weighted MR imaging with b-values of more than 2000 s/mm2 has been performed in animal studies,6,7 in the adult brain,8-14 and in infants.8,15 These studies suggest that diffusion contrast characteristics are altered at higher b-values. In addition, adult studies of cerebral infarction13 and white matter disease14 have shown increased lesion conspicuity at higher b-values, and so it is possible that high b-value DTI in neonates may also improve lesion conspicuity.
To our knowledge, the only studies investigating the effects of high b-value diffusion imaging in the neonatal brain were done on infants whose results on conventional MR imaging was considered normal and did not examine the full diffusion tensor.8,15 In this prospective study, we tested the hypothesis that diffusion imaging at high b-values enhances contrast between lesions and normal tissue in neonates and thereby increases lesion conspicuity. Furthermore, we acquired diffusion data in 6 noncollinear directions of sensitization, enabling us to examine the effects of high b-values on diffusion anisotropy.
The aims of this study were 1) to assess isotropic DWI contrast and lesion conspicuity at b-values between 350 and 3000s/mm2 and 2) to assess whether apparent diffusion coefficient (ADC) or fractional anisotropy (FA) in the neonatal brain change with increasing b-value.
Materials and Methods
Subjects
The study group consisted of 17 neonates (8 boys and 9 girls) of gestational ages ranging from 26 to 42 weeks, who underwent MR imaging for clinical indications. The median (range) age of the infants at scanning was 10 (2–96) days (median postmenstrual age at scanning, 41 [39–45] weeks). One infant was imaged twice. Neonates were sedated for imaging with oral chloral hydrate (20–50 mg/kg). Pulse oximetry and electrocardiogram were monitored throughout the procedure. Ear protection was used for each infant (Natus MiniMuffs; Natus Medical, San Carlos, Calif). An experienced neonatologist trained in MR imaging procedures was in attendance throughout the MR examination.
MR Imaging
MR imaging was performed on a 3T Intera system (Philips Medical Systems, Best, the Netherlands) with use of a 6-channel, phased-array head coil. Transverse T2-weighted fast spin-echo and 3D MPRAGE images were acquired before DTI was obtained. The conventional MR images were assessed by an experienced neonatal neuroradiologist (M.A.R.).
Single-shot echo-planar imaging DTI was acquired in 6 noncollinear directions with b-values of 0, 350, 700, 1500, and 3000 s/mm2. The pulse sequence parameters used were as follows: TR, 5000 ms; TE, 100 ms; section thickness, 4 mm; FOV, 220 mm; and matrix, 96 × 96. The number of signals averaged (NSA) was increased with increasing b-value; 2 NSA (b = 350 s/mm2), 4 NSA (b = 750 s/mm2), 6 NSA (b = 1500 and 3000 s/mm2). The duration of the diffusion gradient pulses was 36 ms, and the time interval between their leading edges was 49 ms for all b-values. The b-value was increased by increasing the amplitude of the diffusion gradients (maximum 21 mT/m). In addition, DTI was obtained with use of the same parameters described above on a spherical phantom containing dimethyl sulfoxide (DMSO), which was positioned in the head coil at the isocenter of the magnet before commencing the infant imaging study.
Data Analysis
Phantom Data.
Measurements were taken from a circular region of interest measuring 740 mm2. To assess hardware or pulse sequence errors, ADC and FA values were plotted against b-value.
Infant Data.
Image contrast and lesion conspicuity at each b-value were assessed visually by 2 investigators (S.J.C. and M.A.R.) and by calculating the contrast ratio as described by Meyer.13 The contrast ratio between unmyelinated (frontal) white matter and central gray matter (thalamus), between unmyelinated white matter and partially myelinated white matter (central white matter at the level of the centrum semiovale), and between partially myelinated, highly anisotropic white matter (posterior limb of the internal capsule) and central gray matter was determined with use of equation [1].13 The contrast ratio between lesions and adjacent tissue in infant 4 and infant 17 was also assessed.  1) where CR = contrast ratio, S1 and S2 are the signal intensities of regions on the isotropic diffusion images.
In addition, regions of interest were positioned in the central white matter at the level of the centrum semiovale, frontal white matter at the level of the basal ganglia, occipital white matter, the splenium of the corpus callosum, the posterior limb of the internal capsule, and the thalamus on the ADC and FA maps. ADC and FA values were plotted against b-value for each region.
Results
Phantom Data
Phantom data showed little change in ADC (Fig 1A) or FA (Fig 1B) over the range of b-values.
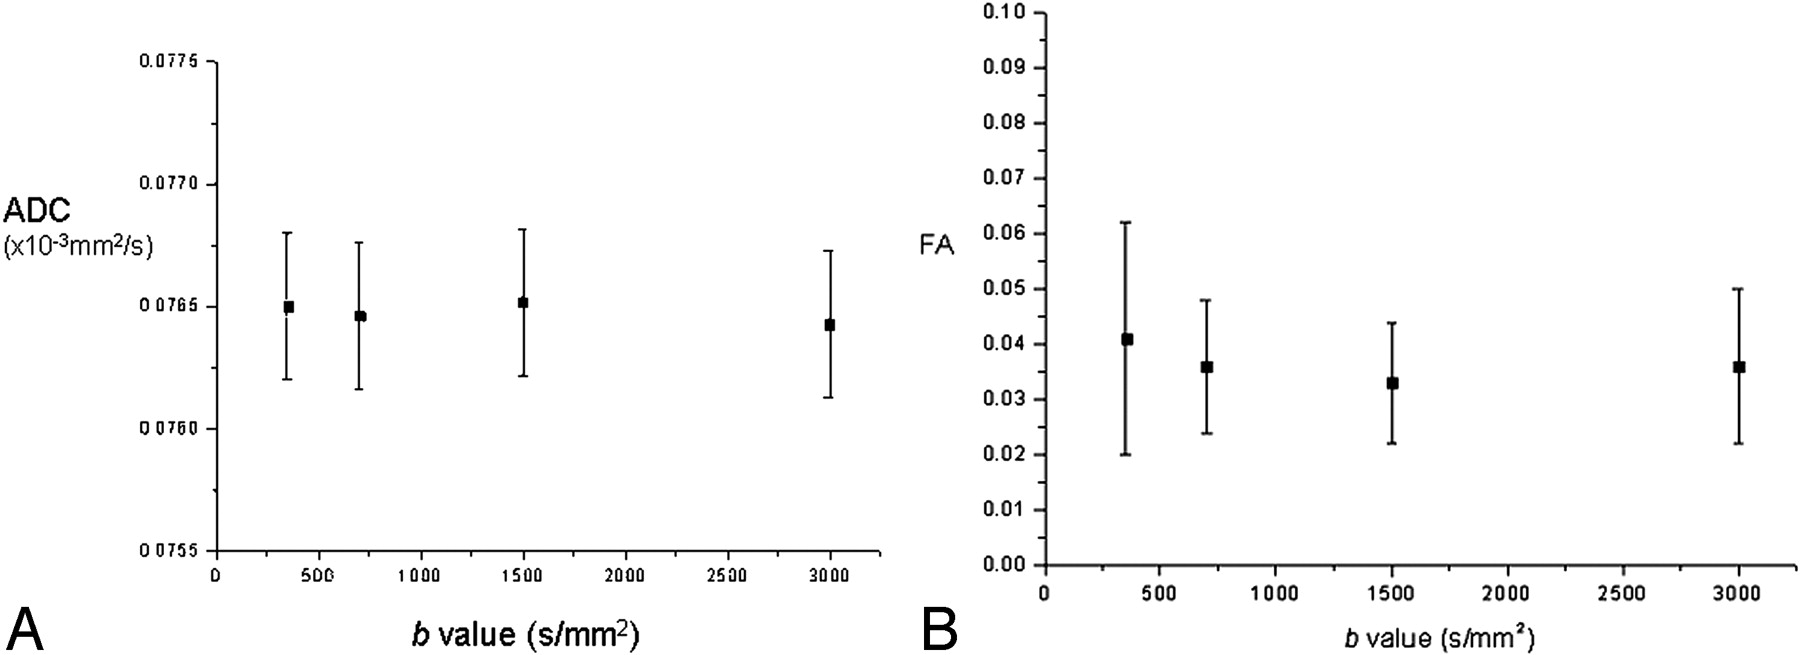
A, Graph demonstrating ADC value versus b-value in a spherical DMSO phantom. B, Graph demonstrating FA value versus b-value in a spherical DMSO phantom.
Infant Data
Conventional Imaging.
Infant 1 (gestational age 41 weeks, female, scan day 7) had perinatal asphyxia. Conventional imaging (CI) showed posterior fossa and hemispheric subdural hemorrhage, small foci of abnormal signal intensity in the posterior lateral lentiform nucleus. Infant 2 (38 weeks, male, scan day 3) had ventricular dilation noted on antenatal sonography. CI showed extensive subependymal heterotopias and abnormal cortical folding, no myelin within the posterior limb of the internal capsule, abnormal signal intensity in the thalamus and lentiform, and a hypoplastic cerebellar vermis. Infant 3 (26 weeks, day 3, female, scan day 96) was assessed at term corrected age. CI showed mild bilateral lateral ventricular dilation, residual hemorrhage from previous intraventricular hemorrhage evident on the ventricular wall, and myelin appropriate for postmenstrual age at scan. Infant 4 (40 weeks, male, scan day 5) had right-sided focal seizures. CI showed a left-sided anterior branch middle cerebral artery infarct and abnormal signal intensity in the left posterior limb of the internal capsule and thalamus. Infant 5 (40 weeks, female, scan day 18) had repetitive jerking episodes. CI showed focal regions of short T2 in temporal white matter. Infant 6 (39 weeks, female, scan day 25) was hypotonic at birth and had poor feeding. CI showed foci of abnormal signal intensity in the globus pallidum and thalamus. Myelin was not present in the posterior limb of the internal capsule, and abnormally long T1 and T2 was evident throughout the white matter. Infant 7 (42 weeks, female, scan day 9) had hypotonia, hip contractures, and poor feeding. Diagnosis was Prader-Willi syndrome. CI showed an enlarged anterior extracerebral space, subdural hemorrhage, and abnormal folding of the frontal cortex. Infant 8 (40 weeks, male, scan day 8) had perinatal asphyxia. Imaging showed no abnormalities. Infant 9 (41 weeks, male, scan day 17) had seizures, hypoglycemia, and hypotonia. Early diagnosis was hyperhomocysteinemia. Later diagnosis was Sotos syndrome. CI showed increased T1 and T2 in the white matter and foci of increased T2 in the basal ganglia and thalamus. Infant 10 (37 weeks, male, scan day 2) had perinatal asphyxia. CI showed hemorrhage within the right cerebellar hemisphere. The basal ganglia and thalamus appeared normal. Infant 11 (41 weeks, female, scan day 4) had neonatal seizures. CI showed left middle cerebral artery infarct with abnormal signal intensity within the left posterior limb of the internal capsule and thalamus. Infant 12 (38 weeks, female, scan day 3) had cerebellar hypoplasia suspected on antenatal sonography but normal imaging appearances on MR imaging. Infant 13 (37 weeks, female, scan day 16) had seizures and no definite diagnosis with no abnormalities on MR imaging. Infant 14 (41 weeks, male, scan day 5) had perinatal asphyxia. Imaging showed no abnormalities. Infant 15 (29 weeks, female, scan day 75) had prolonged rupture of membranes (6 weeks) and was scanned as part of a research cohort at term-equivalent age. CI showed very high signal intensity within the white matter on T2-weighted imaging and a subependymal cyst. Infant 16 (38 weeks, male, scan day 3) had periventricular cystic lesions observed on cranial sonography. Diagnosis was methylmalonic acidemias. CI showed generalized long T1 and long T2 in the white matter, foci of abnormal signal intensity within the cerebellum, and bilateral periventricular cysts anteriorly. Infant 17 (38 weeks, male, scan day 6) had perinatal asphyxia. CI showed bilateral abnormal signal intensity within the basal ganglia and thalami extending into the brain stem. Multiple small “hemorrhagic” foci were observed within the white matter.
Visual Assessment of Isotropic DWIs
At b = 350 s/mm2 unmyelinated white matter was high signal intensity relative to the central gray matter and the cortex. Highly anisotropic white-matter regions such as the posterior limb of the internal capsule were demonstrated as very slightly hyperintense relative to the thalamus. At b = 700 s/mm2, there was little contrast between unmyelinated white matter and the central gray matter. The posterior limb of the internal capsule was seen as very slightly hyperintense relative to the thalamus. At b = 1500 s/mm2 unmyelinated white matter was low signal intensity relative to the central and cortical gray matter. Highly anisotropic white matter regions were hyperintense relative to both gray matter and unmyelinated white matter. At b = 3000 s/mm2 unmyelinated white matter was extremely low signal intensity relative to the central and cortical gray matter. Highly anisotropic white-matter fiber bundles were markedly hyperintense relative to other brain tissues. The cerebellum was demonstrated as very high signal intensity. Figure 2 shows isotropic DWIs at the level of the centrum semiovale and the basal ganglia level for the 4 different b-values in an infant who had no evidence of abnormality on conventional MR or diffusion imaging (infant 3).
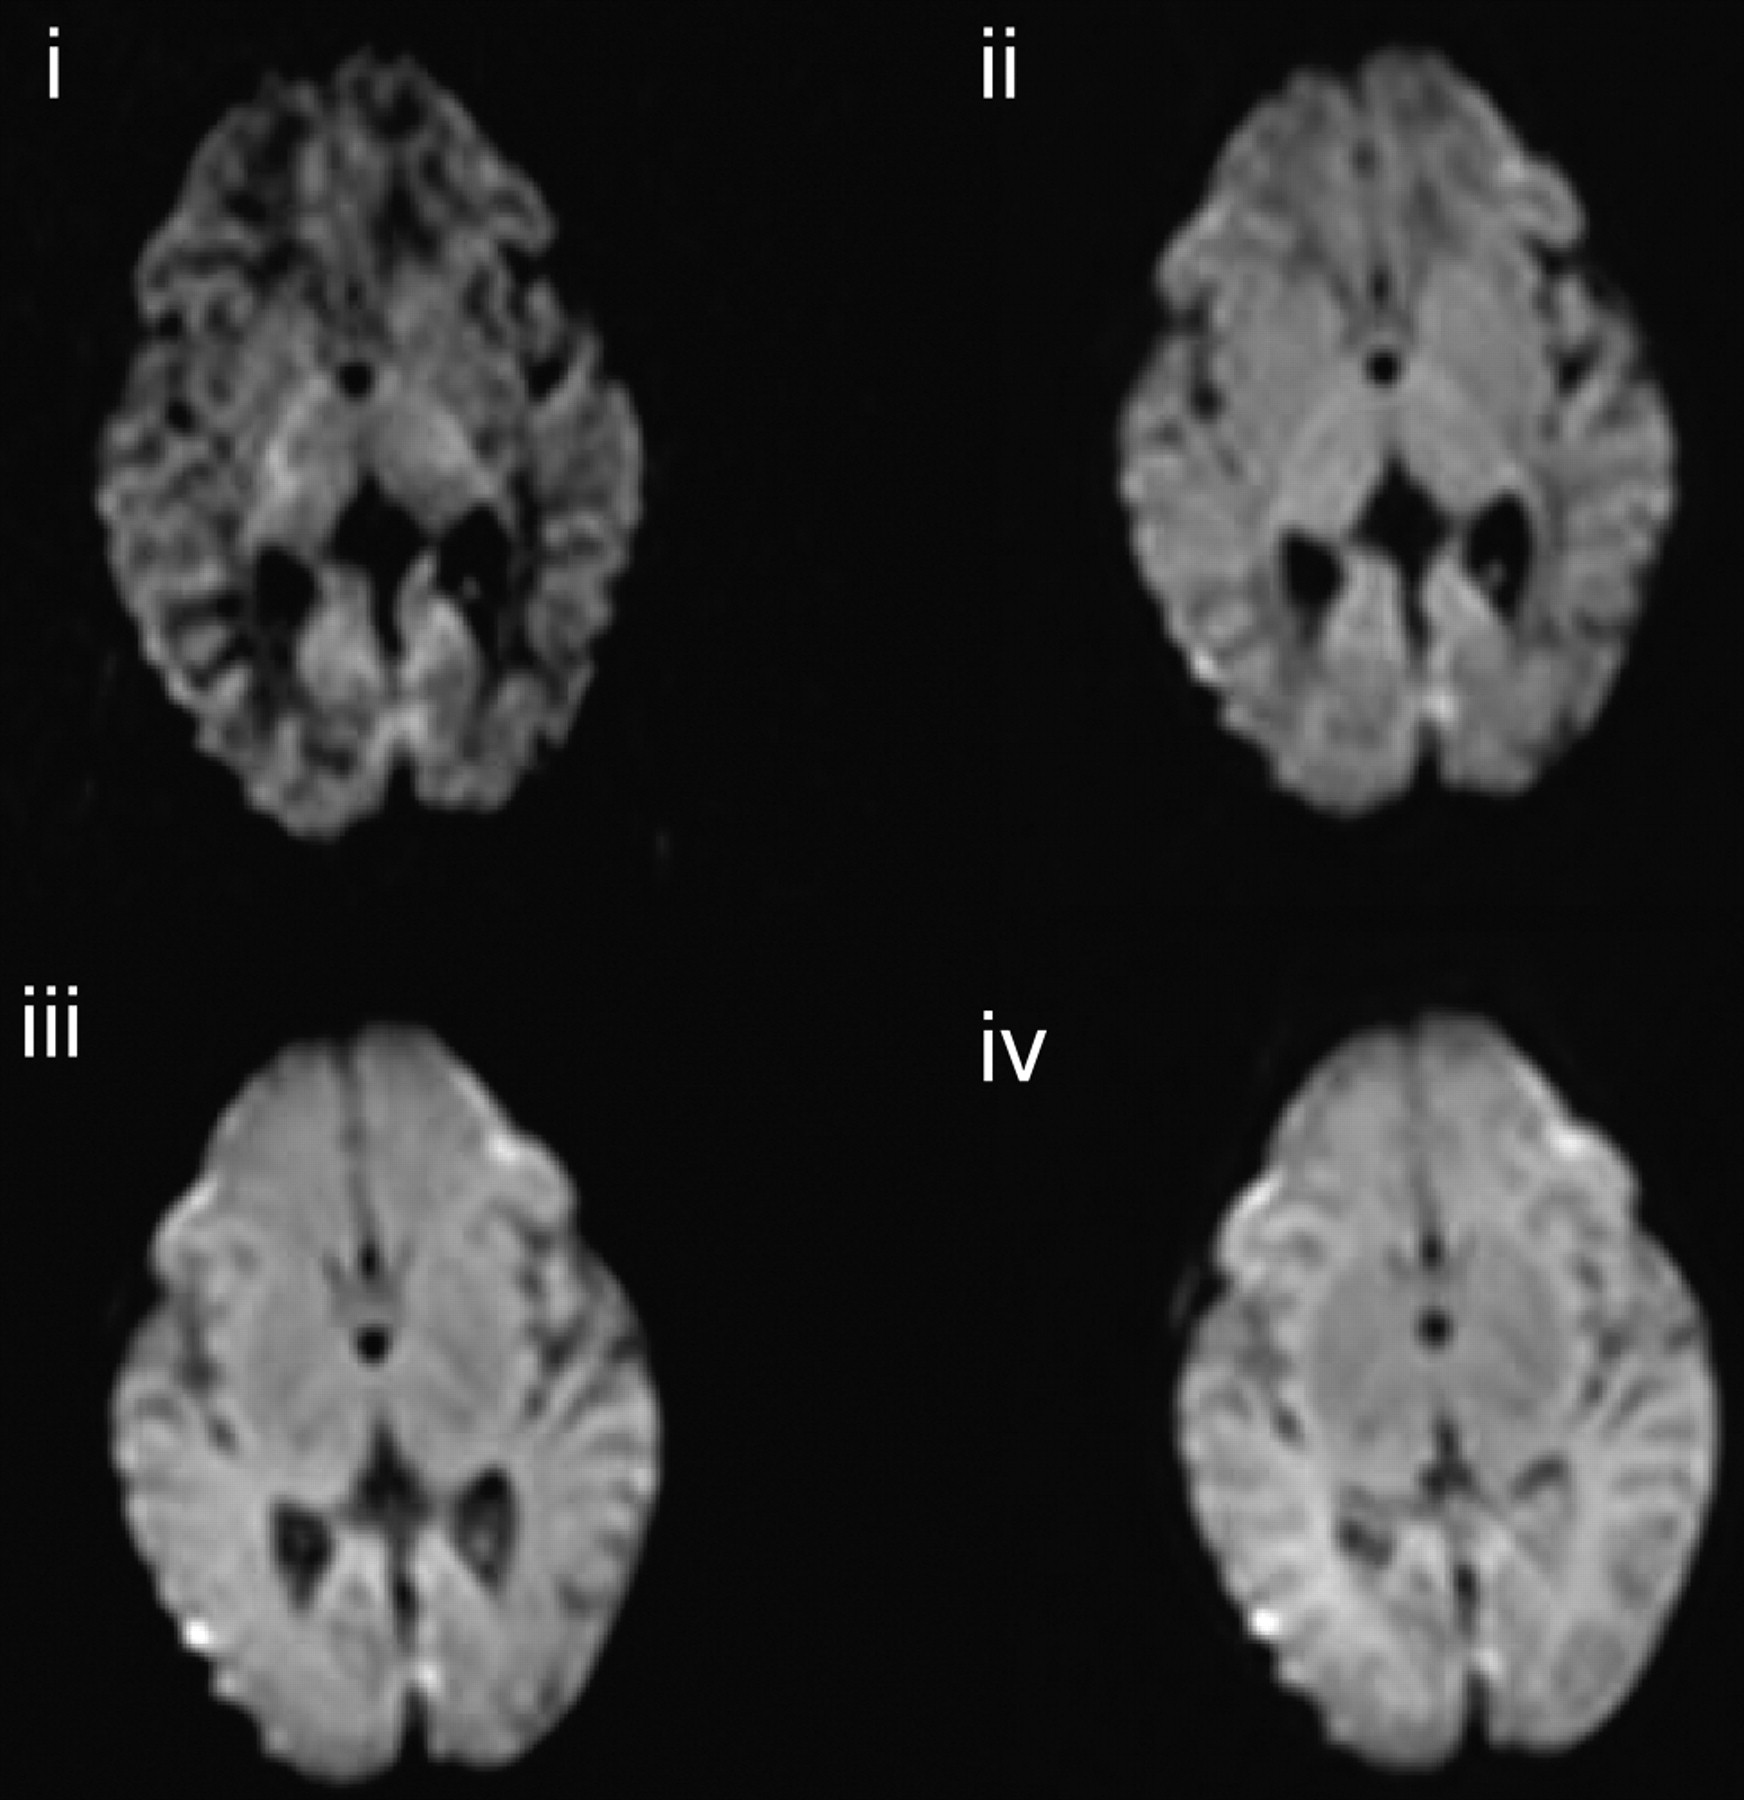
Isotropic DWI at the level of the basal ganglia in an infant (infant 3) who has no evidence of abnormality on conventional or DWI (i, b = 3000 s/mm2; ii, b = 1500 s/mm2; iii, b = 700 s/mm2; iv, b = 350 s/mm2).
Visual Assessment of Lesion Conspicuity on Isotropic DWIs and ADC Maps
In the cases of acute infarction, no new lesions were identified on isotropic DWIs obtained at higher b-values compared with those observed at lower b-values. However, the contrast between regions of abnormality and adjacent tissue increased with increasing b-value. Signal intensity change in the corticospinal tracts distal to the region of infarction consistent with wallerian degeneration was much more clearly seen on the ADC map obtained from the b = 3000 s/mm2 diffusion data than on those obtained at the lower b-values. High b-value DTI also clearly showed abnormal signal intensity of the thalamic nuclei related to the injured cortex. Figure 3 shows isotropic DWIs of a left anterior branch middle cerebral artery infarction with abnormal signal intensity in the posterior limb of the internal capsule (Fig 3A) and wallerian degeneration in the mesencephalon (Fig 3B). Susceptibility artifact in the frontal and temporal regions appeared diminished on the high b-value DWIs, and a region of infarction in the left temporal region was more clearly seen on the b = 3000 and b = 1500 s/mm2 isotropic DWIs compared with those obtained at lower b-values (Fig 3B).

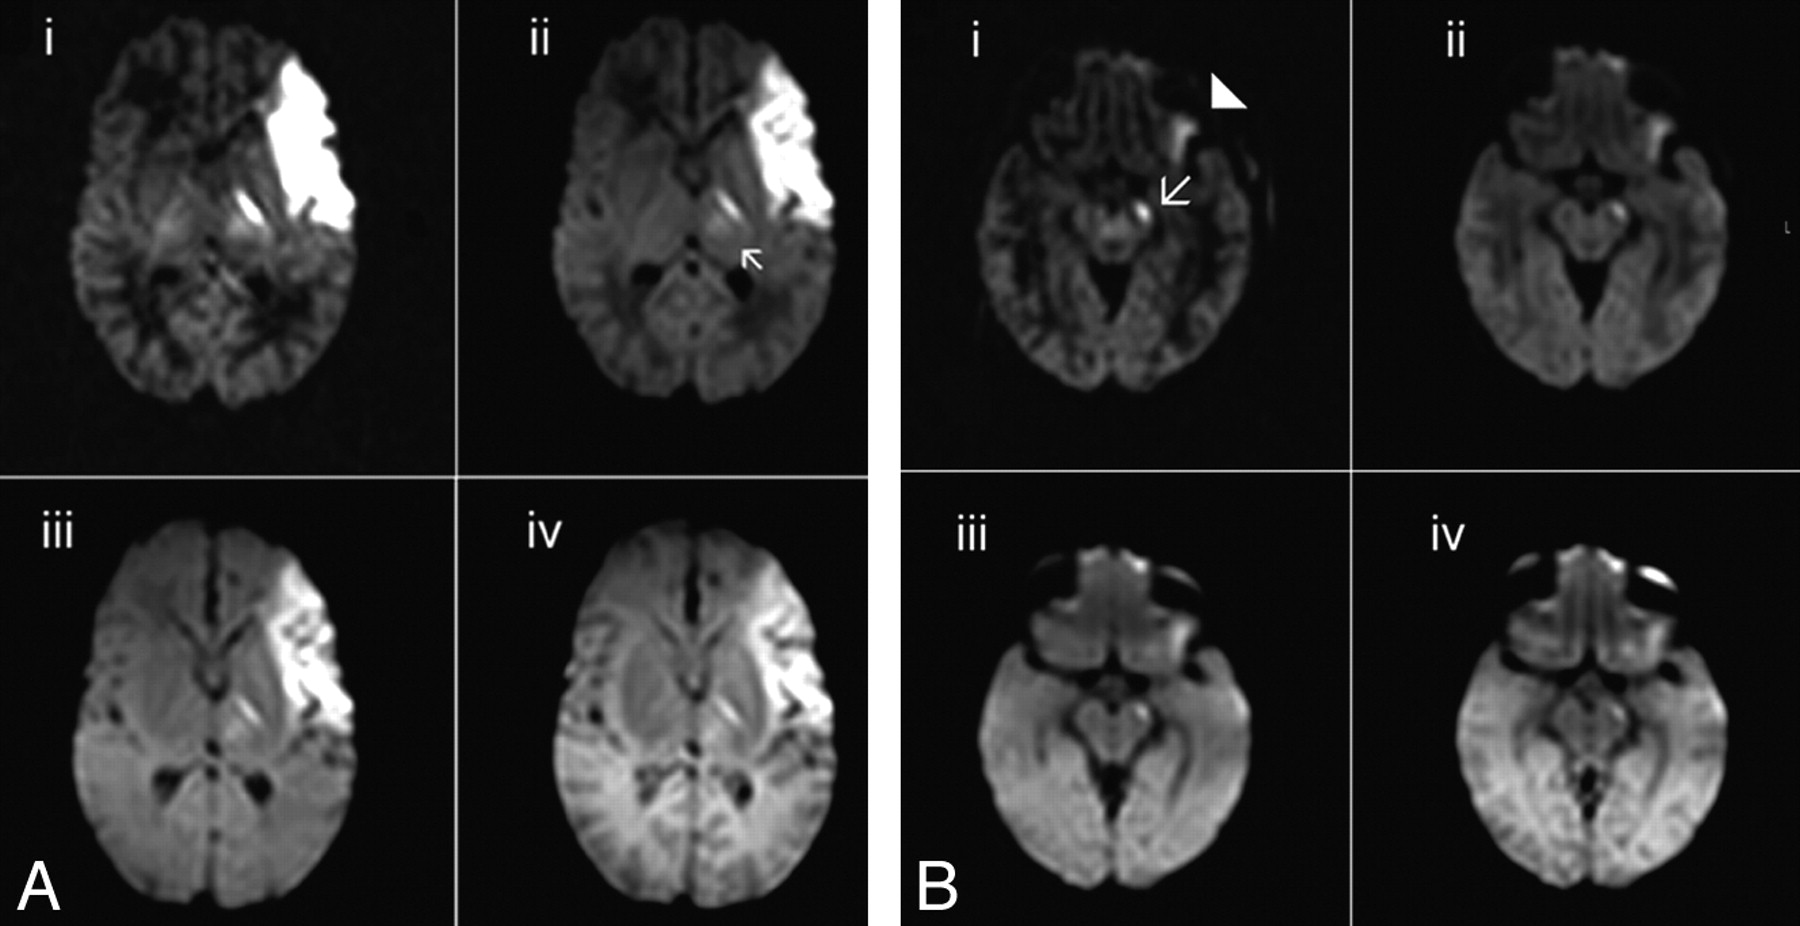
A, Isotropic DWIs demonstrating a left middle cerebral infarct in a term born infant (infant 4) and abnormal signal intensity in the left posterior limb of the internal capsule and left thalamus (arrow) (i, b = 3000 s/mm2; ii, b = 1500 s/mm2; iii, b = 700 s/mm2; iv, b = 350 s/mm2). B, Isotropic DWIs demonstrating wallerian degeneration in the corticospinal tracts of the left mesencephalon (arrow). Susceptibility artifact appears reduced on the higher b-value isotropic DWIs, thereby allowing the infarct in the left temporal lobe to be more clearly visualized (arrowhead) (i, b = 3000 s/mm2; ii, b = 1500 s/mm2; iii, b = 700 s/mm2; iv, b = 350 s/mm2).
Follow-up images at 1 month of age in infant 11 with a left posterior branch middle cerebral artery infarct demonstrated abnormal high signal intensity within the left posterior limb of the internal capsule on the b = 3000 s/mm2 isotropic diffusion image. This lesion was not observed at lower b-values (Fig 4).
Isotropic DWIs in a term-born infant with a left-sided middle cerebral artery infarction (infant 11) at 4 weeks of age demonstrating residual abnormal high signal intensity in the posterior limb of the internal capsule on the left on the b = 3000 s/mm2 isotropic DWI (arrow), not demonstrated on the images obtained at lower b-values. T2 shinethrough in the region of the infarct is reduced at high b-values (i, b = 3000 s/mm2; ii, b = 1500 s/mm2; iii, b = 700 s/mm2; iv, b = 350 s/mm2).
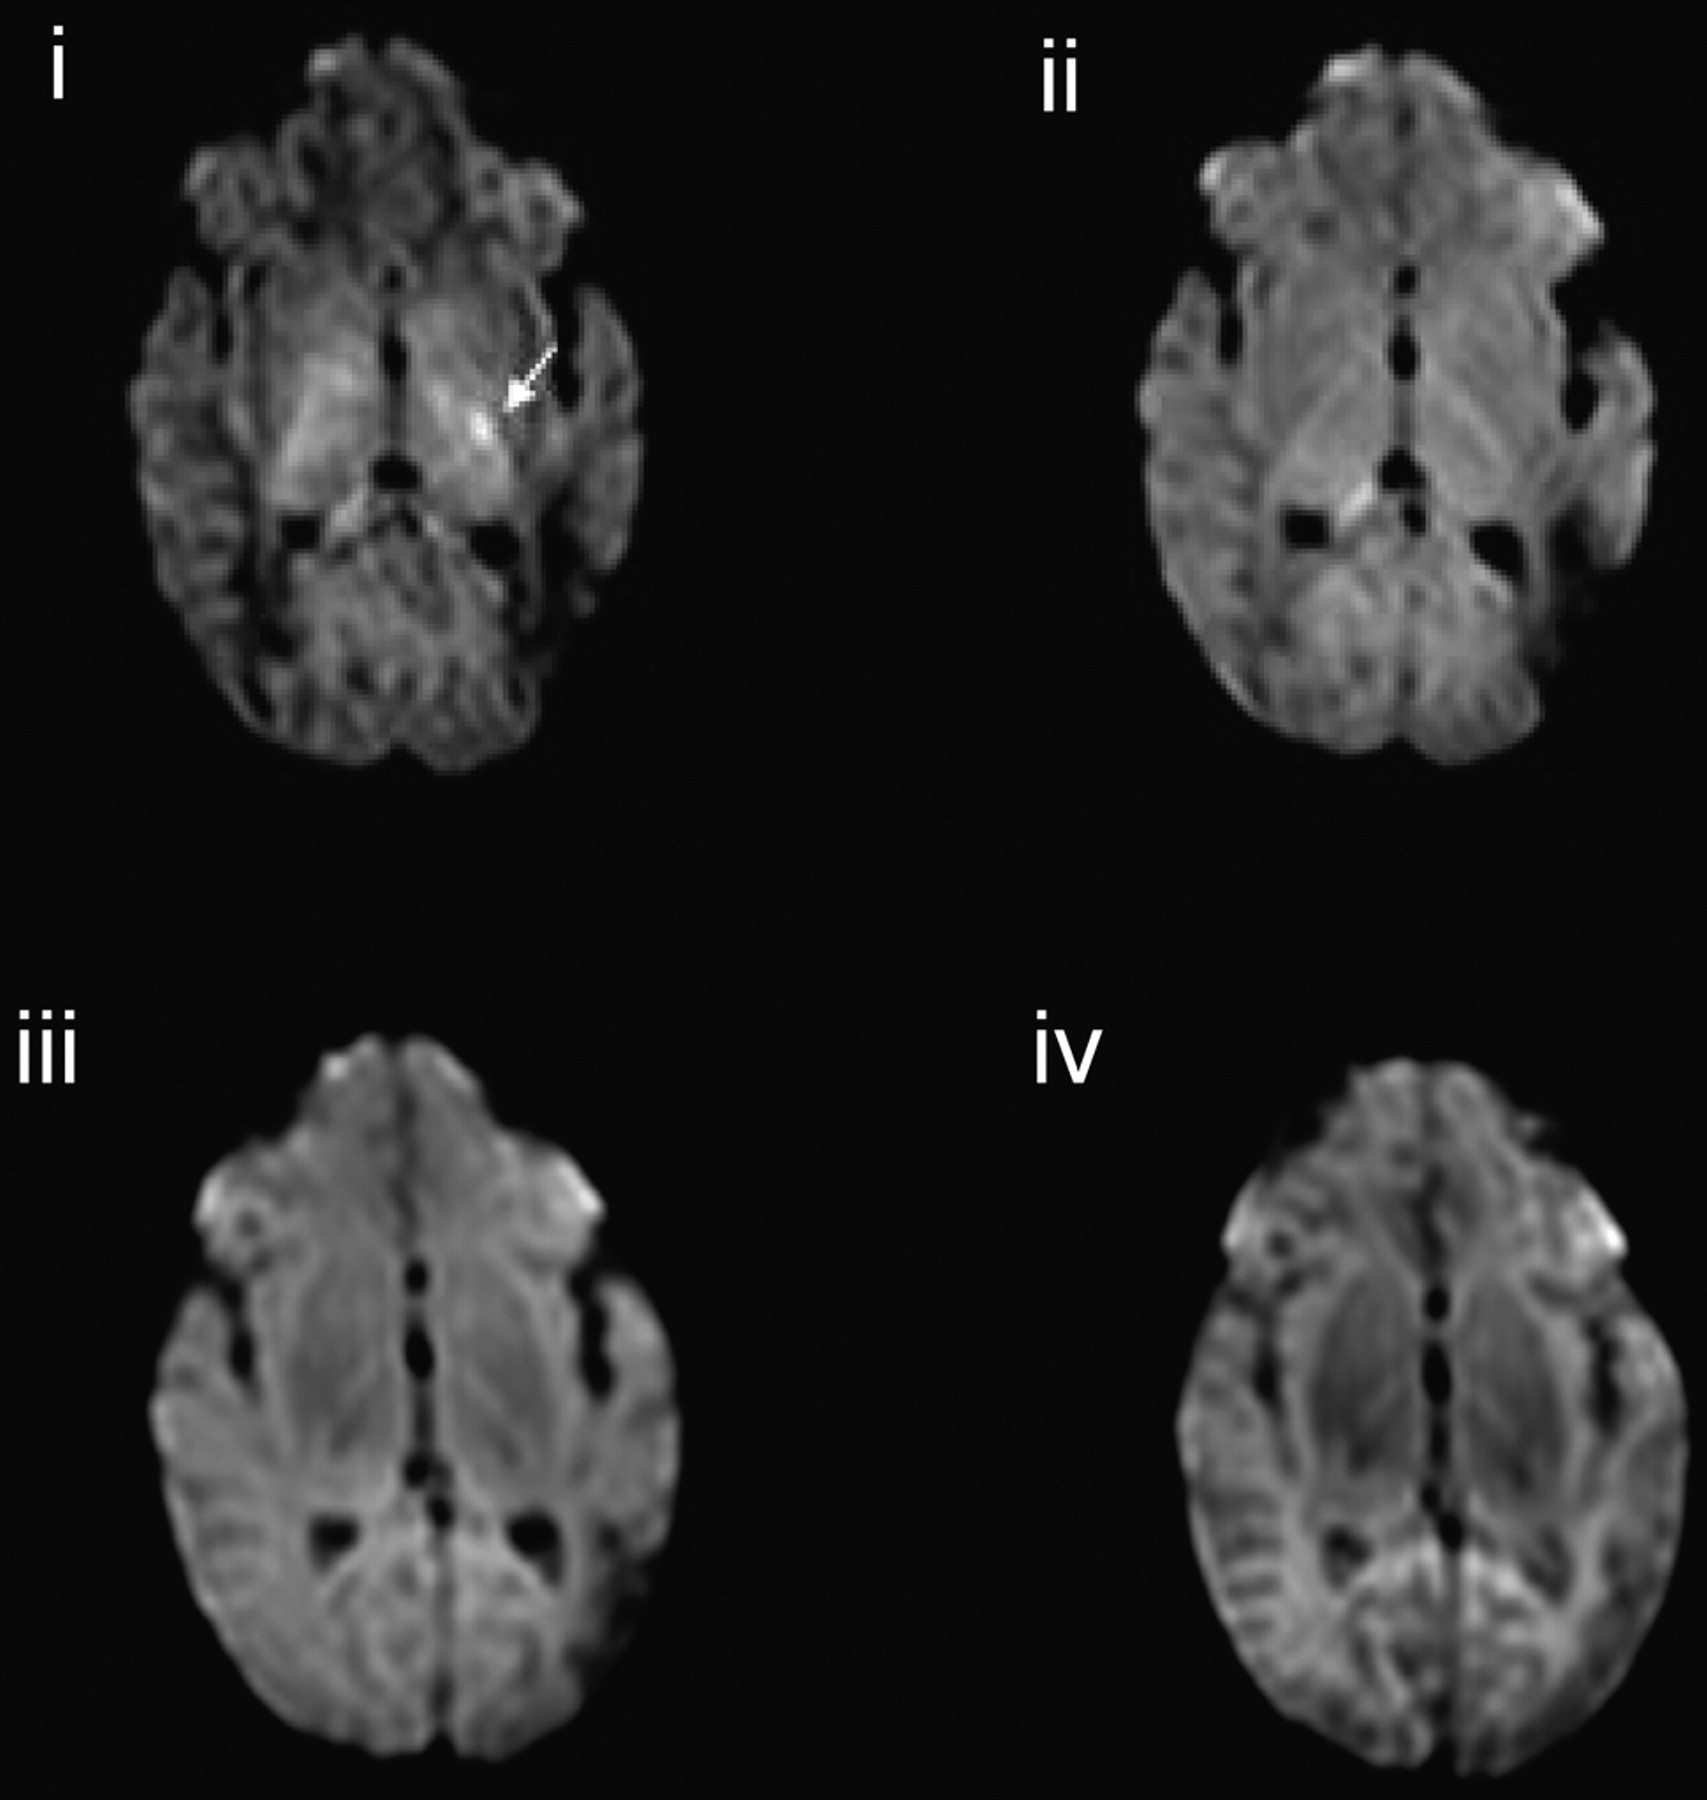
In 3 of the 4 infants presenting with hypoxic-ischemic encephalopathy (infants 8, 10, and 14), no new lesions were identified on high b-value DTI. However, in infant 17, lesions in the basal ganglia and in the mesencephalon were visualized on the isotropic DWIs obtained at b = 3000 and b = 1500, which were not seen on those obtained at lower b-values (Fig 5).
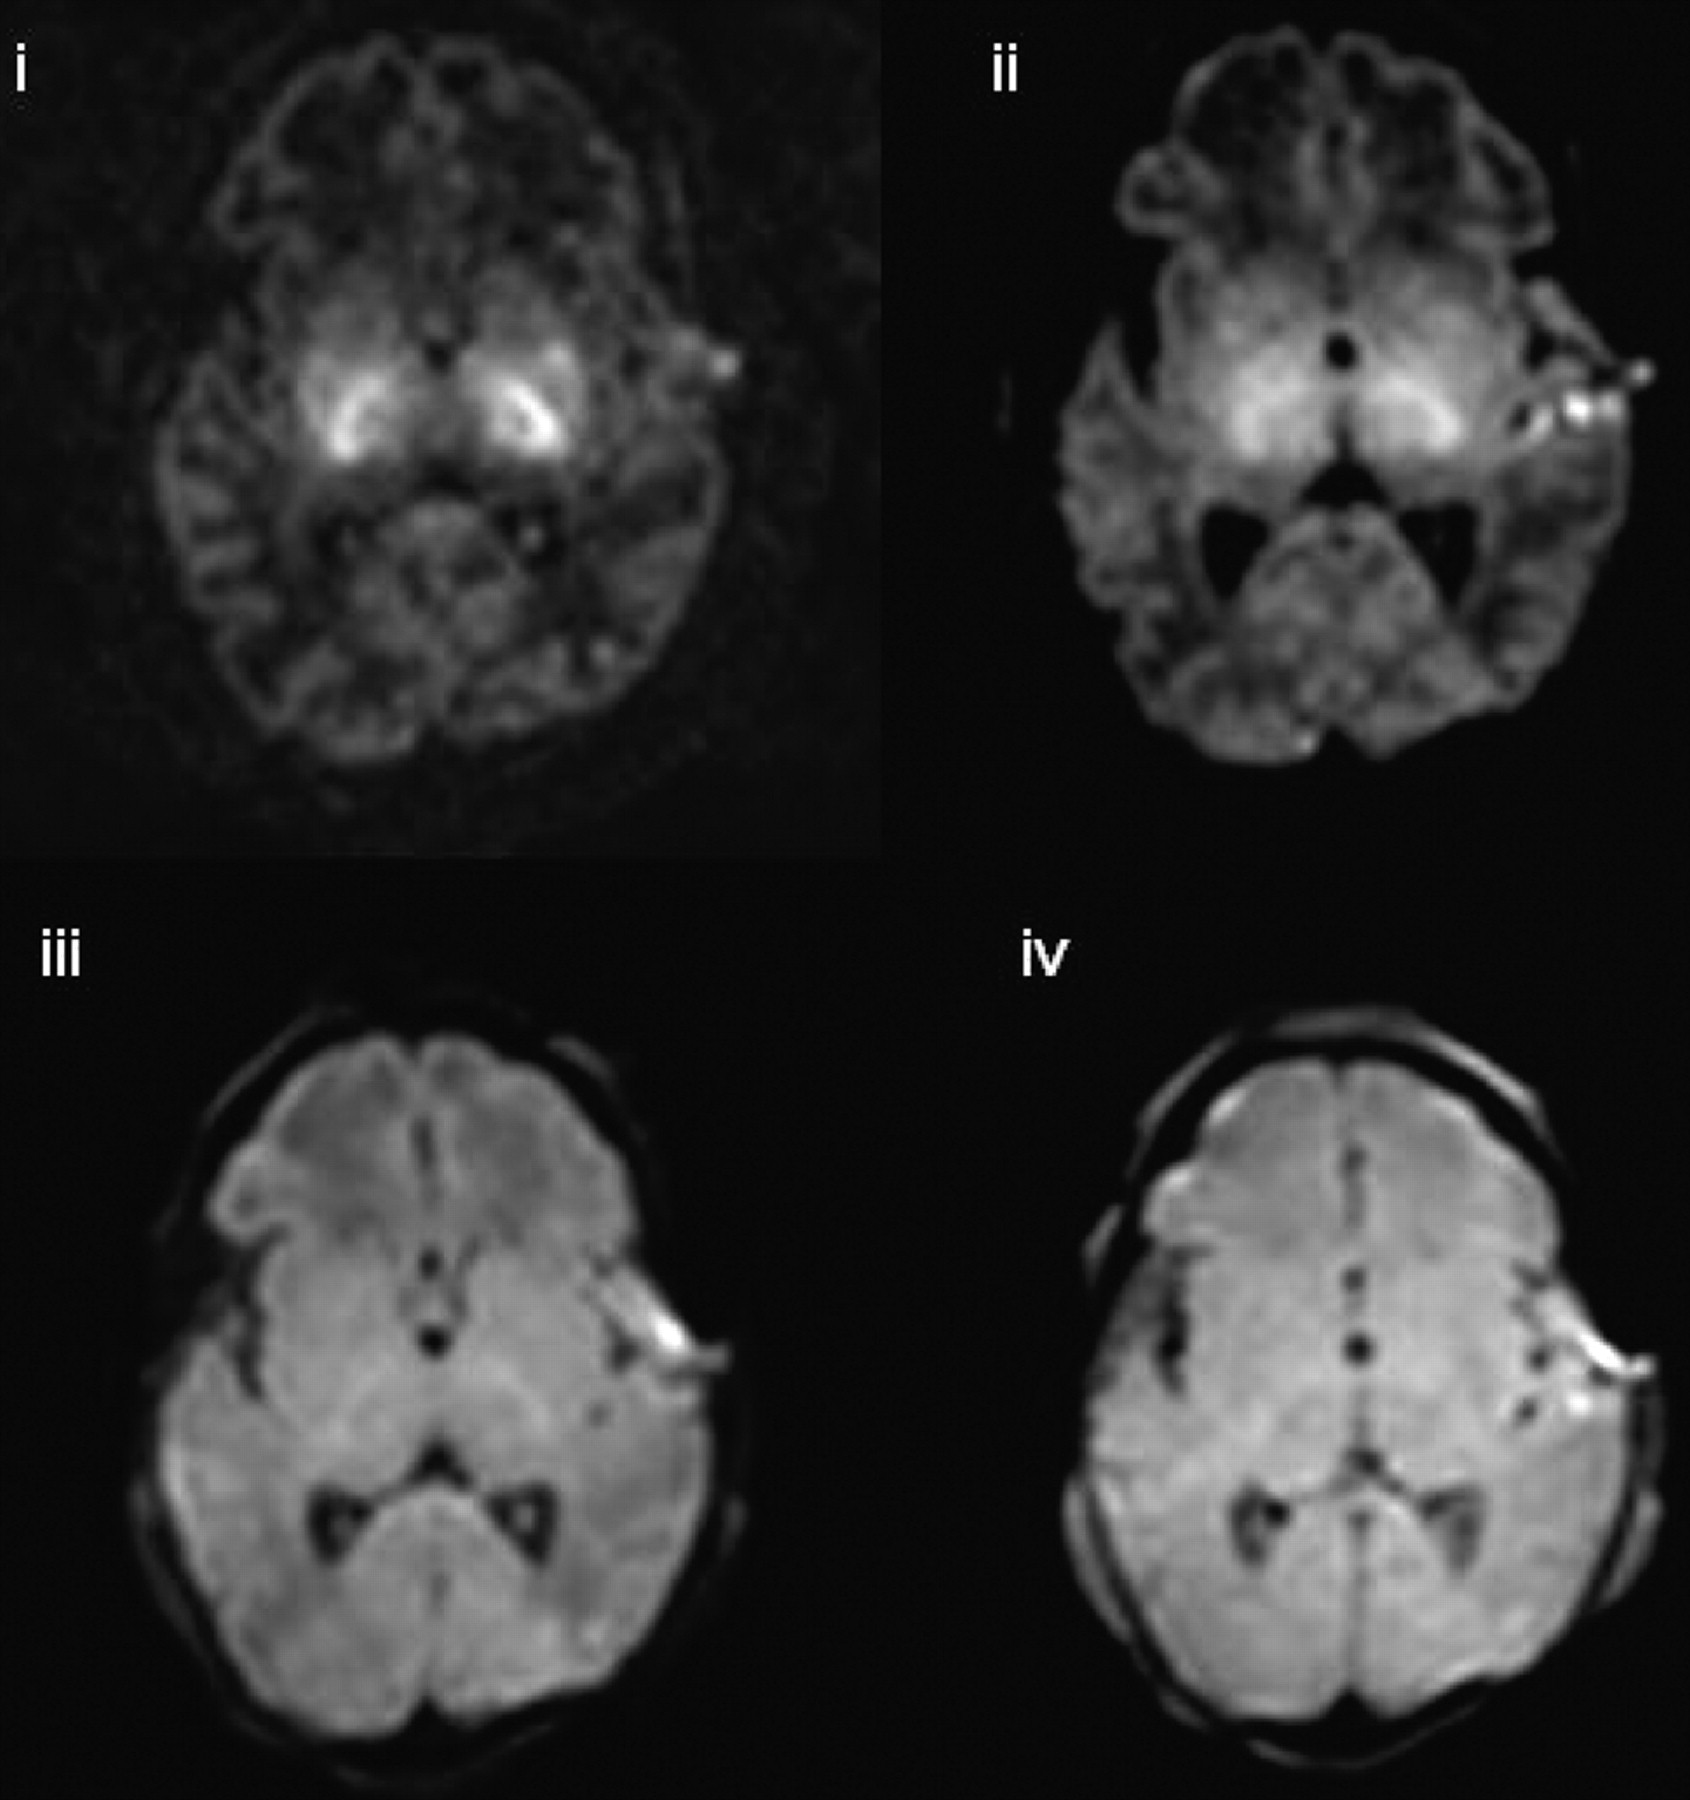
Isotropic DWI at the level of the basal ganglia in a term-born infant who had a history of perinatal asphyxia (infant 17). Lesions in the basal ganglia and in the mesencephalon are visualized on the isotropic DWIs obtained at b = 3000 and b = 1500, which are not seen at lower b-values (i, b = 3000 s/mm2; ii, b = 1500 s/mm2; iii, b = 700 s/mm2; iv, b = 350 s/mm2).
Contrast Ratio on Normal-Appearing Isotropic DWIs
The contrast ratio between unmyelinated (frontal) white matter and central gray matter (thalamus) and partially myelinated white matter (central white matter at the level of the centrum semiovale) increased with increasing b-value for those infants who had no focal lesions on conventional MR or diffusion imaging. The contrast ratio between the thalamus and the posterior limb of the internal capsule also increased with increasing b-value. Figure 6 shows contrast ratios for the posterior limb of the internal capsule versus the thalamus, the thalamus versus the frontal white matter, and the central white matter of the centrum semiovale the versus the frontal white matter for infant 3.
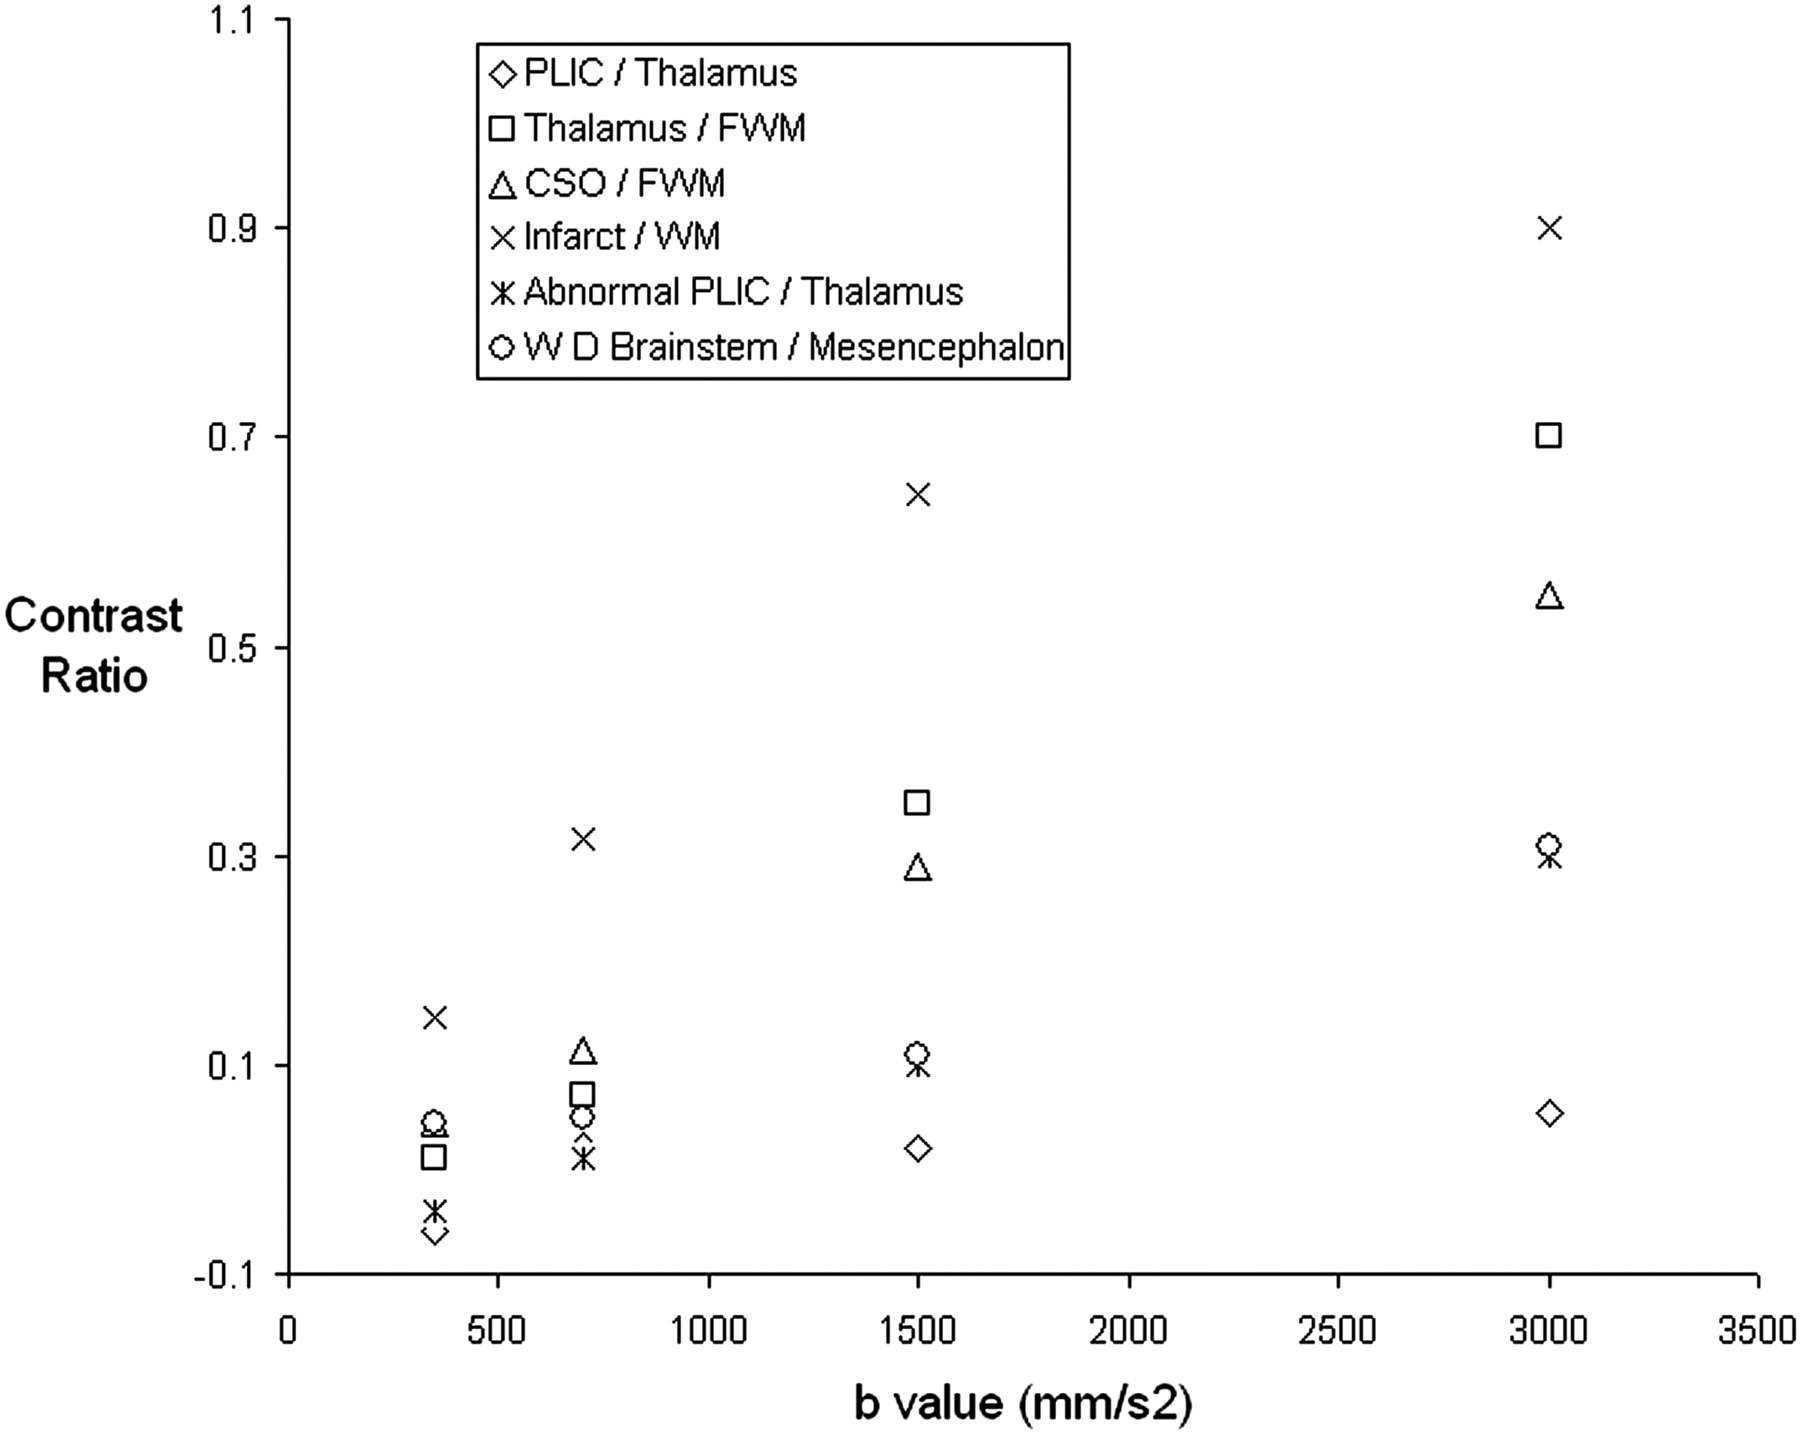
Graph demonstrating contrast ratios between adjacent tissues on isotropic DWIs of an infant whose conventional and DWI appear normal (infant 3) and between areas of abnormal signal intensity and adjacent tissues on isotropic DWIs (infant 4).
Contrast Ratio of Lesions to Adjacent Tissue on Isotropic DWIs
Figure 6 shows the contrast ratios obtained for the signal intensity of the isotropic DWIs of a left-sided middle cerebral artery territory infarct (infant 4) versus the adjacent white matter, the abnormal posterior limb of the internal capsule versus the adjacent thalamus, and the region of wallerian degeneration in the corticospinal tracts versus the adjacent mesencephalon tissue. The contrast ratio between the lesion and the adjacent tissue increased with increasing b-value for all regions of abnormality examined.
ADC and FA Values
ADC values decreased with increasing b-value in all regions studied. In white matter, there was an approximately linear trend in the reduction of ADC with increasing b-value, whereas in the thalamus ADC declined more slowly at higher b-values. There was no consistent change in FA with increasing b-value in the neonatal brain. Figure 7 shows change in ADC and FA with b-value for infant 3, who had no evidence of focal pathologic changes on conventional MR or DWI.
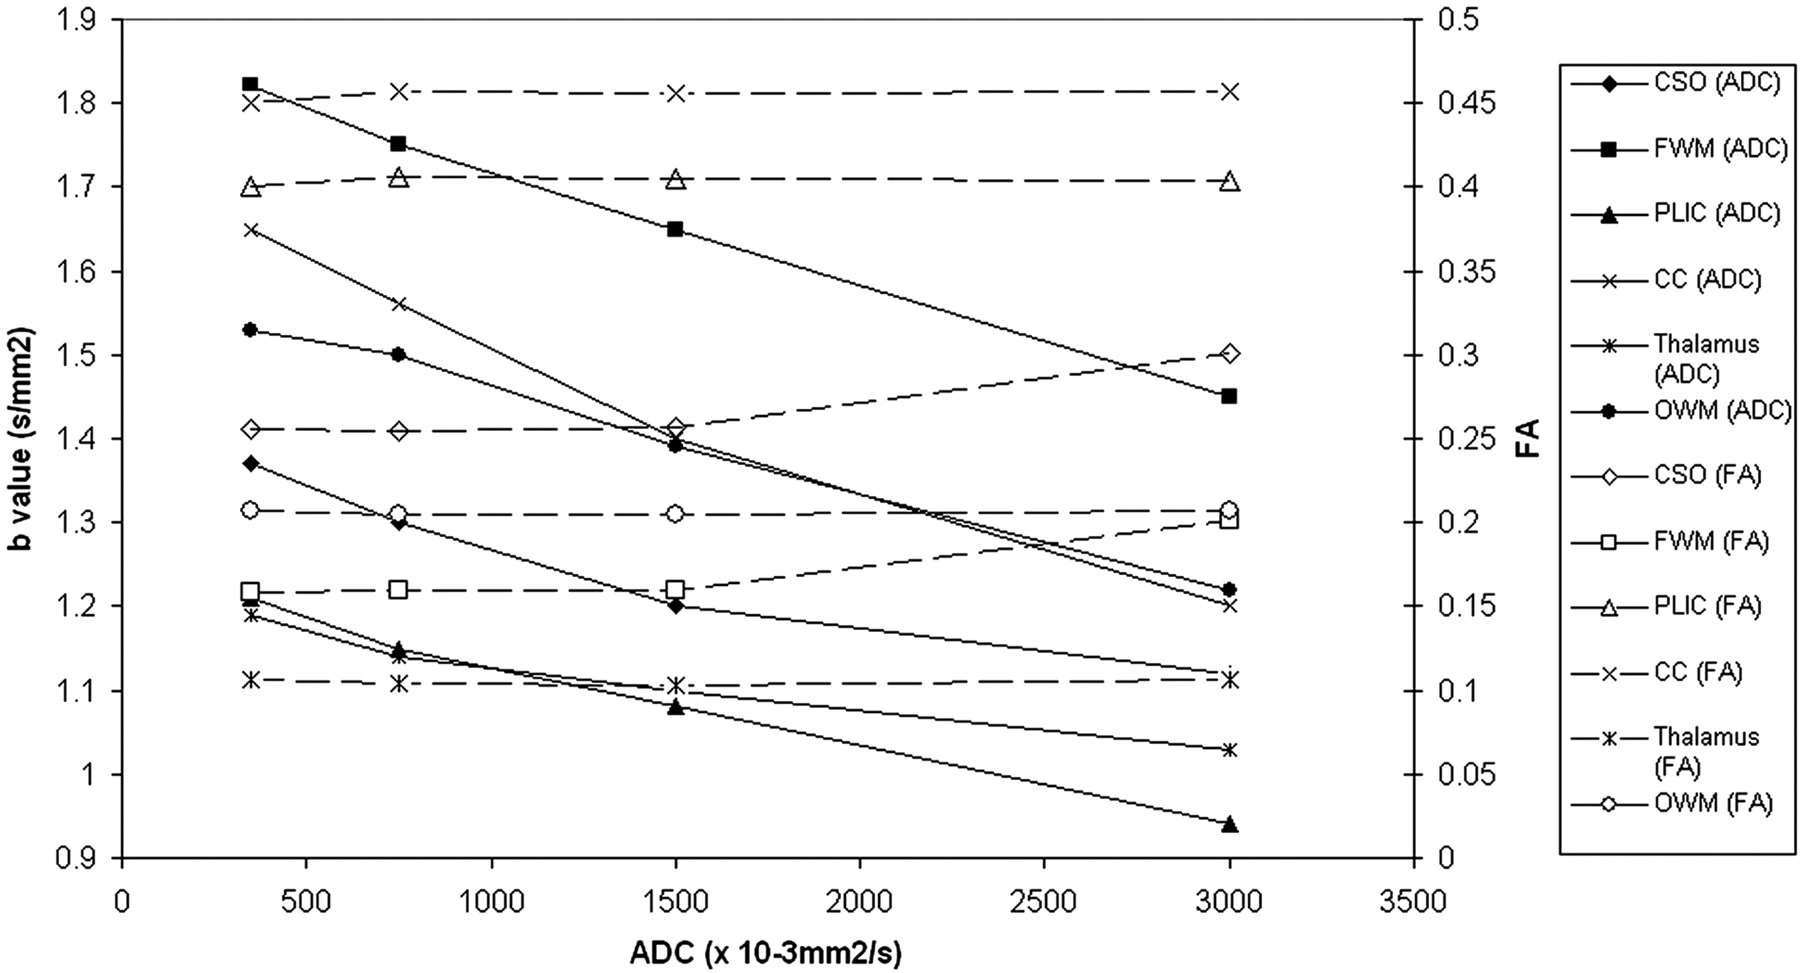
Graph demonstrating ADC (closed shapes) and FA (open shapes) values versus b-value for an infant whose conventional and DWI appear normal (infant 3).
Discussion
This study shows that image contrast and lesion conspicuity on isotropic DWIs increase with increasing b-value. Our results show that for b-values between 350 and 3000 s/mm2, FA values are not altered by increasing b-value, but ADC values in the white matter and central gray matter decrease with increasing b-value.
The following considerations were taken into account when choosing the range of b-values used in this study: 1) b-values of more than 3000 s/mm2 did not show significant improvement in contrast ratios in adults compared with lower b-values,13 and signal-to-noise ratio is reduced at high b-values. Although the higher signal-to-noise ratio afforded by imaging at 3T means that high b-value DTI of the neonatal brain is feasible, even at this field strength, multiple signal intensity averages were required to achieve adequate signal-to-noise ratio. This increases image acquisition time and, hence, susceptibility to image degradation from patient motion, which is of particular importance when imaging is performed on neonates. Thus, we chose 3000 s/mm2 as our maximal b-value. 2) b-values used in clinical neonatal DTI scans are usually lower than those used in adult brain studies because b-values corresponding to 1.1/ADC have been thought to provide the best contrast-to-noise ratio;16 thus, we included an acquisition at a b-value of 700 s/mm2. 3) We acquired data at the other 2 points, a low but nonzero b-value (350 s/mm2), and an intermediate value (1500 s/mm2) to be able to assess the change in ADC and FA over a range of b-values. However, to avoid prohibitively long examination times, we investigated only 4 different b-values in this study. This prevented us from exploring the possible nonmonoexponential nature of diffusion signal intensity decay in the neonatal brain at high b-values.
We observed that contrast on isotropic DWIs increases at b-values of more than 700 s/mm2. Similar to adult studies of infarction,13 our instances of acute infarction demonstrated that lesion conspicuity was increased at higher b-values. This was particularly striking in showing abnormal signal intensity changes distal to the infarction consistent with early wallerian degeneration in the brain stem and in the posterior limb of the internal capsule. In addition, high b-value DTI made abnormal signal intensity in the ipsilateral thalamus more conspicuous. It has been shown that neonate stroke involving extensive parts of cerebral cortex immediately leads to a secondary network injury in the thalamus presenting as increased signal intensity on DWI.17 Among our cohort in a neonate with an anterior branch middle cerebral artery infarction, higher b-values revealed more clearly abnormal signal intensity of the thalamic nuclei related to the injured cortex. The relevance of network injury for prognosis is as yet unknown. The use of higher b-values to reveal acute network injury might give more insights.
In acute asphyxia, the diagnostic role of DWI/DTI in the evaluation of deep gray matter injury is still not clear. In some cases, DWI underestimated the extent of lesions or provided no additional information compared with conventional MR imaging, whereas in other cases lesion detection was increased on DWI.18 In this study, lesions were observed in the basal ganglia and mesencephalon at higher b-values in 1 infant with hypoxic-ischemic encephalopathy that were not apparent at lower b-values. This finding suggests that the increase in isotropic diffusion image contrast with increasing b-value may have an important clinical use to identify lesions in some pathologic processes in the neonatal brain. On review of our images, DTI obtained at a b-value of 1500 s/mm2 seemed to be the most useful to identify additional pathologic processes and to provide good tissue contrast while maintaining adequate signal-to-noise ratio. However, care must be taken in interpreting these images because the increasing contrast-to-noise ratio observed at high b-values may potentially lead to misinterpretation of normal tissue as pathologic.
Reductions in ADC values with increasing b-values have previously been demonstrated in animal,6,7 adult,8,9,11-13 and pediatric studies.8,15 In the adult brain, the ADC value of myelinated white matter becomes lower than that of gray matter with increasing b-value.9,10 In this study, ADC values in the partially myelinated posterior limb of the internal capsule became lower than ADC values in the thalamus at higher b-values. However, ADC values in the other white matter regions studied here remained higher than those obtained in the central gray matter at all b-values, reflecting the higher ADC of unmyelinated white matter compared with myelinated white matter.19,20 In addition, although the reduction in ADC with increasing b-value was approximately linear in the white matter, the rate of reduction in ADC values in the thalamus decreased at higher b-values, suggesting that the difference between ADC values in the fast and slow compartments is less in central gray matter than in unmyelinated white matter. The change in measured ADC with different b-values must be taken into account when attempting to compare diffusion data obtained at different imaging centers.
To our knowledge, the change in diffusion anisotropy with increasing b-value has not been previously investigated in neonates, and the results of previous studies in adults are conflicting. One study observed no change in FA with increasing b-value,9 consistent with the findings of our study, and suggests that the reduction in ADC is proportional for all eigenvectors of the diffusion tensor.9 However, a more recent DTI study observed that FA of the slow component was significantly higher than that of the faster component.11 This finding concurs with previous estimates of anisotropy (the anisotropy index) in the different compartments.12 The reasons for the differing results between these adult brain studies9,11 are not clear, as both examined central gray matter and the posterior limb of the internal capsule and used b-values up to 5000 s/mm2. However, it is possible that the differing results are because of the different approaches to calculating FA. Yoshiura et al9 used the same method as that used in our study to calculate FA at each b-value, whereas Maier et al11 obtained fits for the fast and slow components of diffusion on a pixel-by-pixel basis by using all measured b-values and then calculated FA separately for the 2 components. Additional DTI studies over an extended range of b-values and with use of the method described by Maier11 are required to confirm that FA does not change with increasing b-value in the neonatal brain.
Our results show a wide range of ADC and FA values in different regions in infants with no abnormalities identified on conventional or DWI. These findings are in agreement with previous DTI studies in neonates at low b-values, which have demonstrated greatest anisotropy in the highly organized white matter bundles of the corpus callosum and posterior limb of the internal capsule.19 The lower ADC values and larger FA values in the central white matter of the centrum semiovale compared with the frontal and occipital white matter probably reflect the more advanced maturation of this white matter region because the corticospinal tracts of the precentral and postcentral sulcus show evidence of myelination in term neonates, but the occipital white matter does not show evidence of myelination until 3 months and the frontal white matter until around 6 months after birth.21 Diffusion anisotropy in the thalamus is lower than in the white matter in adults22 and neonates,20,23 which is consistent with the cytoarchitecture of this structure.
Conclusion
Our results show that at up to b-values of 3000 s/mm2, FA is not altered by increasing b-value, but ADC values in the white matter and central gray matter decease with increasing b-value. In all of the white matter regions we studied, this decrease was approximately linear; however, in the thalamus, the decrease in ADC with increasing b-value appeared to be nonlinear. Isotropic diffusion image contrast and lesion conspicuity increased with increasing b-value. In acute infarction, DTI obtained at high b-values more clearly revealed a secondary network injury in the ipsilateral thalamus, and some lesions were identified in other pathologic processes on high b-values that were not visible at lower b-values. Therefore, high b-value DTI may have an important clinical use in identifying lesions in the neonatal brain and understanding the timing and site of injury secondary to primary insults.
Acknowledgments
We are grateful for support from the National Institute for Health Research (NIHR) Hammersmith/St. Mary's Comprehensive Biomedical Research Centre, the NIHR postdoctoral award scheme, Philips Medical Systems, the Medical Research Council, the Academy of Medical Sciences, The Health Foundation, and the Garfield Weston Foundation. We would also like to thank the staff of the neonatal units at Hammersmith and Queen Charlotte's Hospitals. We are especially grateful to the parents and the infants who took part in this study.
Footnotes
Permission for this study was granted by the Hammersmith Hospitals Research Ethics Committee. Written, informed parental consent was obtained for each infant before scanning.
References
- Received April 9, 2008.
- Accepted after revision June 9, 2008.
- Copyright © American Society of Neuroradiology
In this issue


Jump to section
Related Articles
Cited By...
- Effects of Tissue Temperature and Injury on ADC during Therapeutic Hypothermia in Newborn Hypoxic-Ischemic Encephalopathy
- Diffusion Tensor Model links to Neurite Orientation Dispersion and Density Imaging at high b-value in Cerebral Cortical Gray Matter
- A Decade of DTI in Traumatic Brain Injury: 10 Years and 100 Articles Later
- Non-Gaussian Analysis of Diffusion-Weighted MR Imaging in Head and Neck Squamous Cell Carcinoma: A Feasibility Study