
Abstract
BACKGROUND AND PURPOSE:Estimation of the stability of fusiform aneurysms of the basilar artery requires precise monitoring of the luminal and outer wall volumes. In this report we describe the use of MR imaging and 3D postprocessing methods to study the evolution of those aneurysms.
MATERIALS AND METHODS:Nine patients with fusiform basilar artery aneurysms underwent MR imaging studies covering at least 2 different time points (mean delay between studies, 7.1 ± 4.6 months). Imaging included multisection 2D T1-weighted fast spin-echo and/or 3D steady-state imaging to assess the outer wall and contrast-enhanced MR angiography to study the lumen. The outer and inner walls were extracted using, respectively, a manual delineation (made by 2 observers) and a thresholding technique. The 2 studies were subsequently coregistered at each time point, as well as between differing time points. Volumes of each vessel component were calculated.
RESULTS:Mean volume was 6760 ± 6620 mm3 for the outer wall and 2060 ± 1200 mm3 for the lumen. Evolution of the lumen and outer wall was highly variable from 1 patient to another, with a trend toward increase of the vessel wall for the largest aneurysms. Interobserver reproducibility for outer wall delineation was on the order of 90%.
CONCLUSION:Combining MR imaging methods to study both the outer wall and lumen with 3D registration tools provides a powerful method for progression of fusiform basilar aneurysmal disease.
Fusiform aneurysmal disease of the basilar artery presents significant treatment challenges because of the need to spare perforator branches that supply the brain stem, which often originate from the aneurysm itself.1 Because of this, clinicians will usually choose to forego interventions in patients who are determined to have such aneurysms. These patients are then followed clinically, as well as with regular imaging studies, to determine whether there is any marked change over time in symptoms or aneurysm morphology that might prompt an extraordinary intervention.2
Aneurysmal disease poses risks from several factors. Aneurysm rupture can have devastating consequences. Slow recirculation of blood within aneurysmal segments can result in thrombus formation with a potential for embolic stroke. An additional significant risk factor is the potential for symptoms secondary to mass effect, because the aneurysm expands and impinges on sensitive structures along the brain stem. This expansion can result from growth of the aneurysm lumen but also from the remodeling of the outer wall of the lumen, because thrombus deposits on the wall, whereas the lumen remains unchanged or even shrinks.
It has not previously been possible to provide a comprehensive analysis of the evolution of aneurysmal disease over time. Conventional angiography fails in this regard because of 2 important limitations. In projection angiography, noncircular geometries are view-angle dependent, and dimensions are typically assessed by estimates of orthogonal linear dimensions. Those estimates are subjective, and it is virtually impossible to reproduce the same projection views in studies at different time points. Although rotational conventional angiography is less prone to some limitations of projection angiograms, volumetric measurements are not routinely available, and quantitative measures are unreliable, because luminal rendering is qualitative. The second limitation of conventional angiography is that it fails to evaluate the outer wall.
The evaluation of the disease status in cases of luminal and/or vessel wall remodeling would be greatly improved by imaging methods that provide a reliable visualization of the inner and outer walls of the artery. An ideal imaging evaluation would be noninvasive and would provide the ability to quantitatively measure the volume of the lumen and of the wall by using 3D imaging with isotropic resolution. Suitable postprocessing would allow for the coregistration of sequential studies, ensuring that identical regions were compared over time. In this report, we describe the use of MR imaging methods as applied to aneurysmal disease of the vertebrobasilar system in patients who were followed with serial imaging over time. 3D methods were used to obtain angiograms of the lumen, as well as high-contrast studies of the wall. A quantitative analysis was performed to determine changes in aneurysm morphology over time in each of these patients.
Materials and Methods
Population
After institutional review board approval and informed consent, 9 patients (aged from 43 to 78 years; mean age, 65 ± 12 years) were included in this prospective study. All of the patients presented with intracranial fusiform basilar artery aneurysms that were deemed unsuitable for direct surgical treatment, such as clipping or coiling, because of unfavorable anatomy or high operative risk. In 1 patient, treatment was provided by occlusion of 1 vertebral artery and the placement of a bypass from the occluded vertebral artery proximal to the site of occlusion to the ipsilateral superior cerebellar artery. However, no direct manipulation of the aneurysmal segment of the vessel was performed. The radiologic monitoring of all of the patients consisted of repeated MR imaging studies scheduled at approximately 6- to 12-month intervals. The follow-up of some of the patients started in 2001 with regular contrast-enhanced (CE) MR angiography (MRA) imaging only (representative maximum intensity projection and multiplanar reconstruction images for 1 patient are shown in Fig 1), but we focus in this study on the last 2 years, where patients underwent imaging of the outer wall in addition to luminal imaging with CE-MRA.
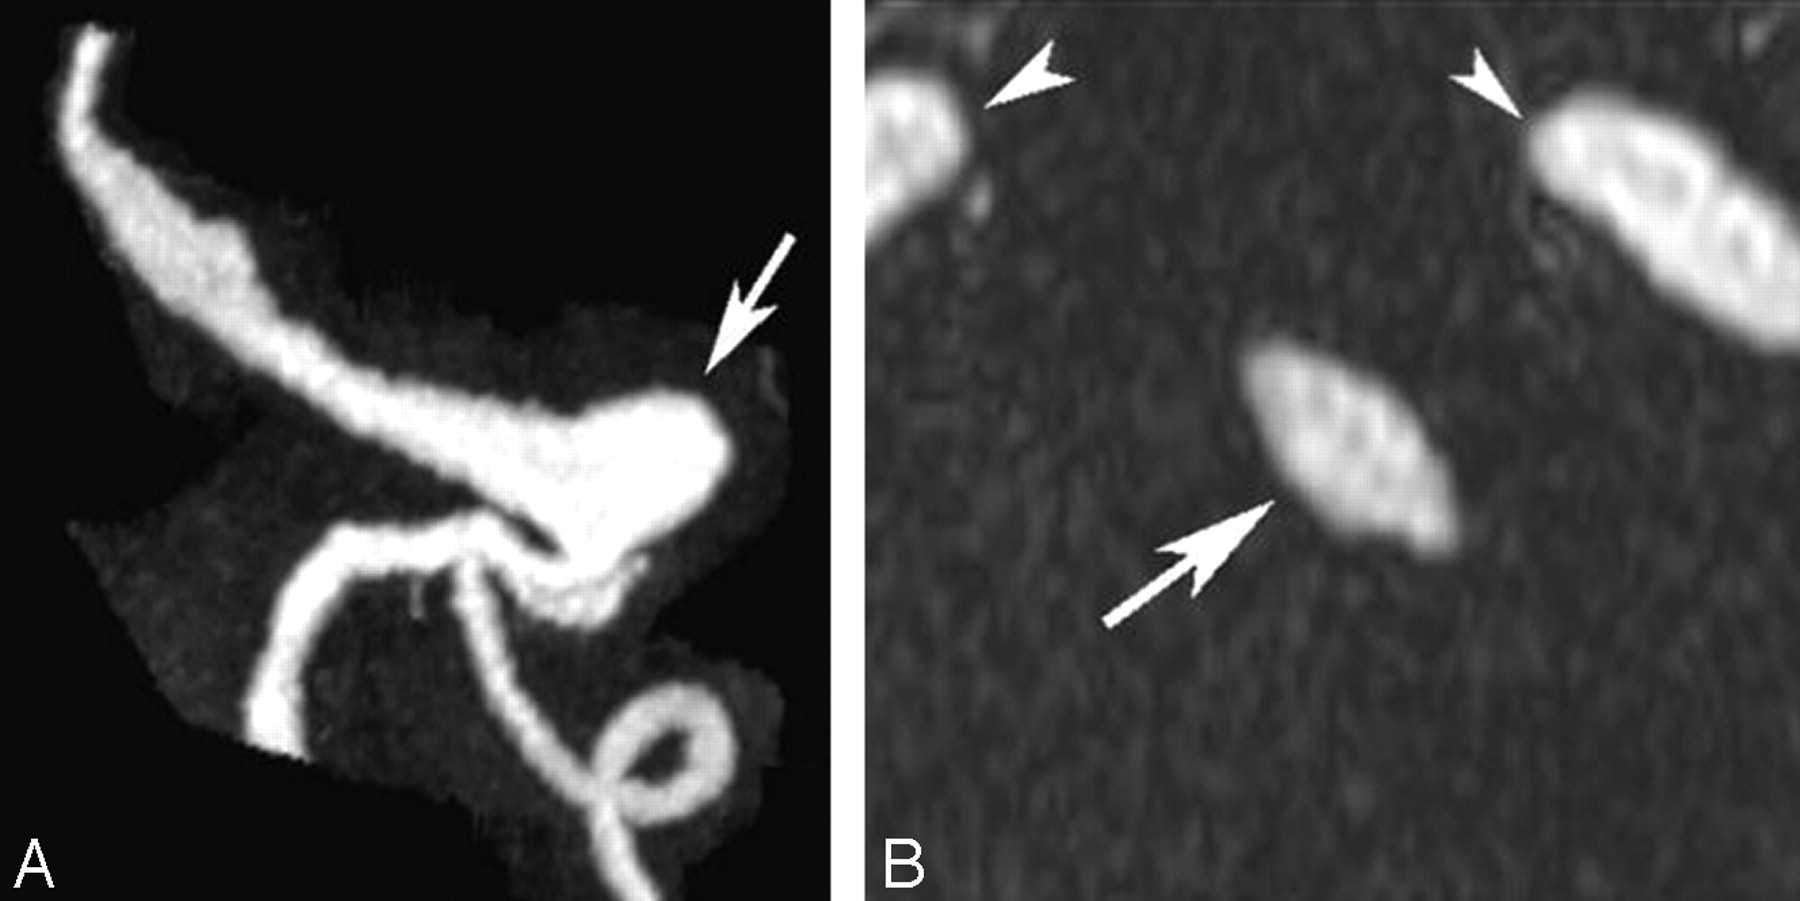
MRA study from a patient with a large aneurysm (arrow) of the basilar trunk. Left, Maximum intensity projection in a paracoronal plane. Right, Axial multiplanar reconstruction through the basilar artery (arrow). Also noted are the carotid arteries (arrowheads).
MR Imaging Protocol
MR studies were performed on a 1.5T scanner (Intera; Philips Medical Systems, Best, the Netherlands). A 2-step imaging protocol was used to assess both the outer wall and the lumen.
Outer Wall Imaging
First, the outer wall was studied by using axial T1-weighted and/or steady-state imaging covering the whole basilar trunk from the vertebrobasilar junction to the distal bifurcation of the basilar artery. MR images were obtained by using a T1-weighted 2D turbo spin-echo (T1-weighted TSE) sequence with the following parameters: TR = 400 ms, TE = 14 ms, flip angle = 90°, number of averages = 3, FOV = 220 mm, matrix = 304 × 304 ms (0-filled to 512 × 512 ms), section thickness = 2 mm, TSE factor = 3, and number of sections = 24. The resulting image resolution was 0.72 × 0.72 × 2 mm3 for an acquisition time of approximately 4 minutes. Steady-state imaging was performed by using a 3D balanced fast-field echo (bFFE) sequence with the following parameters: TR = 6 ms, TE = 2 ms, flip angle = 60°, number of averages = 3, FOV = 220 mm, matrix = 256 × 256 ms, section thickness = 1 mm, image resolution = 0.86 × 0.86 × 1 mm3, number of partitions = 50, and acquisition time = approximately 4 minutes.
Inner Wall Imaging
After soft tissue imaging, CE-MRA was performed by using a paracoronal 3D slab over the vessels of interest. Intravenous injection was delivered into the antecubital vein using a power injector. The time of contrast passage from injection site to the basilar artery was calculated by injecting a 2-mL bolus of gadolinium-diethylene-triaminepentaacetic acid (Gd-DTPA) followed by a 15-mL saline flush (all injected at 2 mL/s) and acquiring images at 1-second intervals. The time from injection to when signal intensity reached 90% of peak signal intensity enhancement was measured and used as the delay time between the injection and start of data acquisition for the 3D CE-MRA study. The CE-MRA sequence was acquired with an injection of 18 mL of GdDTPA followed by 15 mL of saline all delivered at 2 mL/s. The CE-MRA sequence used elliptic-centric phase reordering, and data were acquired using parallel imaging with an acceleration factor of 2. Imaging parameters included the following: TR/TE/flip angle = 5/2/30°. Images were acquired from a 54-mm paracoronal slab, with an FOV of 240 mm and an acquisition matrix of 400 × 380 × 45 ms 0-filled to 512 × 512 × 90 ms. The resultant images had a resolution of 0.6 × 0.63 × 1.2 mm3 and were interpolated to 0.47 × 0.47 × 0.6 mm3. Total acquisition time was of the order of 35 seconds.
Analysis
For outer wall analysis, both the T1-weighted TSE and the 3D bFFE datasets were manually processed, and the outer wall of the aneurysm was manually delineated on each section independently by 2 radiologist reviewers using a version of DicomWorks software (http://dicom.online.fr/)3 (Fig 2). This version allows for converting of the DICOM image to binary format by filling the interior and exterior parts of the manual-drawn contours with 2 different values while keeping the spatial information included in the original DICOM header. To ensure an accurate comparison of changes in the outer wall volume across time, the same type of sequence was used for each patient. When both sequences were available, 3D bFFE was used. After segmentation, the resulting images were imported into RapidForm 2006 (INUS Technology, Seoul, South Korea), a commercially available 3D data processing software package, for isosurface extraction.
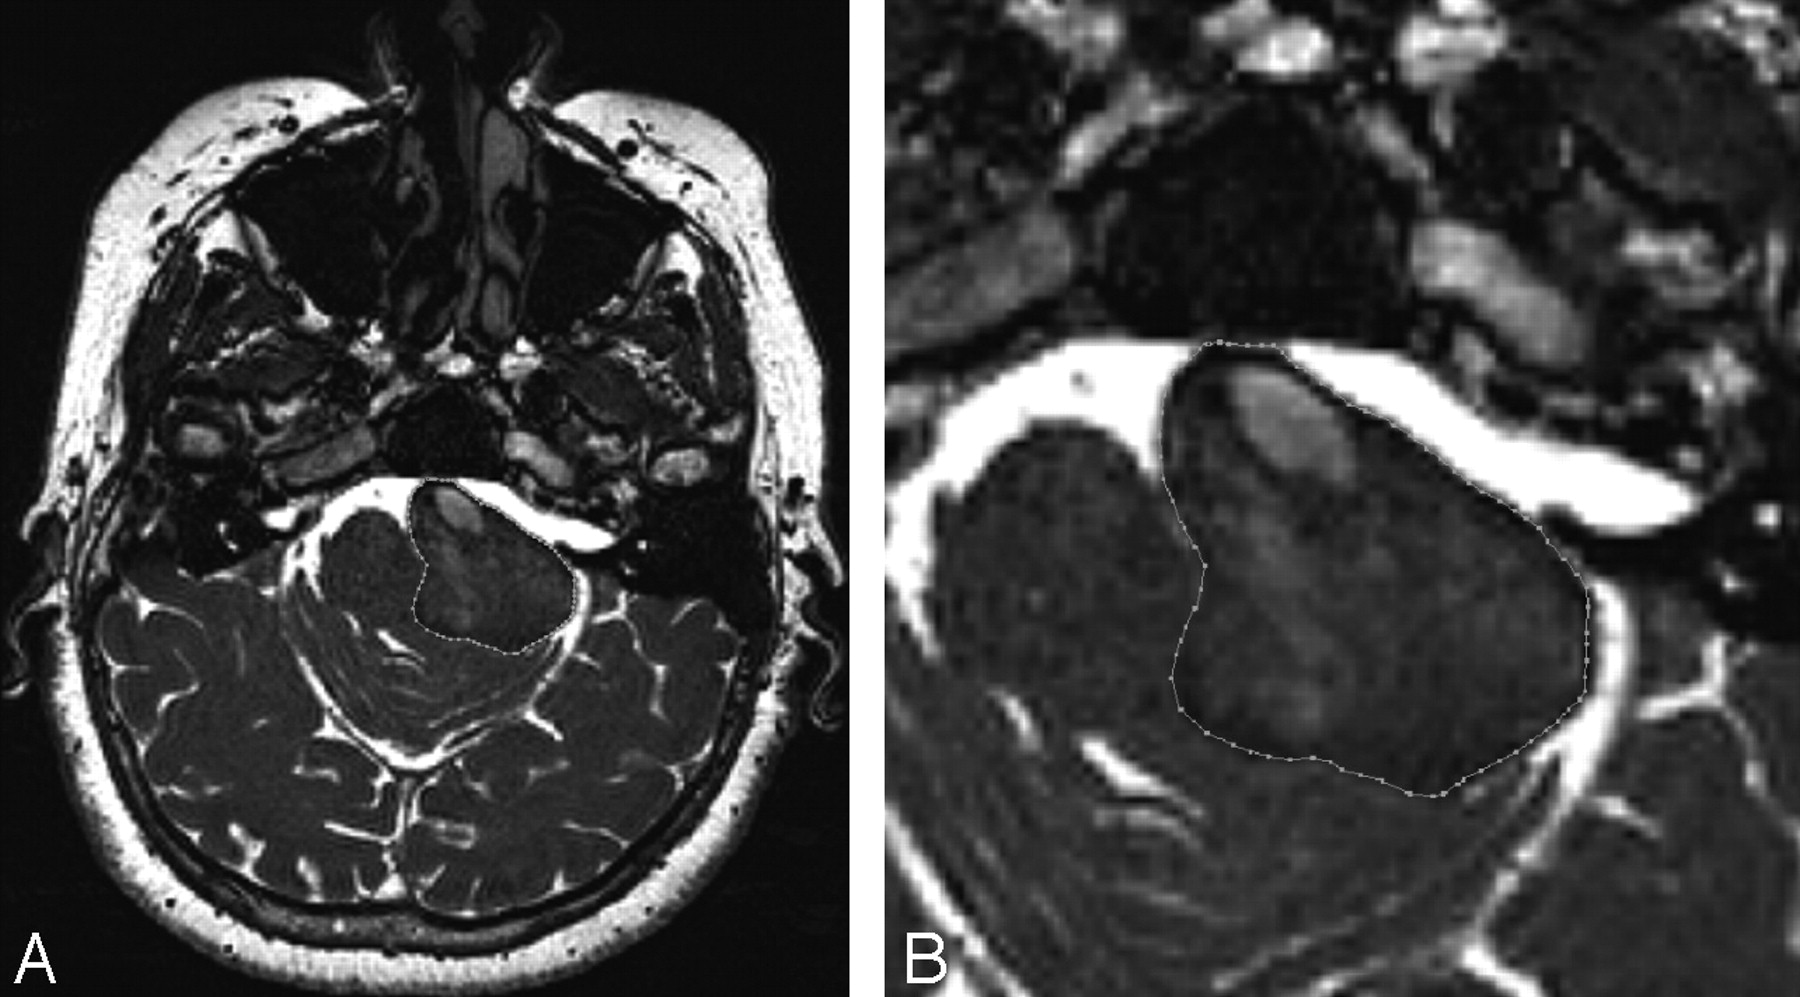
Steady-state bFFE axial image obtained from the same patient and same plane as on the right of Fig 1. Left, Full FOV image. Right, Magnified image of the aneurysm showing the manual contour used to delineate the outer wall.
The analysis of the inner wall pursued here was similar to that reported previously.4 In brief, CE-MRA images were directly imported into RapidForm, which allows creation of isosurfaces directly from a DICOM dataset after the user chooses an intensity threshold. To ensure consistent volume quantitation, subsequent thresholding is constrained to produce identical measurements on reference healthy vessel segments that are considered to remain unchanged over time. In particular, once the first dataset is processed, the threshold of subsequent studies is determined by requiring that the diameter of an undiseased part of a vertebral artery remains constant over all of the subsequent studies of the same patient.
All of the surface models (both of the inner wall or lumen and of the outer wall) were then smoothed by using a Laplacian smoothing technique, which conserves the global volume of each mesh. The analysis performed in this study compared changes in the volume of the lumen and the outer wall over time. To ensure that volume measurements were made of the same vessel segments at all of the time points, the regions of interest were manually coregistered by using internal fiducial landmarks, such as the vertebrobasilar junction and the bifurcation of the basilar artery. A volume cut tool was then used to define the proximal and distal levels of the volumes of interest, ensuring an analysis that was sensitive to changes resulting from the disease process by confining the analysis to the involved segments.
Statistical Analysis
Evolution over time of the inner and outer walls of the aneurysms was reported for each patient. 2D image quality was assessed by using a 5-point scale (0, could not be evaluated; 1, incomplete delineation of <75% of the contour; 2, incomplete but delineation of >75% of the contour; 3, complete delineation but difficult to perform; and 4, complete delineation and easy to perform).
Image quality of MRA was assessed using a 4-point scale (0, could not be evaluated because of failed bolus or severe motion artifacts; 1, interpretable but poor bolus or some motion artifacts; 2, good bolus but some background noise; and 3, excellent bolus and excellent contrast to background).
Pearson correlation coefficient was calculated for the volumes measured with T1-weighted TSE and the 3D bFFE sequence. Interobserver reproducibility was reported for manual outer wall volume delineation.
Results
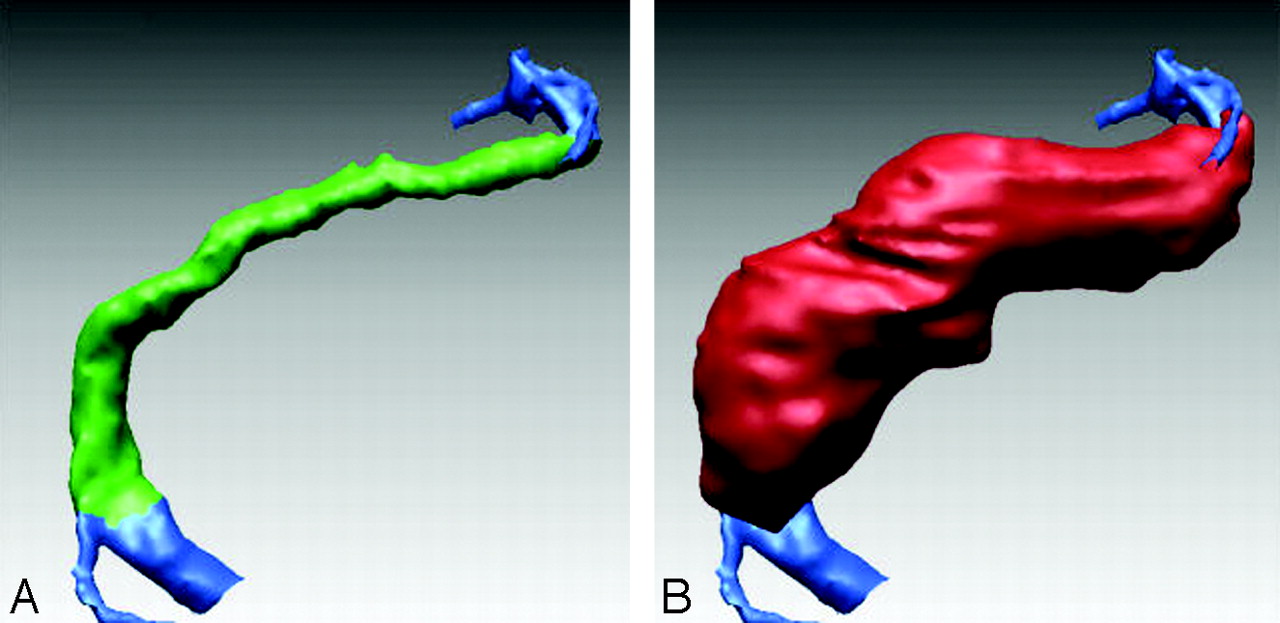
Nine patients and 21 time points were studied. Each patient underwent at least 2 studies, whereas 3 patients had 3 studies. The mean delay between MR imaging examinations was 7.1 ± 4.6 months (range, 1–15 months). For each study, registration was performed between the outer and inner walls (Fig 3) and for each patient between the different time points (Fig 4).

Lumenal and outer wall surfaces for another patient with aneurysmal basilar disease. Left, Surface shaded depiction of the lumen obtained from CE-MRA (blue for the extra-aneurysmal part of lumen and green for intra-aneurysmal part). Right, Surface shaded depiction of the outer wall obtained from bFFE images (red).

Patient with a fusiform aneurysm of the distal basilar artery. Left, Registration of the lumen of the baseline study (blue) and the most recent study (red). Consistency of threshold across studies is ensured by requiring volume preservation in a reference segment of the carotid artery (black arrow). A detail of this registration by using a mesh display is shown on the right side showing the asymmetrical increase of the lumen volume of the aneurysm.
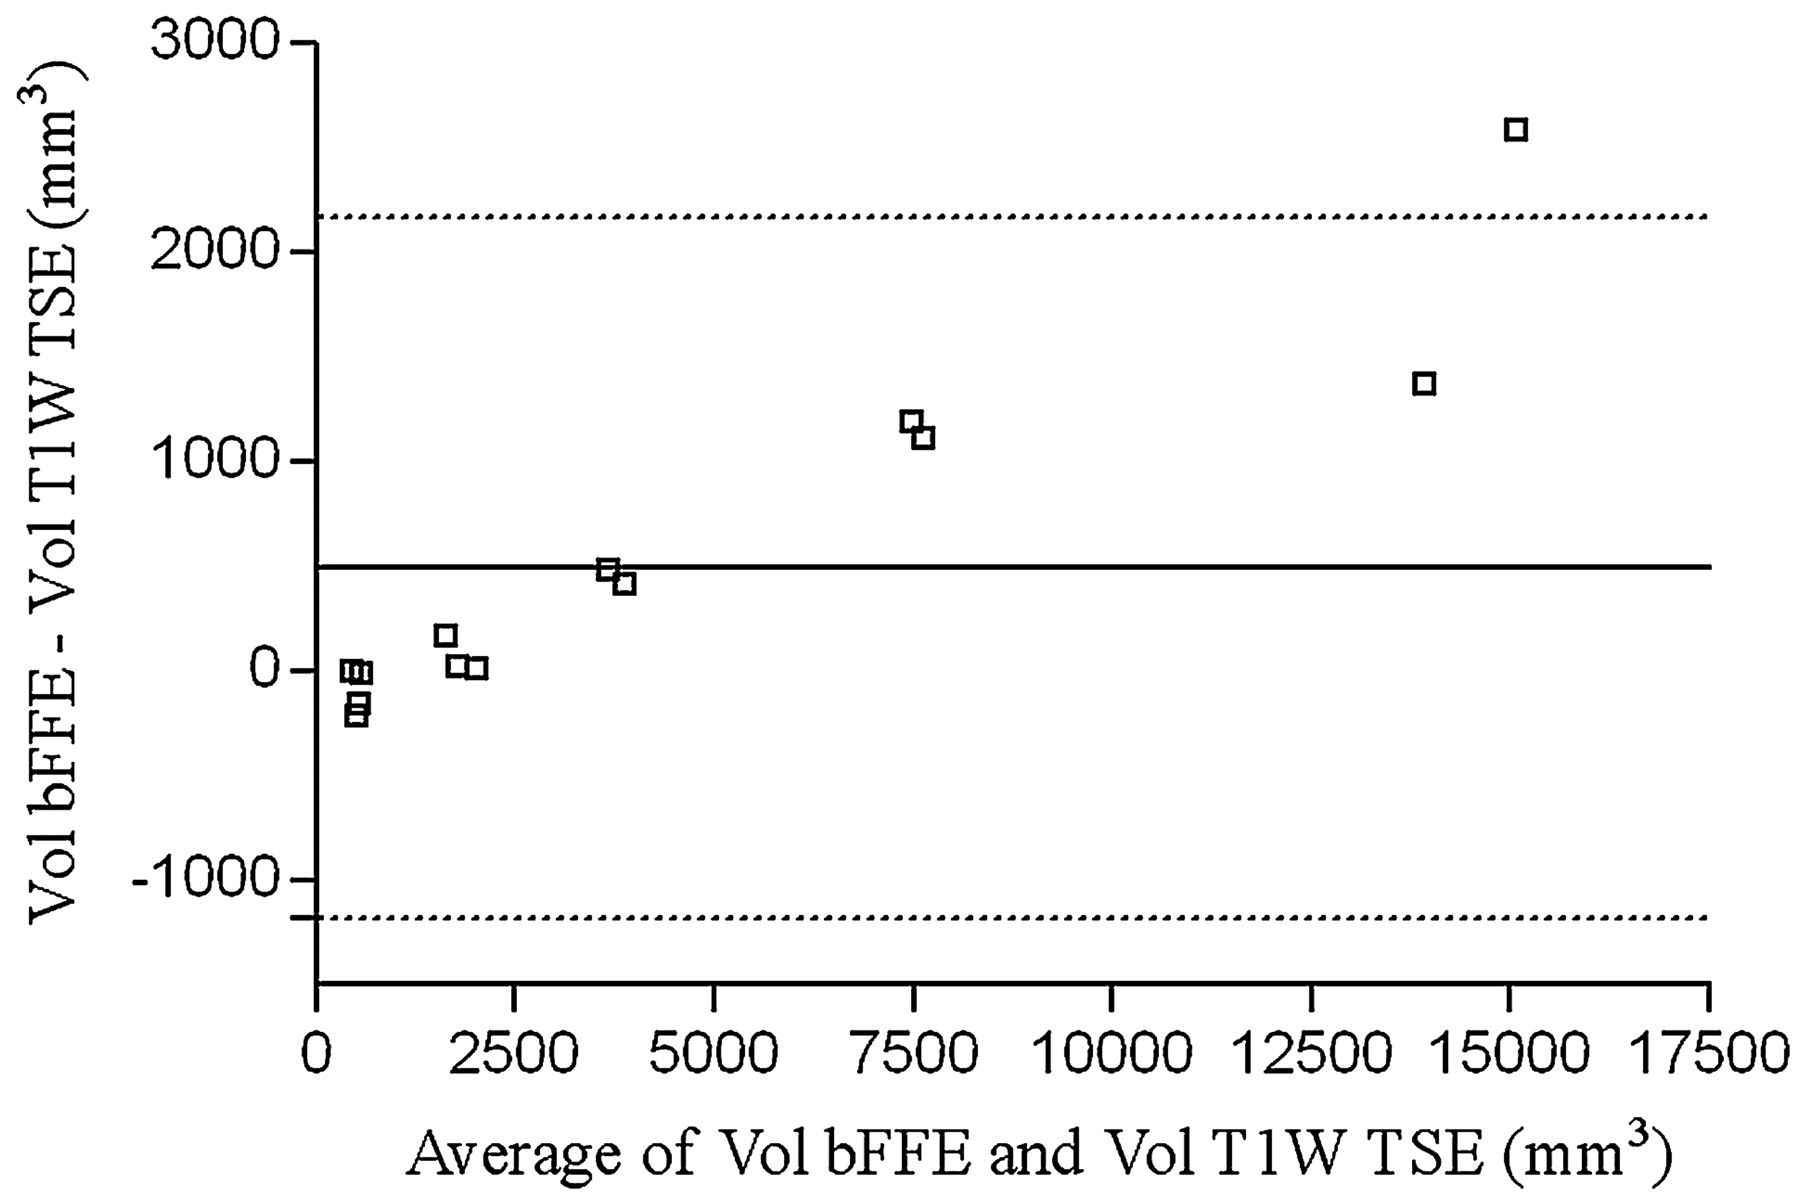
Mean volume of the aneurysms was 6760 ± 6620 mm3 (range, 410–19,520 mm3) for the outer wall and 2060 ± 1200 mm3 (range, 390–5070 mm3) for the lumen. Mean lumen-to-outer-wall volume ratio was 62% ± 38% (range, 11%–100%). A plot of the difference between the outer and the inner wall volume is shown in Fig 5.

The difference between outer wall and inner wall volumes is plotted as a function of outer wall volume. The volume of the aneurysm region that is not circulating increases with increasing aneurysm size.
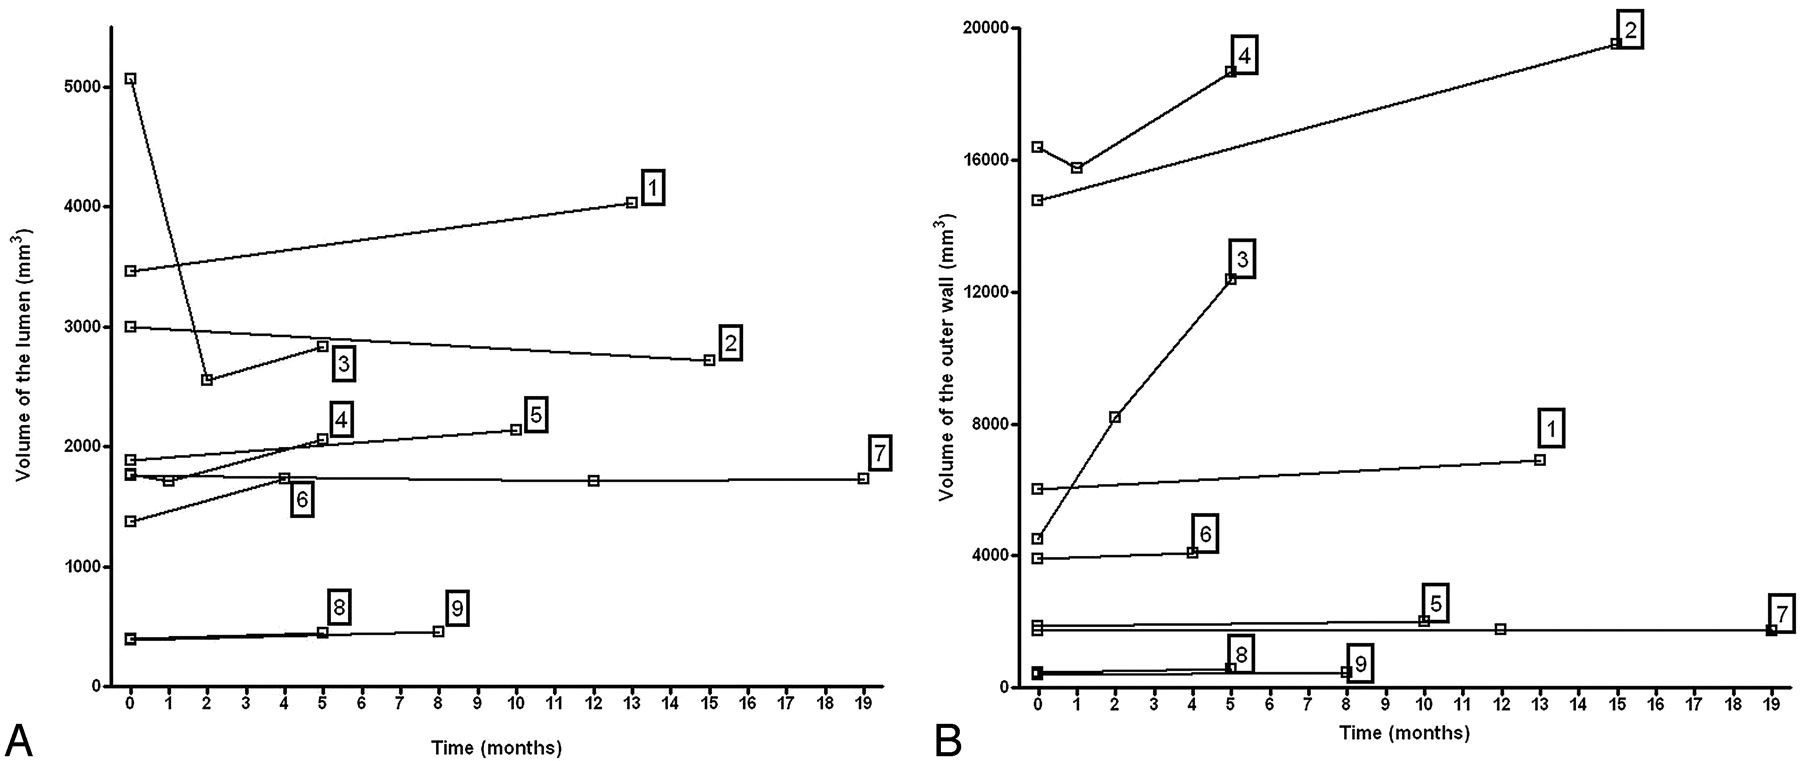
Analysis of the evolution of the volumes of both the inner and outer aneurysm walls showed that the rate of increase was highly variable between different aneurysms (Fig 6) and that there were substantial changes in the outer-wall-to-lumen ratio over time (Fig 7).

Changes of the inner and outer walls of aneurysms over time. Left, Plot of change in lumen shows that the lumenal wall of the aneurysm can either increase or decrease. The substantial decrease in lumen size for patient 3 is related to a partial thrombosis of the lumen between the 2 first time points. Right, Plot of changes in outer wall over time shows that changes are highly variable between individuals. Outer wall volumes either remain essentially unchanged (±5%) or increase over time.

Plot of the ratio of lumen-to-outer-wall volume over time. Relative evolution of the 2 components (lumen and thrombus) of the aneurysms is variable from 1 patient to another.
Regarding outer wall imaging, of the total 21 time points recorded, 17 patients underwent a 3D bFFE sequence, 17 underwent a T1-weighted TSE sequence, and 13 underwent both. For those 13 time points, a Bland-Altman representation is provided (Fig 8). The Pearson correlation coefficient between the 2D T1-weighted TSE and the 3D bFFE sequence for the volume of the outer wall of the aneurysm was 0.99 (P < .0001). Mean image quality on a 5-point scale (0–4) was 3.2 ± 0.27 for the 2D TSE and 3.7 ± 0.22 for the 3D bFFE sequence (P < .001). Interobserver reproducibility for outer wall delineation was 90.2% on 3D bFFE images and 91.8% on 2D TSE T1-weighted images. Finally, mean image quality for MRA was 2.71 ± 0.45 on a 4-point scale (0–3).
Bland-Altman plot representation of outer wall volume measured from bFFE and T1-weighted TSE sequence. Solid line shows the mean difference and dotted lines the 95% confidence interval of the mean.
Discussion
The combination of high-resolution intravenous gadolinium CE-MRA and balanced gradient-echo or T1-weighted turbo spin-echo imaging allows a full description of the structure of basilar aneurysms by providing accurate information on both the lumen, as well as the outer wall, of the vessels.
In this study, the basilar aneurysms of 9 patients were monitored over time, and the rate of change in lumen and outer wall volumes was found to vary substantially between patients. In all of the subjects, the outer wall of the aneurysm remained either essentially constant or grew over time. Luminal volume, on the other hand, was constant in some subjects, but in other subjects, either increases or decreases in luminal volume were noted. Those changes in the luminal part of the aneurysm that were not accompanied by similar changes of the outer wall indicate modifications in the noncirculating part of the aneurysm that must be represented mainly by thrombus. Furthermore, there was a high interpatient variation in the amount of intraluminal thrombus that was present, with a lumen-to-outer-wall ratio that ranged from 11% to 100%, with a mean value of 62%. The plot of the outer wall minus the lumen versus the outer wall shows a clear trend for larger aneurysms to contain a larger volume of mural thrombus.
These findings underscore the importance of monitoring both the luminal wall and the outer wall to fully evaluate aneurysm evolution, a capability that is lacking in conventional angiographic methods that are only able to assess the luminal surface. In several subjects, the lumen represents a small part of the disease when compared with the thrombosed part. Furthermore, study of the extraluminal thrombus and outer wall is important for several reasons. First, a basilar aneurysm can become symptomatic because of the mass effect that results in compression of neighboring structures.5, 6 Second, thrombus size is subject to sudden changes that can lead to total7 or partial8 aneurysm occlusion. For example, the patient who underwent vertebral occlusion (patient 3, Figs 6 and 7) demonstrated this type of evolution, going from a fully patent lumen to a lumen that was 70% thrombosed in 4 months. The role of those changes in distal embolism is unclear, but, because stroke is an important complication of this kind of aneurysm,1, 9 it is important to monitor the intraluminal thrombus. For these reasons, adding evaluation of the aneurysm outer wall to conventional noninvasive imaging angiography protocols is of value.10–12 Nagahata et al11 reported interest in such a combination for vertebrobasilar artery condition evaluation. In that study, they combined a 3D time-of-flight MRA sequence, which assesses the lumen, with a single thick section using a 2D T2-weighted spin-echo sequence to evaluate a projection of the outer wall. This method for assessing the outer wall fails to evaluate the volume of the wall, and like projection methods in conventional angiography, is subject to variation in the view angle.
In our study, we used intravenous gadolinium CE-MRA because it is relatively noninvasive and well-suited to serial imaging studies and because of its demonstrated accuracy for assessing the vertebrobasilar circulation.4, 13 We initially used T1-weighted imaging for assessment of the outer wall because of the success that has been achieved using that sequence in delineating the outer wall of blood vessels, in particular in application to atherosclerotic disease of the extracranial carotid arteries.14 Steady-state imaging was used once it became available, because it provides an explicit 3D representation, with the advantages of superior signal-to-noise ratio (SNR) and the ability to perform multiplanar reformatting because of the near isotropic resolution of the source data. When T1-weighted TSE and bFFE sequences were both performed, the volumes resulting from the manual delineation on the 2 studies were significantly correlated. However, the Bland-Altman representation showed a trend for T1-weighted TSE to underestimate the outer wall volume. Furthermore, image quality, in terms of ease of delineation, was better with bFFE than with T1-weighted TSE. Those 2 observations may arise (in application to imaging of the basilar artery) from the presence of surrounding CSF where the T2/T1 weighting of the bFFE sequence can be exploited to good advantage providing high contrast between the bright CSF and the hypointense vessel wall.
Quantitative analysis of 3D volumes required several steps. The first step of this process is data segmentation. The outer wall was manually delineated and then imported into the 3D software package. Segmentation of the lumen from the MRA data was performed using an isosurface extraction based on a thresholding method. This step is important, because a poor choice of isovalue could lead to substantial errors in the final volume measurement. Selection of this threshold level was done by visual inspection of the resultant luminal surface in reference to the gray-scale original MRA dataset. For longitudinal studies, we assessed the consistency of the chosen isovalue for the same patient at different time points by studying a reference segment (eg, a segment of the internal carotid artery) and requiring that the volume of the reference segment remain identical from study to study. Because the primary measure of interest in this study is volume change, this algorithm reduces the importance of having a precise value for the threshold setting at baseline. We also note that the resulting luminal volumes are consistent with measures of the outer wall obtained by using data from 2 MR acquisition methods that have very different acquisition structures. In particular, in the absence of thrombus (patients 5, 7, 8, and 9), the luminal volume is similar to that of the outer wall.
The second step of the process is the registration of volumes. For each study, we manually coregistered the lumen wall and the outer wall of the aneurysm. This was then repeated for each patient, for all of the time points. After coregistration, the datasets for each patient were cut at the same anatomic locations to define a region of comparison for volume evolution over time. This approach has an important advantage over methods that use only internal fiducials, such as the vertebral junction and the end of the basilar trunk. That technique may add undiseased vessel segments to the analysis and reduce the sensitivity of serial assessment for analysis of aneurysm progression.
The use of 3D imaging modalities rather than 2D projection methods, as is provided by conventional angiography, has several advantages in the study of aneurysms. Differences in patient position between different studies can be circumvented with 3D datasets by bringing the datasets into coregistry in the same viewing projection, which is not possible with 2D images.15 Reformation also permits all of the patient time points to be presented in a single coregistered display wherein regions of growth can be more easily detected by visual inspection. Furthermore, 3D measurements are often more accurate in the detection of structure growth, particularly if there are asymmetric patterns of growth. This aspect has been well established in in vitro studies of pulmonary nodules16 or aneurysms.17 The determination of 3D models of the luminal surface can also be used as boundary conditions for computational fluid dynamic calculation.18 Recent promising developments in this field may result in additional information about the prognosis of aneurysmal disease in terms of growth and rupture19–21 and changes in surgical treatment planning.22
One limitation to the study is the lack of a standard of comparison for outer or inner wall measurements. Although the accuracy of MRA has already been demonstrated in intracranial vessels,13 there is no real standard of truth for outer wall delineation. The fact that the volume of the outer wall is similar to that of the inner wall in those patients who had no thrombus gives us confidence that MR imaging provides reasonable estimates of this quantity. Furthermore, the good image quality with sharp contours (particularly with the bFFE technique) provides support to the validity of the outer wall measurement results. Nevertheless, even if the interobserver agreement in terms of final volume is good (>90%), the sensitivity in terms of change in outer volume measurement is limited to 10%.
Finally, the software, RapidForm, used in this analysis is commercially available, and the process described here can be reproduced in clinical practice. There is rapid development in the industrial tools that are available for 3D volume management in terms of volume segmentation, shape registration, and visualization. For example, in Fig 4, a solid view may be more convenient for shape registration, but a “mesh-like” view is more accurate for studying local region growing. These tools are often lacking in medical software packages, whereas they are widely spread in industrial software applications.
Conclusions
Intracranial fusiform aneurysms are conveniently studied using a combination of volumetric CE-MRA and MR imaging methods, which provide coregistered datasets that delineate the inner and outer vessel walls. Unlike conventional angiographic methods, which use linear estimates of geometry, consistent volumetric measurements are possible by using CE-MRA to define the flow lumen and steady-state methods to define the outer wall. T1-weighted methods provide high-resolution delineation of the outer wall, but steady-state methods have preferable properties for measurement of the thrombus volume in basilar arteries. The advantages of steady-state methods derive from the fact that they are intrinsically 3D, have a high SNR, and present with high contrast between the vessel wall and the adjacent CSF. MR imaging and CE-MRA methods provide powerful tools for monitoring the progression of aneurysmal disease.
Footnotes
L.B. was supported by the Société Française de Radiologie (Paris, France). This work has been supported in part by grants from the Aneurysm and AVM Foundation, Public Health Service grants NS047921 and HL067912, and a Veterans' Affairs merit review award.
References
- Received April 4, 2007.
- Accepted after revision July 12, 2007.
- Copyright © American Society of Neuroradiology


