
Abstract
BACKGROUND AND PURPOSE: Evidence is mounting that spinal cord atrophy significantly correlates with disability in patients with multiple sclerosis (MS). The purpose of this work was to validate 3 different measures for the measurement of cervical cord atrophy on high-resolution MR imaging in patients with MS and in normal control subjects (NCs). We also wanted to evaluate the relationship between cervical cord atrophy and clinical disability in the presence of other conventional and nonconventional brain MR imaging metrics by using a unique additive variance regression model.
MATERIALS AND METHODS: We studied 66 MS patients (age, 41.2 ± 12.4 years; disease duration, 11.8 ± 10.7 years; Expanded Disability Status Scale, 3.1 ± 2.1) and 19 NCs (age, 30.4 ± 12.0 years). Disease course was relapsing-remitting (34), secondary-progressive (14), primary-progressive (7), and clinically isolated syndrome (11). The cervical cord absolute volume (CCAV) in cubic millimeters and 2 normalized cervical cord measures were calculated as follows: cervical cord fraction (CCF) = CCAV/thecal sac absolute volume, and cervical cord to intracranial volume (ICV) fraction (CCAV/ICV). Cervical and brain lesion volume measures, brain parenchyma fraction (BPF), and mean diffusivity were also calculated.
RESULTS: CCAV (P < .0001) and CCF (P = .007) showed the largest differences between NCs and MS patients and between different disease subtypes. In regression analysis predicting disability, CCAV was retained first (R2 = 0.498; P < .0001) followed by BPF (R2 = 0.08; P = .08). Only 8% of the variance in disability was explained by brain MR imaging measures when coadjusted for the amount of cervical cord atrophy.
CONCLUSIONS: 3D CCAV measurement showed the largest differences between NCs and MS patients and between different disease subtypes. Cervical cord atrophy measurement provides valuable additional information related to disability that is not obtainable from brain MR imaging metrics.
MR imaging of the brain is a sensitive tool for making a diagnosis of multiple sclerosis (MS). Abnormalities of brain MR imaging are present in more than 95% of patients with clinically definite MS; however, there is poor correlation between disability and the number and volume of focal brain lesions visible on MR imaging.1
Involvement of the spinal cord, especially of the cervical cord,2,3 is of particular significance in the development of physical disability in patients with MS.4,5 During the course of their disease, approximately 80% of patients with MS present with spinal cord symptoms.6 Conventional T2-weighted spinal cord imaging is sensitive in detecting spinal cord lesions and their changes over time.7,8 However, measures of cord T2 lesion number and volume failed to show a significant relationship with disability and have poor prognostic value for disability accumulation over the mid-to-long term.2,3 Evidence is mounting that spinal cord atrophy significantly correlates with disability.5,9–11
Atrophy of the spinal cord in MS is thought to reflect inflammatory tissue injury, demyelination, and axonal loss. Postmortem pathologic studies have documented spinal cord axonal loss in MS.12,13 However, whereas the correlation between central nervous system atrophy and disability has been interpreted as a reflection of axonal loss in pre-existing lesions,14–16 axonal loss does not appear to directly affect the cross-sectional cord area in pathologic studies.2 Measurement of spinal cord atrophy has demonstrated value in the clinical realm. Serial MR imaging of the spinal cord has shown evidence of disease activity undetectable on clinical examination, thereby increasing the diagnostic sensitivity of MR imaging for patients with suspected MS.17 Spinal cord abnormalities on MR imaging are not restricted only to patients presenting with spinal cord symptoms, because changes suggestive of atrophy may be seen before any manifestation of clinical symptoms. It has been shown that atrophy of the cervical spinal cord is a useful measure for determining clinical disability10,15,18 and monitoring disease progression,19 as well as therapeutic drug effects in MS.20
Key problems in the evaluation of spinal cord atrophy have been related to poor resolution of MR imaging, small size of the cord, and surrounding fat, bone, and CSF that can cause artifacts and, as a consequence, compromise the final image quality. Indeed, artifacts related to pulsation and respiratory cardiac motion have also been considered.2,3 This led in most of the earlier studies to unacceptable error in manual delineation of the cord/CSF interface.2 The technical challenges of spinal cord imaging posed by the size and anatomy of the cord and by its surrounding structures have been addressed in recent years by improved receiver coils, fast imaging, 3D imaging, motion suppression, and cardiac gating. Subsequently, interest has emerged in a reproducible semiautomated measurement of the cord cross-sectional area21 and its improved measurement by reduction of partial volume effect,22 as well as by 3D extraction of the cord surface area.23
The goal of the present study was to investigate whether spinal cord atrophy in MS may be assessed by measurement of the whole cervical cord volume rather than by the traditional cross-sectional area approach at level C2/C3. To improve the accuracy and precision of cervical cord volume measurements, a semiautomated edge detection technique was used to create a tissue-boundary map from 3D volumetric scans of the cervical cord. Therefore, the objectives of the present cross-sectional study were first to validate this original method for measuring whole cervical cord volume by comparing 19 normal control subjects (NCs) and 65 patients with MS with different disease subtypes. We also evaluated the relationship between absolute and normalized cervical cord atrophy and clinical disability in the presence of other conventional and nonconventional brain MR imaging metrics using a unique additive variance regression model.
Methods
Subjects
MS patients were consecutively enrolled either at the time of their first visit or during routine clinical follow-up visit. Patients with clinically isolated syndrome (CIS) were enrolled at the time of their first visit. In patients with MS, the inclusion criteria were as follows: diagnosis of MS,24 age 18–70 years, and Expanded Disability Status Scale (EDSS) between 0 and 8.5.25 Exclusion criteria consisted of relapse, disease progression, and steroid treatment in the 3 months preceding study entry or pre-existing medical conditions known to be associated with brain or spinal cord pathology. NCs were recruited from among hospital personnel and community-based volunteers. NCs were matched to MS patients for sex but not for age.
The CIS group in our study was composed of patients5 with recent onset of clinical symptoms (30 days from the onset of disease) and those patients with CIS6 who were referred to our institute for a second opinion in which a second clinical attack was not observed during the midterm follow-up. All of the patients with CIS presented abnormal MR imaging consistent with demyelinating disease. Six of 11 CIS patients had 1 or more T2 hyperintense lesions present in the cervical cord (range 1–3). The study was approved by the appropriate internal review committee.
MR Imaging Acquisition
MR imaging scans were performed on a 1.5T Signa 4x/Lx, (GE Healthcare, Milwaukee, Wis) unit, with both the brain and cervical cord being scanned in the same session. Cervical cord MR imaging protocol included axial 3D-spoiled gradient-recalled (SPGR) T1-weighted images (T1WIs; TR, 33 ms; TE, 6 ms; FA, 30°; 2.5-mm thick; 0 gap; matrix, 512 × 512) and axial and sagittal fast spin-echo (FSE) T2-weighted images (T2WIs) (TR, 3200 ms; TE, 95 ms; echo-train length [ETL], 20; 3-mm thick; 0 gap; matrix, 256 × 256). Brain MR imaging protocol included dual SE T2WIs, diffusion-weighted imaging (DWI), 3D-SPGR T1WI, spin-echo (SE) T1WI without contrast, and fluid-attenuated inversion recovery (FLAIR) sequences. The axial dual SE sequence was acquired with TE at 30 ms/90 ms, TR at 3000 ms, NEX at 1, ETL at 14, FOV at 24 × 18, matrix at 192 × 256, 5-mm section thickness with a total of 28 sections, and no gap; axial 3D-SPGR T1WI scans with FOV of 24 × 18, matrix at 192 × 256, 2.5-mm thickness, 70 sections, no gap, TE at 7 ms, TR at 24 ms, NEX at 1, FA at 30°; axial FLAIR with FOV 24 × 24, matrix at 192 × 256, 28 sections, 5-mm thickness, and no gap; and axial SE T1WI with FOV at 24 × 18, matrix at 192 × 256, 28 sections, 5-mm thickness, no gap, TE at 9 ms, TR at 600 ms, and NEX at 2. Echo-planar imaging was used to acquire T2WI (B0) and DWI (B1000) with the following parameters: FOV at 36 × 27, matrix at 128 × 128 (resulting in in-plane voxel sizes of 2.8 × 2.1 mm), 46 sections (3-mm thickness), and no gap. Diffusion weighting was applied via the use of identical diffusion-encoding waveforms in 3 orthogonal directions (read, phase encoding, and section selection) and averaging these in the scanner, which resulted in an average DWI image with a b factor of 1000 s/mm2.
MR Imaging Analysis
Cervical Cord Measures.
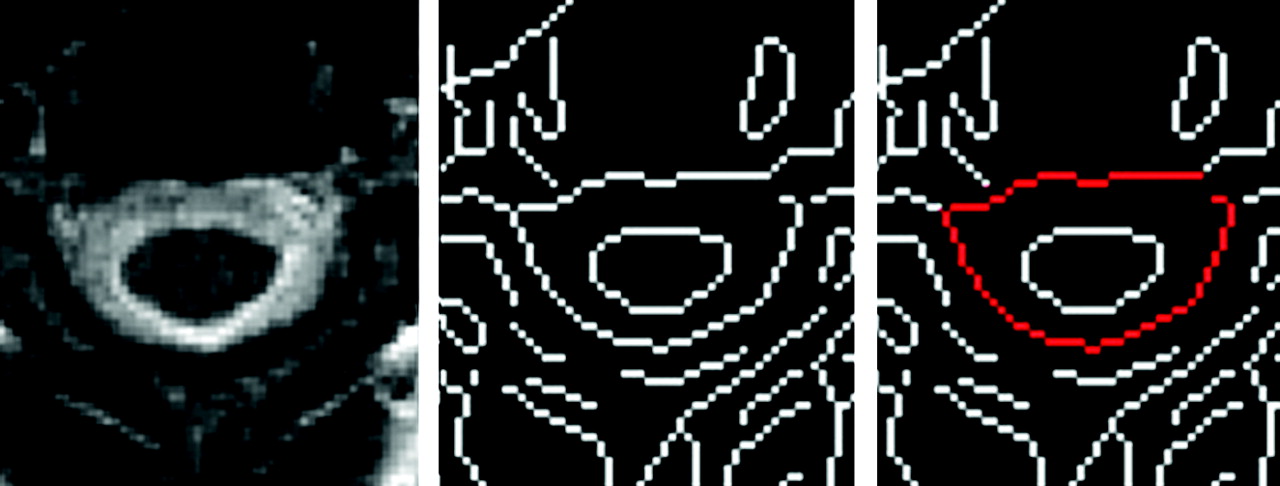
The image analysis was blinded to patients’ clinical characteristics and clinical status. We first used an edge-detection technique26 to create a tissue-boundary map from a 3D-SPGR T1WI from upper level of C2 to lower level of C7 (mean of 43 ± 3 sections were contoured). First, a 3D Gaussian smoothing kernel with an SD of 1.25 mm was used to minimize the creation of spurious edges from background noise. Next, a weighted 3D Sobel image filtering operator was used on the smoothed image to generate both a gradient magnitude map displaying the edge strength at every voxel and a gradient direction map displaying the edge orientation at every voxel. Finally, nonmaximal suppression based on the 2 gradient maps was used to automatically trace along edges and eliminate nonedge voxels. During this final stage, hysteresis was also used to eliminate streaking (the tendency of edges to drop out at points due to noise). The final result of this processing was an edge map containing single-voxel-width edges. Operator input was limited to identification of the set of edges on this map enclosing the cervical cord volume. Reliability was ensured by the presence of only single-voxel-wide edges, thus removing any operator uncertainty in edge placement. The number of voxels included within these edges was then added together, and the sum was multiplied by the individual voxel volume to generate a final, quantitative measure of cervical cord volume (Fig 1).

Cervical cord identification and quantification. Left, Original cervical 3D SPGR-T1WI. Center, Edge-detection image. Right, Cord edges identified by operator.
A similar approach was used to determine the cervical “thecal sac.” Instead of an SPGR image, an FSE T2WI was used. Edge detection was then performed as described above, and the operator identified those edges enclosing the spinal thecal sac (Fig 2). Cervical cord absolute volume (CCAV) in millimeters cubed (Fig 1) and 2 normalized cervical cord measures were calculated: cervical cord fraction (CCF) = CCAV/thecal sac absolute volume, and cervical cord to intracranial volume (ICV) fraction = CCAV/ICV.
Cervical canal identification and quantification. Left, Original cervical T2WI. Center, Edge-detection image. Right, Spinal canal edge identified by operator.
The reproducibility of spinal cord measures was calculated as coefficients of variation ([SD/mean]*100). For all of the reproducibility measurements, scans from 5 MS patients and 5 NCs were used. The patients were stable from both clinical and MR imaging points of view during this interval. The scan-rescan reproducibility was defined as the variability between the estimates of cervical cord atrophy measures determined on 2 separate MR imaging scans within 1 week and measured 5 times by a single blinded observer. Intrarater reproducibility was defined as the variability between mean estimates of spinal cord atrophy measures determined 5 times by a single observer who repeatedly evaluated the same scan obtained from the same subject. Interrater reproducibility was defined as the variability between mean estimates of spinal cord atrophy measures determined 5 times by 2 observers who repeatedly evaluated the same scan obtained from the same subject.
Cervical cord lesion volume (LV) was quantified by a single rater on FSE T2WI using the “smallest bounding box” method. T2 hyperintense lesions were manually identified and measured on axial and reconstructed sagittal images to determine their maximum extent in all directions. The sum of lesion-bounding box volumes was calculated to derive a total cervical T2-LV for each patient.
Brain Measures.
T2- and T1-LVs were calculated using a semiautomated local thresholding technique for lesion segmentation, as described previously.27,28 For estimation of whole-brain atrophy, we used a modified version of the Functional Magnetic Resonance Imaging of the Brain-Functional Software Library (University of Oxford, Oxford, United Kingdom) cross-sectional brain atrophy analysis tool called Hybrid Structural Image Evaluation, including Normalization, of Atrophy (X sectional). Details of this method have been reported elsewhere.29,30 Brain parenchyma fraction (BPF) was calculated as follows: BPF = (gray matter + white matter)/(gray matter + white matter + CSF).29,30
Details of the DWI method have been described elsewhere.29,30 Briefly, the whole-brain mean diffusivity (MD) was computed from the T2 and DWI, which were combined to create a mean diffusivity D̄ map by performing the following calculation on each voxel: D̄ = (−b/3)ln(DW/T2). In this equation, DW represents the average diffusion signal intensity and T2 represents the T2-weighted signal intensity without the diffusion weighting. The parenchyma mask was then applied to the previously created (D̄) map to create a parenchyma (D̄) map, displaying mean parenchyma diffusivity (MPD) values. Therefore, whole-brain MPD represents a composite measure of all tissue types in the brain, including normal-appearing white and gray matter and lesions (except in NC).29,30
Statistical Analysis
Statistical analysis was performed using the Statistical Package for the Social Sciences (SPSS, Version 14.0; SPSS, Chicago, Ill). For demographic and clinical comparisons between groups, parametric and nonparametric tests were used, as appropriate. All of the MR imaging distributions were normal by the Komologrov-Smirnov test of normality (P > .05). There was a significant age-dependent difference between NCs and MS patients (P = .001) and between NCs and all of the disease types, except for the CIS patient group. A general linear model (GLM) analysis was performed to test significant differences between NCs and MS patients and specific MS disease subtypes in which the age was entered as a covariate and, due to the multiple comparisons, a post hoc Bonferroni correction was applied directly in the SPSS analysis model. The Student t test was applied to quantify the possible influence of the duration of treatment with disease modifying therapy (DMT) between different MS subtypes. A statistically significant difference was found. Therefore, GLM analysis with age and duration of treatment adjustments was performed for different disease subtype comparisons. The relationship between cervical cord MR imaging variables and brain MR imaging and clinical variables was examined using the Spearman rank and Pearson correlation coefficients, as appropriate. In particular, we explored the correlation between different cervical cord atrophy measures and brain MR imaging measures, as well as disability (as measured by EDSS) and disease duration. Multivariate regression analyses models, age adjusted, were used to evaluate the relationship between cervical cord MR imaging measures, with or without the presence of brain MR imaging metrics, and clinical outcomes. Different multiple regression analyses were performed to explore the relationship between cervical and brain MR imaging outcomes, as well as disability and disease duration. Age was included as a covariate in all of the models. Only MR imaging variables that were significant in correlation analyses were entered into these models. Three models were created. In each case, age was entered and retained in block 1, and the MR imaging variables were entered in block 2. We used P to enter = .05 and P to exit = .10. In the first model, age and brain MR imaging measures were entered in block 1 (BPF and T1-LV), and cervical cord measures were entered into block 2 (CCAV, CCF, and cervical T2-LV). In the second model, age and cervical MR imaging measures were entered in block 1 (CCAV, CCF, and cervical T2-LV), and brain MR imaging measures were entered into block 2 (BPF and T1-LV). The third disability model included age in block 1 and the CCAV and BPF in block 2. All of the P values were based on 2-tailed tests. The minimum significance level for entry and for staying in the equation was .05.
Results
Sixty-six MS patients (age, 41.2 ± 12.4 years; disease duration, 11.8 ± 10.7 years; EDSS, 3.1 ± 2.1) and 19 NCs (age, 30.4 ± 12 years; Table 1) were enrolled. Patients with relapsing-remitting (RR; n = 34), secondary-progressive (SP; n = 14), primary-progressive (PP; n = 7), and CIS (n = 11) were included31 (Table 1). The CIS group was composed of patients presenting with partial transverse myelitis (n = 4), optic neuritis (n = 3), brain stem syndrome (n = 2), and polysymptomatic onset (n = 2). All of the MS patients and 6 of 11 CIS patients were on various DMTs for a mean period of 58.2 months (range, 1–156 months).
Demographic and clinical characteristics of normal control subjects and multiple sclerosis patients, according to disease type
Comparison of MR Imaging Measures between Patients and Control Subjects
The reproducibility results for different cervical cord atrophy measures are presented in Table 2. In the GLM analysis, CCAV (P = .001) and CCF (P = .007) were significantly lower in the MS patients compared with NCs (Table 3). There was no significant difference for CCAV/ICV.
Coefficient of variation of different cervical spinal cord atrophy measures
Cervical cord atrophy and lesion MR imaging measures in normal control subjects and multiple sclerosis patients, according to disease type
When NCs were compared with specific MS subtypes, CCAV (P < .001) and CCF (P = .043) were significantly lower in the SP MS patients (Table 3). PP MS patients showed significantly lower CCF (P = .01) and lower CCAV (P = .048), whereas RR MS patients showed a trend for lower CCAV compared with NCs (P = .057). There was no significant difference between NC and CIS patients for either one of the cervical cord measures.
The reproducibility results for different brain MR imaging measures are presented in Table 2. The MS patients showed significantly lower BPF (P < .0001) and higher MPD (P = .001) compared with NCs in the GLM analysis (Table 4). Compared with NCs, lower BPF was found in all of the MS disease subtypes (P < .0001 for SP, PP, and RR and P = .004 for CIS; Table 4). MPD was also higher in all of the disease subtypes compared with NCs (P = .001 to .006), except for the patients with CIS (P value not significant; Table 4).
Brain MR imaging measures in normal control subjects and multiple sclerosis patients, according to disease type
Comparison of MR Imaging Measures between Different Disease Subtypes
In the GLM analysis, there were no significant differences between SP and PP MS patients for either of the cervical cord atrophy measures. However, the SP MS patients showed higher cervical T2-LV compared with those with PP MS (9.7 mL versus 2.6 mL; P = .027; Table 3). SP MS patients also showed lower CCAV (P < .001) and CCF (P < .0008) and higher cervical T2-LV (P < .02) compared with RR MS and CIS patients. PP MS patients showed lower CCAV (P < .01) and CCF (P < .03) compared with RR MS and CIS patients. RR MS patients differed from CIS patients only in their cervical T2-LV (4.2 mL versus 0.7 mL; P = .11; Table 3).
In general, all of the brain MR imaging measures showed significant differences between different MS subtypes (Table 4). SP and PP MS patients had significantly lower BPF than RR MS and CIS patients. RR, SP, and PP MS patients had higher MPD than CIS patients. SP patients had significantly higher T2-LV compared with all of the other disease subtypes.
Correlation and Regression Analysis between Cervical MR Imaging Measures and Other Brain MR Imaging and Clinical Outcomes
The Spearman correlation analysis showed weak-to-modest correlation among 3 different cervical cord atrophy measures (data not shown). This may suggest that cervical cord atrophy measures were not interrelated and potentially measured different variances in the atrophy of the cervical cord. There was no correlation between cervical T2-LV and either cervical cord atrophy measure. CCAV and BPF showed a robust correlation with disability (Table 5 and Fig 3). Among other MR imaging measures, CCF, cervical T2-LV, and brain T1-LV and MPD showed a modest correlation with disability (Table 5). BPF and cervical and brain T2-LVs were the only variables related to disease duration (Table 5).
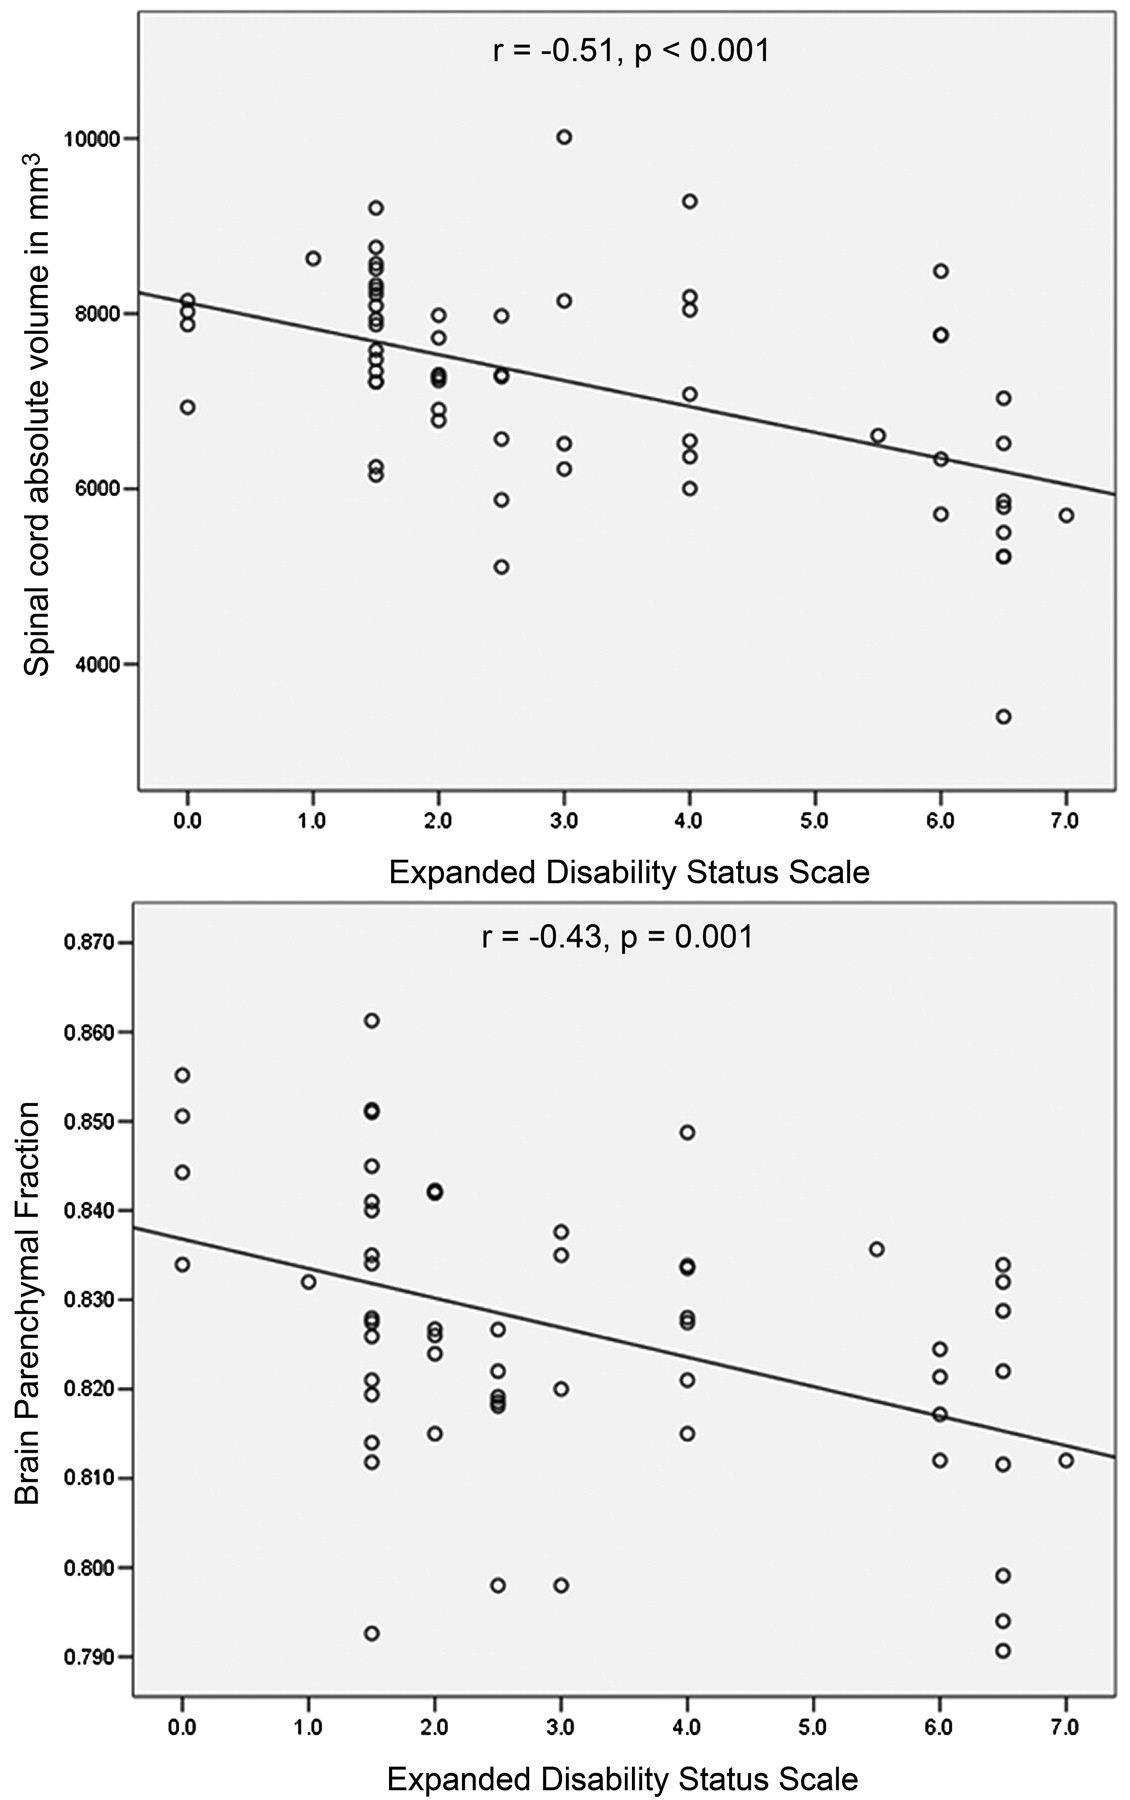
Correlation of cervical cord absolute volume and brain parenchyma fraction with disability, as measured by EDSS.
Correlation analysis between cervical and brain MR imaging measures and clinical variables
In the first multiple regression analysis model, CCAV was the only variable related to higher EDSS and by itself explained 47% of the variance in disability (R2 = 0.47; P < .001). Cervical T2-LV was the only variable retained in the same model for disease duration (R2 = 0.11; P = .04). The second model, both for disability and disease duration, retained BPF as the only variable (R2 = 0.22, P = .001 and R2 = 0.18, P = .001). In the third model, CCAV was retained first (R2 = 0.498; P < .0001), followed by BPF (R2 = 0.08; P = .08). CCAV and BPF together explained 58% of the unique additive variance in disability. This final disability model was separately run in SP and PP MS patients. CCAV was the only variable retained in the model (R2 = 0.652; P < .0001).
Discussion
This study validated 3 different cervical cord atrophy measures in patients with MS and in NCs. Absolute (CCAV) and normalized (CCF) measures of cervical cord atrophy showed the largest differences between NCs and MS patients and between different disease subtypes. Conversely, normalized atrophy measure of the CCAV to the total ICV did not perform in the same manner. Correlations between absolute and normalized cervical cord atrophy measures and cervical T2-LV showed significant correlation with disability. An important finding of this study is the relative proportion of the variance between spinal cord and brain MR imaging measures that explained a unique contribution to disability. Cervical and brain atrophy together explained 58% of the variance in disability, and only 8% of the variance in disability was explained by brain atrophy alone. In SP and PP MS patients, the only variable that independently predicted disability was CCAV.
Spinal Cord MR Imaging Measures in Patients and Control Subjects
Cervical cord atrophy was assessed by measuring the whole cervical cord volume rather than by using the traditional cross-sectional area approach at level C2/C3.21,32 To improve the accuracy and precision of cervical cord volume measurements, we acquired 3D volumetric T1 SPGR images and used a semiautomated edge detection technique to create a tissue boundary map.26 This technique eliminated most of the inherent operator-dependent difficulties in measuring spinal cord volume, thereby providing a highly reproducible measurement (Table 2). Because of the tubelike shape of the spinal cord, previous atrophy measures focused on estimating the average cross-sectional area along some length of cord.32 Although the cross-sectional area approach is very reproducible (<1%), the analysis is based on only 1–2 segments of the upper cervical cord (usually at the C2/C3 level) and does not provide a full estimate of the entire cervical cord damage.19,21,33,34
The original method developed by the Queen Square group21 was recently improved by the use of automated algorithms to detect the cervical cord edge and by application of additional filtering to improve reliability.2,32 Furthermore, newer 3D techniques based on the cord surface area are becoming increasingly available.
Our method is impervious to intensity change caused by pathology, which increases the reproducibility of edge contouring. Another unique approach in this study was determining the normalized measures of cord atrophy (CCF and CCAV/ICV). CCAV was the best cervical cord atrophy predictor for characterizing differences between NCs and MS patients and between different disease subtypes (Table 3), followed by the CCF. Analysis showed a weak correlation between CCAV and CCF, suggesting that these 2 measures might represent different variances in cervical cord atrophy measurement. CCAV/ICV failed to differentiate between NCs and MS patients and showed low sensitivity in distinguishing between different disease subtypes (Table 3).
Although the exclusion criteria for the study included pre-existing medical conditions known to be associated with spinal cord pathology, we cannot completely exclude the possibility that pathology related to normal aging influenced the performance of our normalized cervical cord measure (CCF). In fact, in the present study the NCs were significantly younger than the patients (Table 1), which could explain the limited value of the CCF and the lower correlation of this measure, compared with other MR imaging and clinical outcomes.
Contrary to other studies,2,32 normalization of CCAV to ICV did not yield a significant difference between MS and NC groups, and between different disease subtypes (Table 3). We do not have a plausible explanation for this finding, but suspect that the higher absolute volume of the cervical cord in our study, with respect to the cross-sectional area approach, might have influenced these differences. Alternatively, it could be that the entire cervical cord volume is simply not closely related to ICV in the general population. In fact, in the present study, the correlations between cervical cord measures and ICV were only weak and not significant (data not shown).
Cervical T2-LV was measured on FSE T2WI rather than on the short τ inversion recovery (STIR) FSE sequence. It has been shown that the STIR FSE sequence showed superiority for investigation of lesions in the spinal cord compared with FSE T2-weighted or conventional spin-echo T2-weighted sequences.7,8 Our original protocol did not contain the STIR FSE sequence, though during the study this sequence was added to the acquisition protocol. To ensure consistency between all of the participants, we used FSE T2WI for the calculation of T2-LV. Therefore, the cervical T2-LV could be somewhat underestimated in the present study. Because cervical T2 lesions were characteristically diffuse with difficult-to-identify edges, the smallest bounding box approach was used as a robust mean to overcome this problem. Cervical T2-LV was particularly high in SP MS patients, as expected. Cervical T2-LV did not correlate with other cervical cord atrophy measures.3 Of all of the cervical cord measures, cervical T2-LV showed the best relationship with disease duration.
Brain MR Imaging Measures in Patients and Control Subjects
As reported in previous case-control studies from our group using the same brain MR imaging measures, the MS patients showed significantly lower BPF30,35,36 and higher MPD30 compared with the NCs (Table 4). MS patients were of significantly higher age compared with NCs. This difference may have influenced the current findings, though all of the analyses were covariated for age differences. However, a number of recent MS case-control studies have shown that changes in brain tissue architecture, as measured by DWI and brain atrophy, represent a disease-dependent and not age-related phenomenon.37,38 The BPF and MPD differences between disease subtypes showed expected directions, as reported previously by our group (Table 4).30
Spinal Cord and Brain MR Imaging Measures in Correlation to Disability
CCAV showed the highest magnitude of correlation with disability among all of the cervical cord and brain MR imaging measures (Table 5 and Fig 3). In the regression model, CCAV by itself explained 47% of the variance in disability. BPF also showed modest correlation with EDSS (Table 5 and Fig 3) in the regression analysis, explaining by itself 22% of the variance in disability. Numerous cross-sectional studies have shown that measurement of the cord cross-sectional area is a useful measure for determining clinical disability.2,3,10,15,18,32 The results of the present study establish CCAV, measured on 3D-T1 SPGR images, as a robust correlate of disability in a heterogeneous group of MS patients. Previous studies have shown a consistent correlation between changes in the cord cross-sectional area and change in disability in the mid-to-long term.19,20 Longitudinal validation of our approach is currently under way. Other cervical (CCF and cervical T2-LV) and brain MR imaging measures (T1-LV and MPD) were related to disability in the present study but failed to sustain their presence in the regression analysis equation. Although numerous studies have used brain and spinal cord imaging to investigate the interrelation between the 2 body part modalities in predicting disability,9,11,39,40 a unique contribution of this study is the use of an additive variance regression approach for the modeling of brain and cervical cord MR imaging measures. When both CCAV and BPF measures were entered in the same model, CCAV predicted 50% and BPF only 8% of the variance in disability. Therefore, this study suggests that, in MS patients, spinal cord damage is more significant in the development of motor-related disability than overall brain damage.
Particularly striking were results in SP and PP MS patients. CCAV by itself explained 65% of the variance in disability, and BPF was not retained in the final regression model. This warrants the use of spinal cord imaging in phase II and III clinical trials, at least in patients with SP and PP MS. In fact, a positive effect of interferon-β treatments has been decisively established in patients with MS. For example, in the Prevention of Relapses and Disability by Interferon beta-1a Subcutaneously in Multiple Sclerosis (PRISMS) study, a positive effect of subcutaneous interferon-β1a was found both on brain MR imaging and clinical markers of disease activity.41 However, no effect on the spinal cord was found in a subgroup of patients from the PRISMS and Secondary Progressing Efficacy Clinical Trial of Recombinant Interferon-β-1a in MS studies.20 Another study using intramuscular interferon-β1a failed to find a positive effect on the cervical cord in PP MS.42 Neuroprotective agents, such as riluzole, appear to be more effective in reducing the rate of cervical cord atrophy in the short term.43
In summary, proposed 3D cervical cord atrophy measurement is highly related to the detection of clinical disability and provides valuable additional information not obtainable from brain MR imaging metrics.
Acknowledgments
We thank Eve Salczynski for technical assistance in the preparation of this article.
References
- Received July 18, 2007.
- Accepted after revision August 4, 2007.
- Copyright © American Society of Neuroradiology
In this issue


Jump to section
Related Articles
Cited By...
- Aged hind-limb clasping experimental autoimmune encephalomyelitis models aspects of the neurodegenerative process seen in multiple sclerosis
- Cervical Cord Atrophy and Long-Term Disease Progression in Patients with Primary-Progressive Multiple Sclerosis
- Cervical spinal cord atrophy: An early marker of progressive MS onset
- Multicenter Validation of Mean Upper Cervical Cord Area Measurements from Head 3D T1-Weighted MR Imaging in Patients with Multiple Sclerosis
- Differential patterns of spinal cord and brain atrophy in NMO and MS
- Cervical spinal cord volume loss is related to clinical disability progression in multiple sclerosis
- Spinal cord tract diffusion tensor imaging reveals disability substrate in demyelinating disease
- Voxel-wise mapping of cervical cord damage in multiple sclerosis patients with different clinical phenotypes
- A multicenter assessment of cervical cord atrophy among MS clinical phenotypes
- A 3T MR Imaging Investigation of the Topography of Whole Spinal Cord Atrophy in Multiple Sclerosis