
Abstract
BACKGROUND AND PURPOSE: Diffusion tensor imaging is a tool that can be used to study white matter microstructure in dyslexia. We tested the hypothesis that dyslexics have a white matter structural change (as measured by directional diffusion of water, which can be affected by disruption in white matter tracts) between brain regions that previous functional connectivity studies showed were associated with phonologic processing.
MATERIALS AND METHODS: Diffusion tensor imaging (DTI) scans were acquired from 7 healthy adult normal readers and from 14 adults with dyslexia on a 1.5T scanner. Voxelwise statistical analysis of the fractional anisotropy data were carried out by using Tract-Based Spatial Statistics to compare dyslexic subjects versus control subjects in white matter tracts.
RESULTS: Significant group difference map clusters (comparing adults with and without dyslexia) occurred in specific bilateral white matter tracts within the frontal lobe, temporal lobe, occipital lobe, and parietal lobe.
CONCLUSION: The DTI fractional anisotropy results in the bilateral white matter showing higher fractional anisotropy in adult control subjects compared with adults with dyslexia (relating to white matter fiber tract integrity) are consistent with our previous functional connectivity results from seed points in the bilateral inferior frontal gyrus.
Diffusion tensor imaging (DTI) is a technique that can be used to study white matter structures (anisotropy) in the human brain.1 Le Bihan et al2 have written a review about the applications of DTI to study abnormalities in a variety of diseases including stroke, multiple sclerosis, dyslexia, and schizophrenia. DTI has recently been used to study language-related neural pathways in normal and impaired readers.1–7 Klingberg et al5 reported that white matter diffusion anisotropy in the temporoparietal region of the left hemisphere was significantly correlated with reading scores within the reading-impaired group and within the control group in adults. Niogi and McCandliss7 used DTI to investigate the association between variation in white matter microstructure and individual differences in reading skill within children. Their results replicate previous findings of strong positive correlations between fractional anisotropy (FA) values in left centrum semiovale, left superior corona radiate, and bilateral anterior corona radiate and standardized reading scores of typically developing children.7 Deutsch et al3 investigated the white matter structure in the left temporoparietal region in children with a wide range of reading performance levels by using DTI. They report that the white matter structure measured using FA and coherence index correlated significantly with behavioral measurements of reading, spelling, and rapid naming performance.3
Molko et al6 used DTI to study a patient with alexia in his left visual field resulting from a posterior callosal lesion and demonstrated how DTI can reveal the anatomic bases of a disconnection syndrome by tracking the degeneration of neural pathways and relating it to impaired fMRI activations and behavior. Dougherty et al4 used DTI to demonstrate that properties of specific fiber bundles match those of the hypothetical pathways described in the neurologic literature on alexia.
In the present study, we extend past research demonstrating fMRI connectivity differences between adults with and without dyslexia8 to test the hypothesis that these adults also differ in DTI structural changes (FA). DTI is an elegant method for measuring white matter structural changes to test for abnormalities in specific language pathways.
Materials and Methods
DTI scans were acquired from 7 healthy adult normal readers and from 14 adults with dyslexia on an Achieva 1.5T scanner (Philips, Best, The Netherlands). Participants were fathers in a family genetics study of dyslexia9,10; only fathers were studied, because they are less likely to compensate than mothers in this family genetics study.11 Informed consent was taken from all of the participants, and the study was approved by the University of Washington human subject committee (application 96-1872-D13).
The 7 right-handed control good readers and 14 right-handed dyslexic subjects were healthy, native English speakers and ranged in age from 30 to 45 years. The sample was drawn from a population that varied in education level, but most had some education beyond high school even if they did not complete a degree. All of the subjects completed a 4-hour phenotyping battery of psychometric measures, including the prorated verbal intelligence quotient (IQ) of the Wechsler Adult Intelligence Scale-Revised (WAIS-R).12 Measures were selected based on their good reliability and previous research showing that they assessed processes relevant to learning a written language.13,14 All of the fathers were parents of at least 1 child who met the research criteria for dyslexia. To be categorized as a good reader, the father did not show any indicator of dyslexia subphenotypes on a 4-hour test battery13,14 and did not report any history of ever having reading or writing problems. To be categorized as a father with dyslexia, the father showed indicators of persisting dyslexia: their accuracy and/or rate in oral single pseudoword reading, single real word reading, or passage reading and/or spelling were below the population mean, and at least 1 SD below WAIS-R prorated verbal IQ; they also reported a history of reading and/or spelling problems. Table 1 reports the means and SDs for each measure for the dyslexic subjects and good readers. Woodcock Reading Mastery Test-Revised (WRMT-R)15 Word Identification and Test of Word Reading Efficiency (TOWRE)16 Real Word Reading Efficiency assess the accuracy and rate, respectively, of real word reading. WRMT-R Word Attack and TOWRE Phonemic Decoding Efficiency assess the accuracy and rate, respectively, of phonologic decoding. Gray Oral Reading Test 317 assesses accuracy and rate of oral reading of text.
Means, SDs, and values of t comparing means on psychological measures for control subjects and adults with dyslexia
The fathers did not differ significantly in mean WAIS-R prorated verbal IQ, a measure of ability to reason verbally. The affected fathers were significantly lower than the control fathers on each of the reading, spelling, and rapid automatic naming measures given, except phonologic working memory, for which the difference failed to reach conventional levels of statistical significance (Table 1). These results show that, despite comparable ability to reason verbally, the fathers with dyslexia had failed to develop comparable reading and writing skills and had persistent difficulty in rapidly associating phonologic codes with alphanumeric stimuli.
MR Imaging Acquisition and Analysis
DTI was performed by using a single-shot spin-echo diffusion-weighted echo-planar pulse sequence with 64 sections covering the whole brain at 2.5-mm section thickness (TR/TE = 9500/74 ms; acquisition matrix = 128 × 128). Diffusion MR images were obtained from 32 noncolinear directions with a b-value of 1000 s/mm2 along with a b = 0 image with no diffusion gradients. Images were processed off-line by using FSL (FMRIB [The Oxford Centre for Functional Magnetic Resonance Imaging of the Brain] Software Library, http://www.fmrib.ox.ac.uk/fsl), which included eddy-current compensation, DTIFit to reconstruct diffusion tensors, and FA. DTIFit is FSL software that fits a diffusion tensor model at each voxel of the diffusion images. DTIFit generates the following 3D images at the same matrix size and resolution as the original diffusion images: V1 (first eigenvector), V2 (second eigenvector), V3 (third eigenvector), L1 (first eigenvalue), L2 (second eigenvalue), L3 (third eigenvalue), mean diffusivity, FA, and S0 (raw T2 signal with no diffusion weighting). Voxelwise statistical analysis of the FA data were carried out by using tract-based spatial statistics (TBSS),18 part of FSL.19 First, FA images were created by fitting the diffusion tensor to the raw diffusion data by using (FMRIB Diffusion Toolbox) and then were brain extracted by using brain extraction tool (BET), part of FSL.20 All of the subjects' FA data were then aligned into a common space by using the nonlinear registration IRTK21 (Image Registration Toolkit; http://www.doc.ic.ac.uk/∼dr/software). The mean FA image was then created and thinned to create a mean FA skeleton, which represents the centers of all tracts common to the group. The TBSS method does not need/perform any presmoothing.
In more detail, the coregistration/skeletonization process involves the following steps.18 First, all of the subjects' FA images are affine-transformed into 1 × 1 × 1 mm3 MNI152 space (a normalized/averaged brain developed by the Montreal Neurological Institute). Second, the transformed FA images are averaged to create a mean FA image. Third, the mean FA is fed into the tract skeleton generation, which aims to represent all of the tracts that are “common” to all of the subjects. The skeleton will represent each such tract as a single line (or surface) running down the center of the tract. To achieve skeletonization, the local surface perpendicular direction is estimated (at all of the voxels in the image), and a nonmaximum suppression in this direction is performed. In other words, a search is made along all of the voxels in the local “tract perpendicular direction,” and the voxel with the highest FA is identified as the center of the tract. The estimated tract perpendicular direction is regularized to improve estimation robustness. Fourth, the center of each tract is found by comparing the FA value with the 2 closest neighbors on each side, in the direction of the tract perpendicular. If the FA value is greater than the neighboring values, then the voxel is marked as lying on the skeleton.
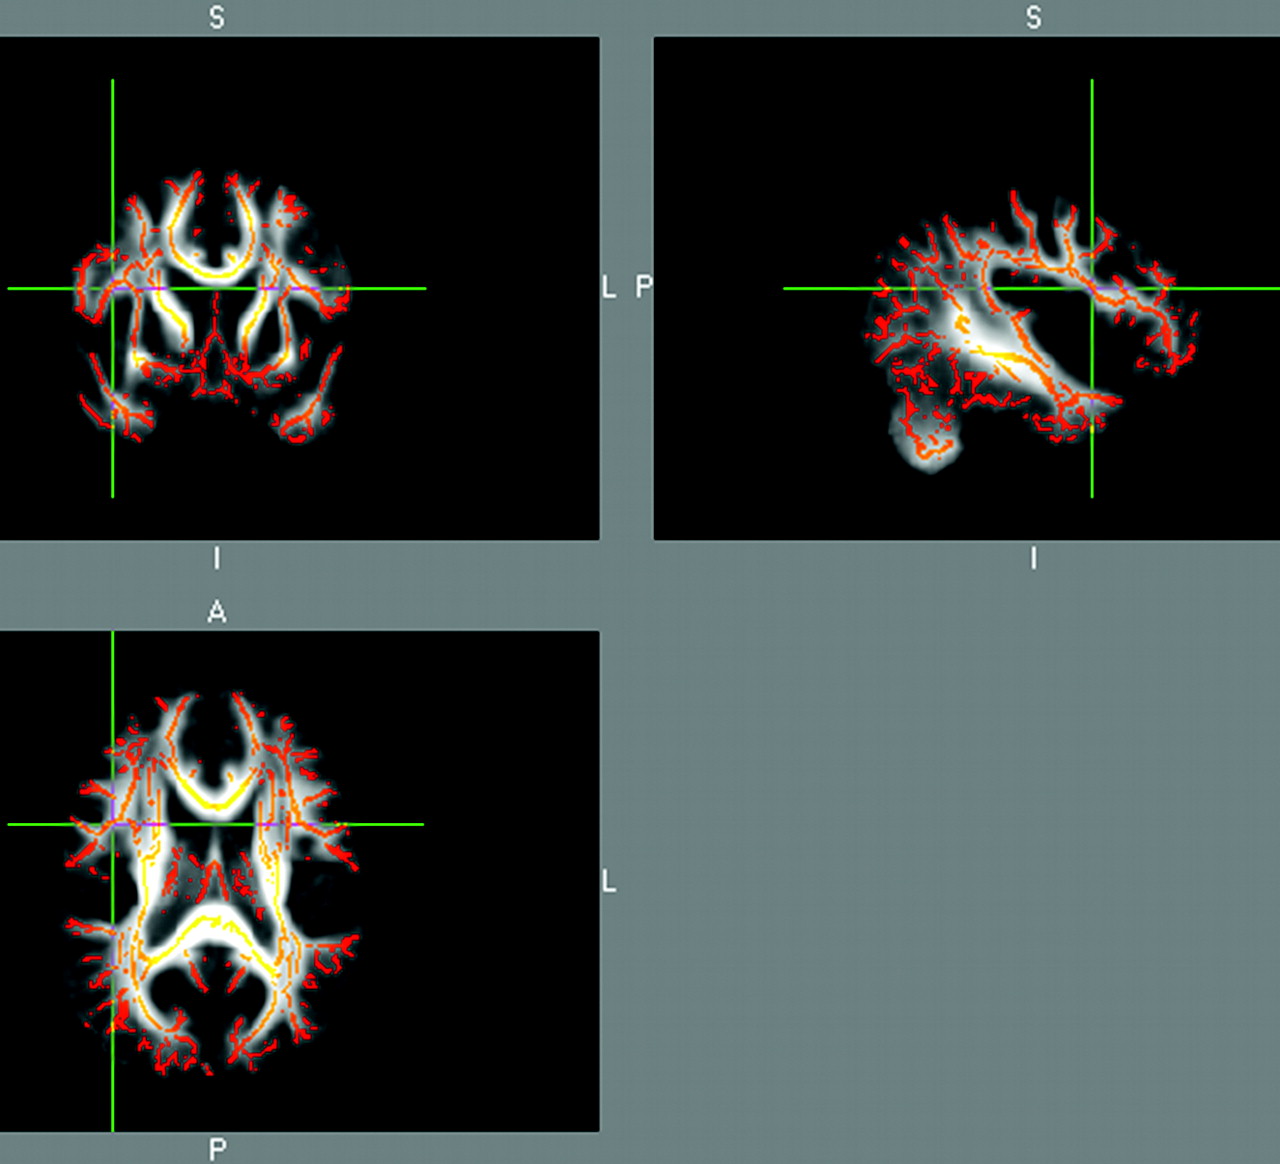
Each subject's aligned FA data were then projected onto this skeleton (Fig 1), and the resulting data were fed into voxelwise cross-subject statistics. A randomization procedure (FSL's randomize, Monte Carlo permutation test) was used to perform the group analysis statistics. TBSS group maps were generated for the nonparametric 2-sample unpaired t test to test whether the control group was greater than dyslexic group and to test whether the dyslexic group was greater than the control group. To perform this nonparametric 2-sample t test, 4D images were created of all of the coregistered skeletonized FA maps (from all of the subjects) and then the following command was executed: “randomize -i TwoSamp4D -o TwoSampT -d design.mat -t design.con -m mask –c 3.” Where TwoSamp4D is the input 4D data of all of the subjects, design.mat contains the design matrix for the GLM model, design.con contains the between group contrast matrix to use with the design matrix, and mask is a brain mask based on FSL's standard brain mask (avg152_brain_mask.hdr/.img). Randomize produces a test statistic image (eg, tstat1) and sets of P value images (stored as 1 − P for more convenient visualization). The –c 3 options allowed for cluster-based thresholding (t value threshold of 3 in this case) corrected for multiple comparisons by using the null distribution of the maximum (across the image) cluster size, and the –c options outputs a 3D image showing the exact location of only the significant clusters with zeros everywhere else. All of the statistical output images are in NIFTI GZ (Neuroimaging Informatics Technology Initiative gzipped) format and were viewed and overlaid onto the standard brain using FSLVIEW (FSL software tool). To anatomically define the significant clusters, the DTI maps were coregistered both to the AAL atlas (automated anatomical labeling map which is a 3D map containing 116 brain regions co-registered to standard MNI space developed by Tzourio-Mazoyer et al22; http://www.sph.sc.edu/comd/rorden/template.html) and to a DTI atlas (http://www.loni.ucla.edu/Atlases/Atlas_Detail.jsp?atlas_id=15). Custom software was written in Fortran to identify the brain region correspondence and MNI (Montreal Neurological Institute) coordinates of each significant cluster.

Overlay of skeletonized averaged FA map (orange) onto standardized FA map from DTIs.
The authors acknowledge that the TBSS technique has limitations with regard to measuring FA values in regions where there are crossing tracts or tract junctions. Voxelwise statistics are still difficult to estimate and interpret at tract junctions or crossings. Skeleton contiguity is not enforced at junctions, and an artificial lowering of FA value can occur at these junctions or crossing tracts. Another potential confound could have been caused by head motion; however, both dyslexic and control subjects were not different in motion (control × direction movement in pixels: mean ± SD = 0.22 ± 0.05; dyslexic × direction movement: mean ± SD = 0.23 ± 0.045; t = 0.56; P = .59; control y direction movement in pixels: mean ± SD = 0.31 ± 0.11; dyslexic y direction movement: mean ± SD = 0.30 ± 0.067; t = 0.15; P = .88) as measured by a centroid calculation of the 33 DTI volumes acquired sequentially.
Results
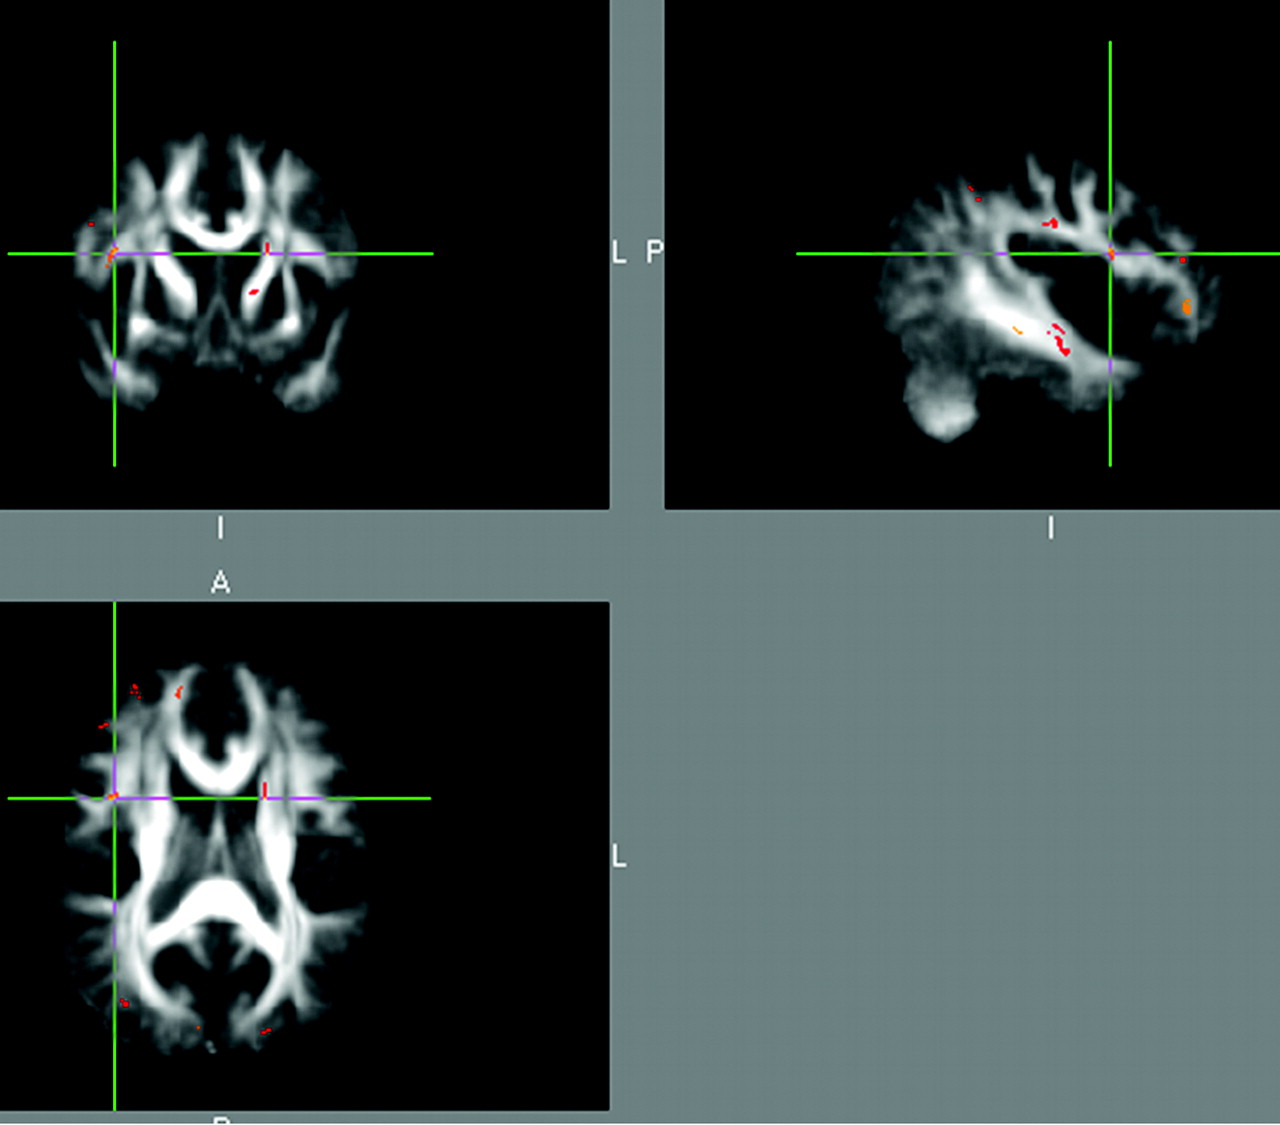
The skeletonized TBSS group map statistical tests showed that control subjects had greater FA compared with dyslexic subjects in many language-related white matter fiber tracts in these adults (Fig 2 and Tables 2 and 3). Significant group difference map clusters occurred in 28 regions located in bilateral white matter tracts within the frontal lobe, temporal lobe, occipital lobe, and parietal lobe (Table 2, as measured from the AAL atlas boundaries). Significant group difference map clusters occurred in an additional 7 regions located in white matter tracts not defined by the AAL atlas (Table 3, as measured from the DTI atlas boundaries).

Group difference map for control subjects greater than dyslexic subjects for skeletonized diffusion FA using TBSS software. The crosshair is positioned on a significant cluster near the right inferior frontal gyrus. Orange-red areas show significant clusters for group difference.
White matter regions within the boundaries of the AAL* atlas where control subjects were significantly greater than dyslexic subjects in the skeletonized fractional anisotropy
White matter brain regions within the boundaries of the DTI tract atlas regions where control subjects were significantly greater than dyslexic subjects in the skeletonized fractional anisotropy
For test of dyslexic subjects greater than control subjects for the FA value, there were 9 regions with significant clusters (Table 4, as measured from the AAL atlas boundaries). An additional significant group difference map cluster occurred in 1 cerebellar region located in white matter tracts not defined by the AAL atlas (Table 5, as measured from the DTI atlas boundaries). Although some of these regions appear to overlap with the control regions, there were no FA voxels that overlap with the test of control subjects greater than dyslexic subjects. In other words, the clusters for this test are spatially separated from the control greater than dyslexic clusters. The largest clusters were in the cerebellum for this test, and the control subjects greater than dyslexic subjects had no clusters in the cerebellum.
White matter regions within the boundaries of the AAL* atlas where dyslexic subjects were significantly greater than control subjects in the skeletonized fractional anisotropy
White matter brain regions within the boundaries of the DTI tract atlas regions where dyslexic subjects were significantly greater than control subjects in the skeletonized fractional anisotropy
DTI FA, eigenvalues for 21 subjects within a significant cluster near the left inferior frontal gyrus (for control subjects greater than dyslexic subjects)
Software was written to extract individual subject DTI FA and eigen values within a significant cluster near the left inferior frontal gyrus. The results are shown in Table 4. There was a significant difference (t test P < .005) between the control and dyslexic subjects as tested in these individual FA values in column 2.
Discussion
These results demonstrate white matter differences between adults with and without dyslexia in language-related regions of the brain (see specific region description below). Similar to the results reported by Stanberry et al8 that showed stronger functional connectivity in adult control subjects from seed points placed in both bilateral inferior frontal gyri, the current study group also showed differences in the inferior frontal gyri along with several additional brain regions. These results demonstrate DTI structural connectivity that is consistent with the functional connectivity results (Table 2). Common brain regions found across structural and functional connectivity studies include the right superior frontal gyrus, right middle frontal gyrus, right inferior frontal gyrus-operculum, right inferior frontal gyrus-pars triangularis, right middle occipital gyrus, bilateral fusiform gyri, right inferior parietal, and bilateral inferior temporal gyrus. In contrast to the previous DTI studies of developmental dyslexia that mainly showed differences in left temporoparietal brain regions, the current study reports DTI white matter differences (FA) between adults with and without dyslexia not only in both temporal regions (fusiform and inferior temporal) but also in right parietal (inferior), right occipital (middle), and many frontal regions.
One possible reason for these reported differences with previous DTI studies is that the current study is the first study that used the new technique of the FSL tractography-based (skeletonized) method for coregistration and group map contrast statistical comparison in the study of dyslexia. However, the main result reported here is consistent with other dyslexia DTI studies (discussed in the introduction) showing lower FA values in white matter in dyslexic subjects compared with control subjects. A possible explanation for the lower FA values in dyslexia is that, in white matter, there could be a less coherent bundle of tracts relating to connectivity of these important language pathways. In other words, the directionality and number of fibers in the white matter may be different in dyslexia and relate to how the water diffuses more readily along the orientation of axonal fibers than in other directions due to obstruction from structural components, such as the myelin sheath. Of particular note is the important change found in the superior longitudinal fasciculus (SLF), which has a role in language. The SLF is composed of 4 distinct components,23 SLF I, SLF II, SLF III, and arcuate fascicle. SLF III connects the rostral inferior parietal cortex, which receives information from the ventral precentral gyrus. This suggests that the SLF III transfers somasensory information, such as language articulation, between the ventral premotor cortex, the Brodmann 44 (pars opercularis), the supramarginal gyrus (Brodmann 40), and the lateral inferior prefrontal cortex working memory (Brodmann 46).
Conclusion
The DTI FA results in the bilateral white matter showing higher FA in adult control subjects compared with adults with dyslexia (relating to white matter fiber tract integrity) are consistent with our previous functional connectivity results from seed points in the bilateral inferior frontal gyrus. These DTI findings add to previous MR imaging, functional magnetic resonance spectroscopy, and fMRI connectivity differences found in the right inferior frontal gyrus regions between people with and without dyslexia,24–26 which suggest that anomalies at many levels of the brain substrate in this region may contribute to dyslexia. Taken together, these results suggest disconnections in structural, as well as functional, connectivity in the development of dyslexia.
Footnotes
This work was supported by grants P50 33812 and HD25858 from the National Institute of Child Health and Human Development.
Paper previously presented at: Annual Meeting of the Organization for Human Brain Mapping, June 10-14, 2007; Chicago, Ill.
References
- Received November 20, 2007.
- Accepted after revision December 20, 2007.
- Copyright © American Society of Neuroradiology
In this issue


Jump to section
Related Articles
Cited By...
- No Evidence for Systematic White Matter Correlates of Dyslexia and Dyscalculia
- No Evidence for Systematic White Matter Correlates of Dyslexia: An Activation Likelihood Estimation Meta-Analysis
- Tracking the Roots of Reading Ability: White Matter Volume and Integrity Correlate with Phonological Awareness in Prereading and Early-Reading Kindergarten Children