
Abstract
BACKGROUND AND PURPOSE: Higher magnetic field strengths and continuous improvement of high-resolution imaging in multiple sclerosis (MS) are expected to provide unique in-vivo and non-invasive insights in pathogenesis and clinical monitoring. The purpose of this study was to investigate the potential of high-resolution imaging of MS lesions in vivo comparing 7T with conventional 1.5T.
MATERIALS AND METHODS: Twelve consecutive patients with clinically definite MS were scanned on a 7T whole-body scanner and on a 1.5T Avanto. The 1.5T and 7T imaging protocol consisted of high-resolution axial proton density (PD) + T2-weighted turbo spin-echo and T2*-weighted gradient-echo (GRE), and sagittal T1-weighted 3D magnetization-prepared rapid acquisition of gradient echo.
RESULTS: The sequence parameters at 7T had to be modified because of specific absorption rate (SAR) restrictions while keeping contrast parameters equivalent to 1.5T. White matter lesions were better detected and delineated from adjacent structures at 7T compared with 1.5T. There were 42% of the patients who showed additional lesions at 7T: there were 97 white matter lesions detected on 1.5T versus 126 lesions at 7T, an increase of 23%. The perivascular migration of MS lesions was well visualized on T2*-weighted GRE sequences. In larger lesions (10 mm), a multilayer structure was revealed on T2*-weighted GRE not seen at 1.5T. Because of the higher resolution, it was possible to differentiate between juxtacortical white matter lesions and cortical lesions. There were 44% of the subcortical lesions depicted at 7T that showed cortical involvement.
CONCLUSIONS: Ultra-high-field imaging of patients with MS at 7T was well tolerated and provided better visualization of MS lesions in the gray matter and demonstrated structural abnormalities within the MS lesions themselves more effectively.
Multiple sclerosis (MS) is a chronic, multifocal, inflammatory disease of the central nervous system, traditionally regarded as a disorder of the white matter. The main pathologic features of MS lesions are primarily a perivascular inflammation, demyelination, gliosis, and axonal injury.
Until recently, the appearance of cortical gray matter lesions in MS was unknown. In his seminal description of the pathologic process of multiple sclerosis, Charcot1 did not describe lesions in the cerebral cortex. The first descriptions by Brownell and Hughes2 and subsequently by Lumsden3,4 made the existence of gray matter lesions apparent. Several postmortem pathologic studies have revealed significant involvement of the gray matter.5–7
The sensitivity of MR imaging toward MS-related damage was shown in the seminal study by Young et al,8 and the role of MR imaging in the diagnosis of MS has been strengthened with the introduction of the McDonald criteria.9 Because increased sensitivity for lesion detection may accelerate definite diagnosis and permit earlier treatment, reliable lesion detection is desirable in patients with suspected MS.
Cortical gray matter lesions are poorly detected at field strengths up to 1.5T because of their small size and limitations to achieve sufficient spatial resolution and contrast. Ultra-high-field systems (> 3T), which are currently under investigation for clinical imaging, are expected to improve the in vivo imaging of MS lesions in the white and especially gray matter. An improvement in image quality has already been shown at ultra-high field in ex vivo studies.10 The first recently published in vivo studies at 7T11,12 in a small patient cohort have already shown that ultra-high-field imaging has a much higher potential than assumed.
The purpose of this study was to investigate the potential of high-resolution imaging of MS lesions in vivo, comparing 7T with conventional 1.5T.
Materials and Methods
Patients
The ethics committee of our university approved the study, and we obtained written informed consent from all subjects. Twelve consecutive patients with definite MS (8 women and 4 men) were included in the study. A screening clinical MR imaging examination revealed a low T2 lesion load, between 8 and 14 lesions, in all patients. Their mean age of the patients was 32 years (age range, 22–47 years), the median disease duration was 5 years (range, 1–10 years), and the median Expanded Disability Status Scale (EDSS) score was 2.8 (range, 1–3.5). According to the Lublin and Reingold criteria,13 all patients had relapsing-remitting MS. Clinical information and EDSS were obtained by a neurologist experienced in the care of patients with MS.
Imaging Protocol
Imaging was performed within 3 days of one another on a 1.5T system and a 7T system. The 1.5T system was an Avanto whole-body scanner (Siemens Healthcare, Erlangen, Germany) with a 12-channel phased-array matrix receive-only head coil. The 7T system was a Magnetom 7T whole-body scanner (Siemens Healthcare) with an 8-channel phased-array transmit-receive head coil (Rapid Biomedical, Würzburg, Germany).
Axial images were planned parallel to the anterior and posterior limb of the corpus callosum. Imaging protocols were modified for 7T, with the intention to use the increased signal-to-noise ratio (SNR) to acquire thinner sections with higher resolution while maintaining subjective comparable contrast parameters with regard to the standard sequence at 1.5T.
The imaging protocol consisted of high-resolution axial proton density (PD)/T2-weighted turbo spin-echo (TSE), T2*-weighted gradient-echo (GRE), and sagittal T1-weighted 3D magnetization-prepared rapid acquisition of gradient-echo (MPRAGE). No contrast agent was applied, as the optimal concentration of gadolinium is not yet known at 7T. For axial PD/T2-weighted TSE, the acquisition parameters at 1.5T were TR, 3000 ms; TE, 11/98 ms; flip angle (FA), 150°; section thickness, 2 mm; FOV, 250 × 187 mm2; matrix, 512 × 228; and acquisition time (AT), 5.07 minutes. For axial T2*-weighted GRE, the acquisition parameters at 1.5T were TR, 872 ms; TE, 26 ms; FA, 20°; section thickness, 2 mm; FOV, 512 × 152 mm2; matrix, 256 × 192; and AT, 4.57 minutes. For sagittal T1-weighted 3D MPRAGE, the acquisition parameters at 1.5T were TR, 1900 ms; TE, 3.07 ms; TI, 1100 ms; section thickness, 1 mm; FOV, 260 × 260 mm2; matrix, 256 × 256; and AT, 7.58 minutes.
Nearly all sequence parameters at 7T had to be modified because of specific absorption rate (SAR) restrictions, the different behavior of tissue (changes in T1 and T2 times), and the higher exploitable SNR, but it was possible to adjust pulse sequence parameters to keep tissue contrast subjective equivalent to the imaging protocols at 1.5T.
For axial PD/T2-TSE, the acquisition parameters at 7T were TR, 6000 ms; TE, 11/74 ms; FA, 130°; section thickness, 2 mm; FOV, 256 × 192 mm2; matrix, 512 × 384; and AT, 4.24 minutes. For axial T2*-weighted GRE, the acquisition parameters at 7T were TR, 750 ms; TE, 25 ms; FA, 35°; section thickness, 2 mm; FOV, 256 × 192; matrix, 512 × 384; and AT, 2.54 minutes. For sagittal T1-weighted 3D MPRAGE, the acquisition parameters at 7T were TR, 2500 ms; TE, 1.79 ms; TI, 1100 ms; FA, 6°; section thickness, 0.6 mm; FOV, 256 × 209 mm2; matrix, 512 × 353; and AT, 7.43 minutes.
PD/T2-TSE Sequence
To overcome SAR limitations at 7T, we had to reduce the number of sections to a maximum of 12 (mean, 6 sections). Using a 100% distance factor, we performed the interleaved acquisition by using gap filling of the acquisition block. To cover the whole brain, 4 to 6 acquisition blocks were used with an acquisition time of approximately 30 minutes.
To achieve subjective comparable signal intensity contrast of gray and white matter between the 1.5T and 7T system, the TE and TR had to be adjusted for the ultra-high field. The optimal signal intensity of gray and white matter as well as CSF was achieved with a TR of 6000 ms and a TE of 11/74 ms because of the T2 relaxation times.
T2*-Weighted GRE Sequence
With a TR of 750 ms, up to 15 sections can be imaged. To avoid cross-talk between the sections, we again used a 100% distance factor and performed gap-filling to acquire the whole acquisition block. To cover the whole brain, 2 acquisition blocks were used with an acquisition time of approximately 10 minutes. The optimal T2*-weighted contrast was achieved with a TR of 750 ms and a TE of 25 ms.
The brain has unusually high concentrations of iron, which is distributed in unique patterns unlike any other organ. Because of the different T2 relaxation times at ultra-high-field strength compared with 1.5T, the T2*-weighted GRE sequence is the most sensitive sequence for susceptibility effects and visualization of hemosiderin and ferritin because of the rapid T2* signal intensity decay (ie, short T2* times).
Because of the dominance of T2 weighting related to the short T2 values of tissues at ultra-high field, it is, at the moment, not feasible to acquire pure T1-weighted images with use of simple SE sequence techniques.
The acquisition of a fluid-attenuated inversion recovery sequence was not feasible at the time of the study. The inversion pulse in conjunction with the TSE readout is more power consuming; therefore, the SAR limit is reached earlier. The needed time to acquire a single section was not tolerable for this clinical study.
Results
PD/T2-TSE Sequence
Because of the higher spatial resolution at 7T, the detection and delineation of white matter lesions were improved. Seven patients (42%) showed more white matter lesions at 7T than at 1.5T. There were 97 white matter lesions depicted at 1.5T and 126 lesions at 7T (an increase of 23%). On average, 5 more lesions were depicted at 7T (range, 1–7 lesions).
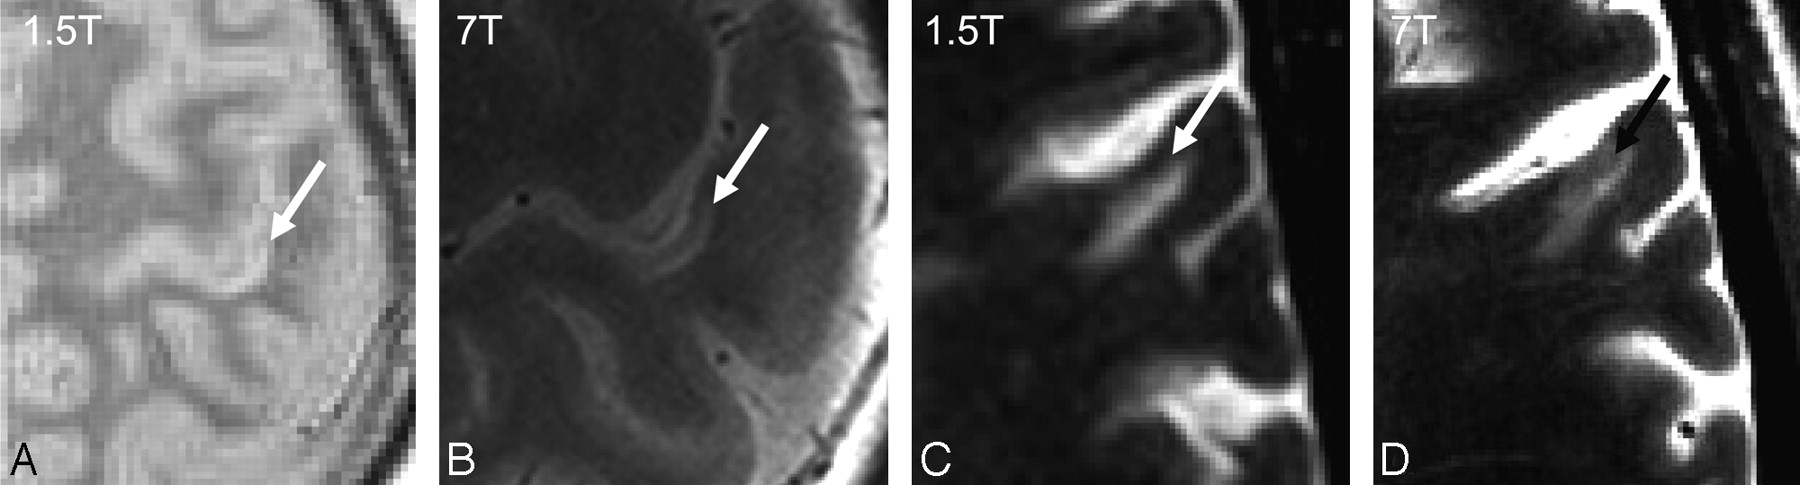
The involvement of the gray matter in juxtacortical lesions could also be made visible at 7T. In 2 patients showing several juxtacortical lesions (n = 9), 44% of them had a cortical involvement (Fig 1). At 1.5T, no cortical lesions could be identified within any section with certainty.

Subcortical lesions in 1.5T and 7T: PD/T2-weighted TSE (A) and (B) and T2*-weighted GRE (C) and (D). The cortical involvement of the subcortical MS lesion can only be definitively seen on 7T.
T2*-Weighted GRE Sequence
All deep white matter MS lesions showed a perivascular migration at 7T, which was not visible at 1.5T. The central vein was visible, even in the smallest MS plaques, because of the strong T2* effect at ultra-high field. The juxtacortical lesions showed no perivascular migration. In larger lesions (> 10 mm), multilayer structure was revealed on T2*-weighted GRE not seen at 1.5T. This multilayer structure reveals inhomogeneity within the MS plaques by showing regions of higher intensity along with lower intensity. Larger lesions showed a hypointense rim at 7T not seen at 1.5T (Fig 2). The lesions characterized by a hypointense rim were only shown in 3 patients having an EDSS score greater than 2.0.

Perivascular migration of MS lesions seen at 7T (A and B, black arrows). Multilayer structure and hypointense rim of MS lesions on T2*-weighted GRE sequence at 7T (A and B, white arrows).
The T2* sequence at 7T revealed remarkable anatomic detail information of the gray and white matter and was useful even in differentiating the deep gray matter nuclei. MS lesions within the deep gray matter were visible at 7T, which could not be depicted at 1.5T (Fig 3).

Infratentorial imaging at 1.5T (A) and 7T (B). The MS lesion in the right cerebellar peduncle is well seen at both field strengths (black arrow). The MS lesion in the right dentate nucleus can only be appreciated at 7T (white arrow).
T1-MPRAGE (3D)
The nearly isotropic resolution of the MPRAGE sequence provides a useful T1-weighted contrast with good gray and white matter contrast and contrast between the lesion and its surroundings on 1.5T and 7T (Fig 4). In addition, the whole brain coverage in less than 8 minutes is very beneficial. At 1.5T, no cortical lesions could be identified within any section with certainty.
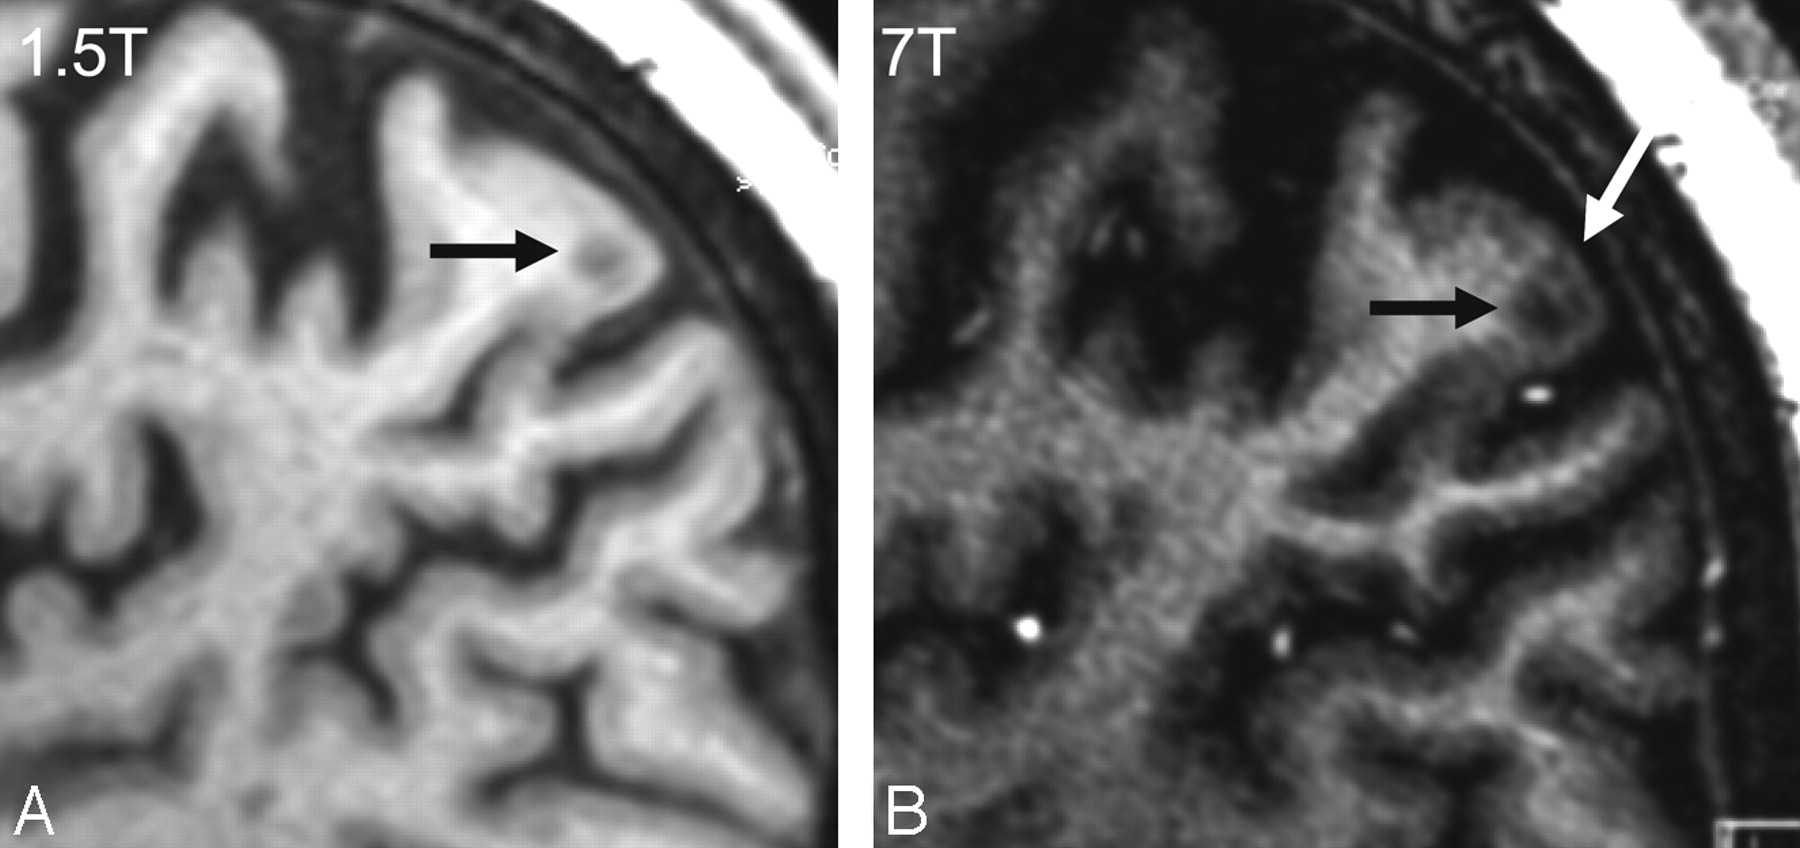
Leucocortical lesion type I (black arrow) at 1.5T (A) and 7T (B). Intracortical lesions at 7T (B) in the T1-MPRAGE sequence not seen at 1.5T (white arrow).
Because of the higher resolution at 7T, it was possible to visualize intracortical lesions. We were able to depict 21 intracortical lesions, which is probably a small part of the real extent of cortical involvement. Even the differentiation between subcortical lesions that extend into the cortex and intracortical lesions is possible.
Patients showing the most subcortical lesions showed cortical lesions. The cortical lesions were depicted at the frontal and parietal lobe at the convexity. Nearly all of the patterns of cortical involvement defined by Kidd et al6 could be identified with use of imaging at 7T except type III lesions.
Discussion
Imaging at 7T shows advantages compared with standard MR imaging at 1.5T. The modification of relaxation mechanisms at 7T and its effect on the white and gray matter tissues and lesions enabled the detection of the additional pathologic features in our study. The exact combination of parameters used at ultra-high field is impossible to mimic at lower-field strengths, even under extreme conditions of unusually long acquisition times at 1.5T, because the fundamental underlying tissue contrast is different at higher magnetic field.
Patients with MS have been studied at 1.5T compared with higher-field strengths in previous studies. Keiper et al14 assessed 15 patients by using a T2-weighted fast spin-echo sequence at 1.5 and 4T. Nearly one-third more lesions (303 versus 215) were detected at the higher field strength, generally maintaining the same imaging parameters at both field strengths (3-mm section thickness) but increasing the acquisition matrix at 4T (256 × 192 versus 512 × 256). Our findings are in good concordance with these results. Sicotte et al15 compared MS lesions at 1.5 and 3T, maintaining all imaging parameters equal. Nonetheless, more lesions could be detected at the higher field strength, and the measured lesion volume was increased by 12%. It must be assumed that the better lesion detection was because of the increased SNR and/or altered tissue contrast from differing relaxation times.
In our study, the perivascular distribution of periventricular MS white matter lesions could be shown in vivo in the T2* sequence at 7T in 100% of the lesions. The associated vessel was seen even in the small lesions (< 3 mm). This corresponds with histologic reports,16 suggesting that this technique has acceptable sensitivity.
Subcortical lesions showed a cortical involvement but did not show any perivascular migration. MR imaging differences between periventricular and peripheral lesions have been observed previously.17 It has been hypothesized that different pathogenic mechanisms may account for lesion formation in different CNS locations.18 Alternatively, it is possible that peripheral lesions, which tend to be smaller than periventricular lesions, are more likely to contain blood vessels that are beyond the resolution of the MR imaging technique. That 38% of the subcortical lesions showed a cortical involvement implies that these lesions have a different pathologic mechanism. Three different types of neocortical lesions have been described: leucocortical (type I), intracortical (type II), and subpial (type III). Type I lesions account for approximately one third of all neocortical lesions in MS.7,10,19,20 Perhaps the subcortical lesions depicted at 1.5T and 7T are type I lesions and not white matter lesions. This could explain the different morphologic pattern.
Intracortical lesions are widespread and cannot be well detected even with 7T.
An interesting observation of this study was the first depiction of a hypointense rim of periventricular MS lesions in the 7T T2* sequence. According to older histopathologic studies,21–23 reactivating and demyelinating lesions show surrounding iron deposits. Iron deposits implicate oxidative damage, which might be explained through extended inflammatory vein wall damage.
Conclusions
Ultra-high-field imaging of MS lesions at 7T was well tolerated and provided better visualization than 1.5T of MS lesions in the white and gray matter and demonstrated structural abnormalities within the MS lesions themselves more effectively. Additional studies will have to show whether the hypointense rim observed in several MS lesions is ferritin/iron and, if so, whether it is a clinically relevant biomarker. Furthermore, the relevance of cortical lesions to the clinical outcome has to be investigated, and their inclusion in the MR imaging criteria could be discussed.
References
- Received September 15, 2008.
- Accepted after revision October 29, 2008.
- Copyright © American Society of Neuroradiology
In this issue


Jump to section
Related Articles
Cited By...
- Automatic segmentation of medial temporal lobe subregions in multi-scanner, multi-modality MRI of variable quality
- Assessment of Heating on Titanium Alloy Cerebral Aneurysm Clips during 7T MRI
- Imaging cortical multiple sclerosis lesions with ultra-high field MRI
- An argument for broad use of high efficacy treatments in early multiple sclerosis
- Widespread inflammation in CLIPPERS syndrome indicated by autopsy and ultra-high-field 7T MRI
- Ultra-High-Field MRI Visualization of Cortical Multiple Sclerosis Lesions with T2 and T2*: A Postmortem MRI and Histopathology Study
- Ultra-High-Field MR Neuroimaging
- Multicontrast MR Imaging at 7T in Multiple Sclerosis: Highest Lesion Detection in Cortical Gray Matter with 3D-FLAIR
- Distinct lesion morphology at 7-T MRI differentiates neuromyelitis optica from multiple sclerosis
- Multiple Sclerosis and Chronic Cerebrospinal Venous Insufficiency: The Neuroimaging Perspective