
Abstract
BACKGROUND AND PURPOSE: Knowledge of the sequence of signal-intensity (SI) changes on conventional and diffusion-weighted MR imaging (DWI) following perinatal arterial ischemic stroke (PAIS) is limited, adding to the difficulty in timing the onset of PAIS. We hypothesized that SI changes seen on early sequential MR imaging following PAIS should follow a similar time course. The aim of this study was to evaluate the time course of SI changes by using a simple classification that could be assessed visually from conventional imaging and DWI in term-born neonates with symptomatic unilateral PAIS.
MATERIALS AND METHODS: Infants ≥36 weeks gestation with unilateral PAIS in the territory of a main cerebral artery with a first MR imaging performed within the first postnatal month were included in this study. All subsequent scans up to 3 months postnatal age were also evaluated. For the conventional MR imaging scans, a visual SI scoring system was used (−1 = lower, 0 = equal, 1 = higher) compared with the contralesional hemisphere. For the DWIs, SI of the infarcted tissue was classified into the 3 groups: 1) severe hyperintensity (HI), 2) moderate and mild HI, and 3) no HI.
RESULTS: We analyzed 43 scans (mean age at first scanning, 4 days) from 21 term infants. Changes in SI on conventional T1 and T2 images were remarkably consistent among infants. The cortex was of low SI on T1 and high SI on T2 until day 6 when SIs reversed and cortical highlighting was seen for 1–2 months. The white matter was high SI on T1 in the first 8–9 days and on T2 for >2 weeks before becoming low SI. Secondary SI changes remote from the infarction were seen in the thalamus and brain stem in the first week, and atrophy was seen after 4 weeks. All DWIs showed high SI of the affected region until at least day 4, which fell to equal or below that of the contralesional hemisphere by day 12.
CONCLUSIONS: The pattern of SI change on conventional imaging and DWI following PAIS was remarkably consistent among patients, suggesting that PAIS in symptomatic term-born infants occurs within a very limited timeframe around birth.
Perinatal arterial ischemic stroke (PAIS) is an important cause of long-term neurologic morbidity including cerebral palsy, epilepsy, and cognitive impairment.1–6 The incidence of neonatally symptomatic PAIS is at least 1/4000 term liveborn infants.7 Term neonates with PAIS usually present with seizures after having been considered healthy after birth, with Apgar scores and cord pH values that were considered normal.1,8 These seizures may be, but are not always, contralateral to the site of infarction, are mostly clonic in nature, and can be subtle9; sometimes the presenting symptoms are apnea, duskiness, poor feeding, hypotonia, and irritability.10,11 PAIS is occasionally associated with hypoxic-ischemic encephalopathy (HIE).12,13 The timing of presentation is often >2 hours after birth and may be up to 3–4 days.
MR imaging is the neuroradiologic investigation of choice for PAIS.14,15 Diffusion-weighted imaging (DWI) can detect neonatal ischemic brain injury within 24 hours of its onset,16,17 with the acute changes being seen for several days. Because the initial clinical symptoms can be subtle and knowledge of the exact time of onset of the stroke in neonates is usually uncertain, care must be exercised in the interpretation of DWI for timing the onset of the lesion.18 Literature on radiologic criteria for timing of PAIS onset combining conventional imaging and DWI is limited and includes mostly case descriptions.16,17–24 We hypothesized that signal-intensity (SI) changes seen on early sequential MR imaging following PAIS should follow a time course similar to that of DWI. The aim of the study was to evaluate the time course of SI changes by using a simple classification that could be assessed visually from conventional imaging and DWI in term-born neonates with symptomatic unilateral PAIS.
Materials and Methods
Patients
The study was part of a longitudinal project documenting the evolution of neonatal brain lesions of both referred infants and those born at the Hammersmith and Queen Charlotte's Hospitals, London, UK. Data were collected between 1994 and 2004. As part of this study, all neonates who presented with seizures or other symptoms known to occur with stroke for which no other explanation was found underwent neonatal brain MR imaging. Study approval was granted by the Research Ethics Committee of the Hammersmith Hospitals Trust, and parental consent was obtained for all scanning.
Only infants of ≥36 weeks gestation with unilateral PAIS in the territory of a main cerebral artery, with a first MR imaging within the first postnatal month, were included in this study. We also evaluated all subsequent scans up to 3 months postnatal age. Exclusion criteria were bilateral infarction seen on MR imaging, congenital infection, major brain or other malformations, multiple dysmorphic features, chromosomal abnormality, or evidence of HIE. The infarcts were classified according to the vessel territory involved.
Conventional MR Imaging and DWI
From 1994 to 1999, infants were scanned on a 1T MR imaging scanner (Picker; Cleveland, Ohio) by using conventional T1-weighted spin-echo (CSE; TR 860/TE 20 ms) and T2-weighted spin-echo (SE; TR 3000/TEeff 120 ms) sequences. After 1999, images were acquired on a 1.5T Eclipse system (Philips Medical Systems, Cleveland, Ohio) by using conventional CSE imaging (TR 500/TE 15 ms) and T2-weighted fast SE (TR 4500/TEeff 210 ms) at 5-mm section thickness. Single-shot echo-planar DWIs were also acquired. A reference image was obtained with a b-value of 0, and DWIs were obtained with a b-value of 1000 s/mm2. For some of the early scans, only single-section DWIs including the stroke areas were obtained; in these cases, the DWI sequence used a cardiac-gated pulsed gradient SE sequence with a b-value of 600 s/mm2. The infants were usually sedated for imaging with oral chloral hydrate (30–50 mg/kg). Pulse oximetry and electrocardiographs were monitored throughout the procedure. Ear protection was used (Natus MiniMuffs; Natus Medical, San Carlos, Calif). An experienced pediatrician, trained in MR imaging procedures, was in attendance throughout the examination.
Scoring System
For this study, images were assessed by 2 authors (J.D. and M.A.R.), and any differences were resolved by consensus. The agreement between the observers before consensus was reached was high (κ ≥ 0.87 for all the different assessments). The infarcts were classified according to the arterial territory involved. We used a scoring system comparing the SI of infarcted tissue with that of the equivalent tissue in the contralesional hemisphere as an internal control documenting the SI as higher (1), equal (0), or lower (−1). We evaluated the SI of the white matter and cortical gray matter; white matter−cortical gray matter contrast; and the delineation of the stroke borders and evidence of swelling, atrophy, or tissue loss (Table 1). We also evaluated the SI of the basal ganglia (caudate nucleus, putamen, and globus pallidus), the posterior limb of the internal capsule (PLIC), and the brain stem. To evaluate the DWIs, we classified the SI of the infarcted tissue into 3 groups: 1) severe hyperintensity (HI), 2) moderate and mild HI, and 3) no HI.
Scoring system
Statistical Analysis
We calculated the inter-rater reliability by using the Statistical Package for the Social Sciences software (SPSS, Chicago, Ill).
Results
Patient Characteristics
During the study period, 28 term-born infants were diagnosed with unilateral PAIS; 7 were not included in this study because their first scan was >1 month after birth. We analyzed 43 conventional MR images all obtained within <3 postnatal months (mean age at first scanning, 4 days) from 21 infants (Table 2). All were born after a period in labor, and none, by elective cesarean delivery: Six were born by spontaneous vaginal delivery; 7, by forceps or vacuum extraction; and 8, by emergency cesarean delivery for fetal distress, prolonged second stage, or failed instrumental delivery. In 10 patients, a prolonged second stage of labor (≥2 hours) was recorded. The infants had a median gestational age of 40 weeks (range, 38–42 weeks) and a median weight of 3554 g (range, 2845–4450 g). Thirteen infants were male. All had Apgar scores ≥5 at 5 minutes (median, 10; range, 5–10). Median cord pH was 7.26 (range, 7.00–7.38). All infants went to the postnatal wards initially and were later admitted to the neonatal unit. All except 1 (infant 8) had overt clinical seizures (median, day 1; range, days 1–3). Infant 8 had been born by emergency cesarean delivery after failed forceps and vacuum extraction attempts and was jittery when examined. He was initially scanned as part of a study recruiting infants from the postnatal wards rather than because of his symptoms.
Patient characteristics
Five infants had a main branch middle cerebral artery (c-MCA) territory infarction involving both hemispheric tissue and the basal ganglia. Four infants had infarction within the anterior MCA branch territory, and 9 infants, within the posterior MCA branch territory. Two infants had a posterior cerebral artery (PCA) territory infarction, and 1 infant had anterior cerebral artery (ACA) territory and anterior branch MCA infarctions. The lesions were left-sided in 17 patients. Fifteen infants had undergone DWI (median age at first scanning, 4 days; range, 2–14 days). The time intervals between sequential conventional imaging and DWI for any 1 infant are given in Table 2.
Conventional Imaging Findings
SI levels in the white matter and cortex in the regions of infarction compared with the contralateral hemisphere on T1- and T2-weighted imaging are summarized in Figs 1 and 2. On both T1- and T2-weighted images, tissue swelling of the region of infarction was seen on the first scans and this lasted until approximately day 8.

Graph shows the SI score (y-axis) of the infarcted cortex on T1-weighted MR images from each postnatal day (x-axis). d indicates day; w, week; m, month.

Graph shows the SI score (y-axis) of the infarcted white matter (WM) on T1-weighted MR images from each postnatal day (x-axis). d indicates day; w, week; m, month.
T1-Weighted Imaging
On T1-weighted images, the affected cortex was always initially of low SI, changing to high SI, so-called cortical highlighting, after day 6. Loss of cortical tissue in the areas of infarction started to be seen from 14 days but was most marked after 1 month. The cortical highlighting remained visible until 2 months in the remaining cortex (Fig 1).
The white matter on T1-weighted images had moderately higher SI than the white matter in the contralateral hemisphere in the first 9 postnatal days, though in the first 5 days when the cortex was of low SI, this was more difficult to discern because the initial visual impression was that the SI in the white matter was lower than that in the contralateral hemisphere. After day 9, the SI became lower than that in the other hemisphere until about 1 month after birth when SIs became equal (Fig 2). The first appearance of tissue loss often with cyst formation in the areas of infarction was seen between 14 days and 1 month but was most marked after 1 month. The basal ganglia were clearly involved in the 5 patients with main branch MCA infarction and, in the first 4 days, were of low SI intensity on T1-weighted images; this changed to high SI from days 5 to 7. From day 7 until day 14, we saw a variegated (checkerboard) pattern.
After 1 month, tissue atrophy or cysts were seen (Fig 3). Asymmetry of the ipsilateral PLIC compared with the contralesional side was seen in 9 patients (infants 1, 5, 7, 10, 14, 15, and 18–20). During the study period, a lower SI was seen in the ipsilateral PLIC. No clear visual SI changes were seen in the ipsilateral brain stem on the T1-weighted images in the time period studied. Ipsilateral peduncles became smaller in those with T2-weighted changes after 1 month. Although the thalamus was not initially involved in the stroke of any infant, a reduction in ipsilateral thalamic size was seen in 10 (infants 1, 2, 5, 9, 10, 13, 14, 17, 18, and 20) on later scans within the first 3 postnatal months. The degree of thalamic reduction appeared to relate positively to the size of the original area of infarction.

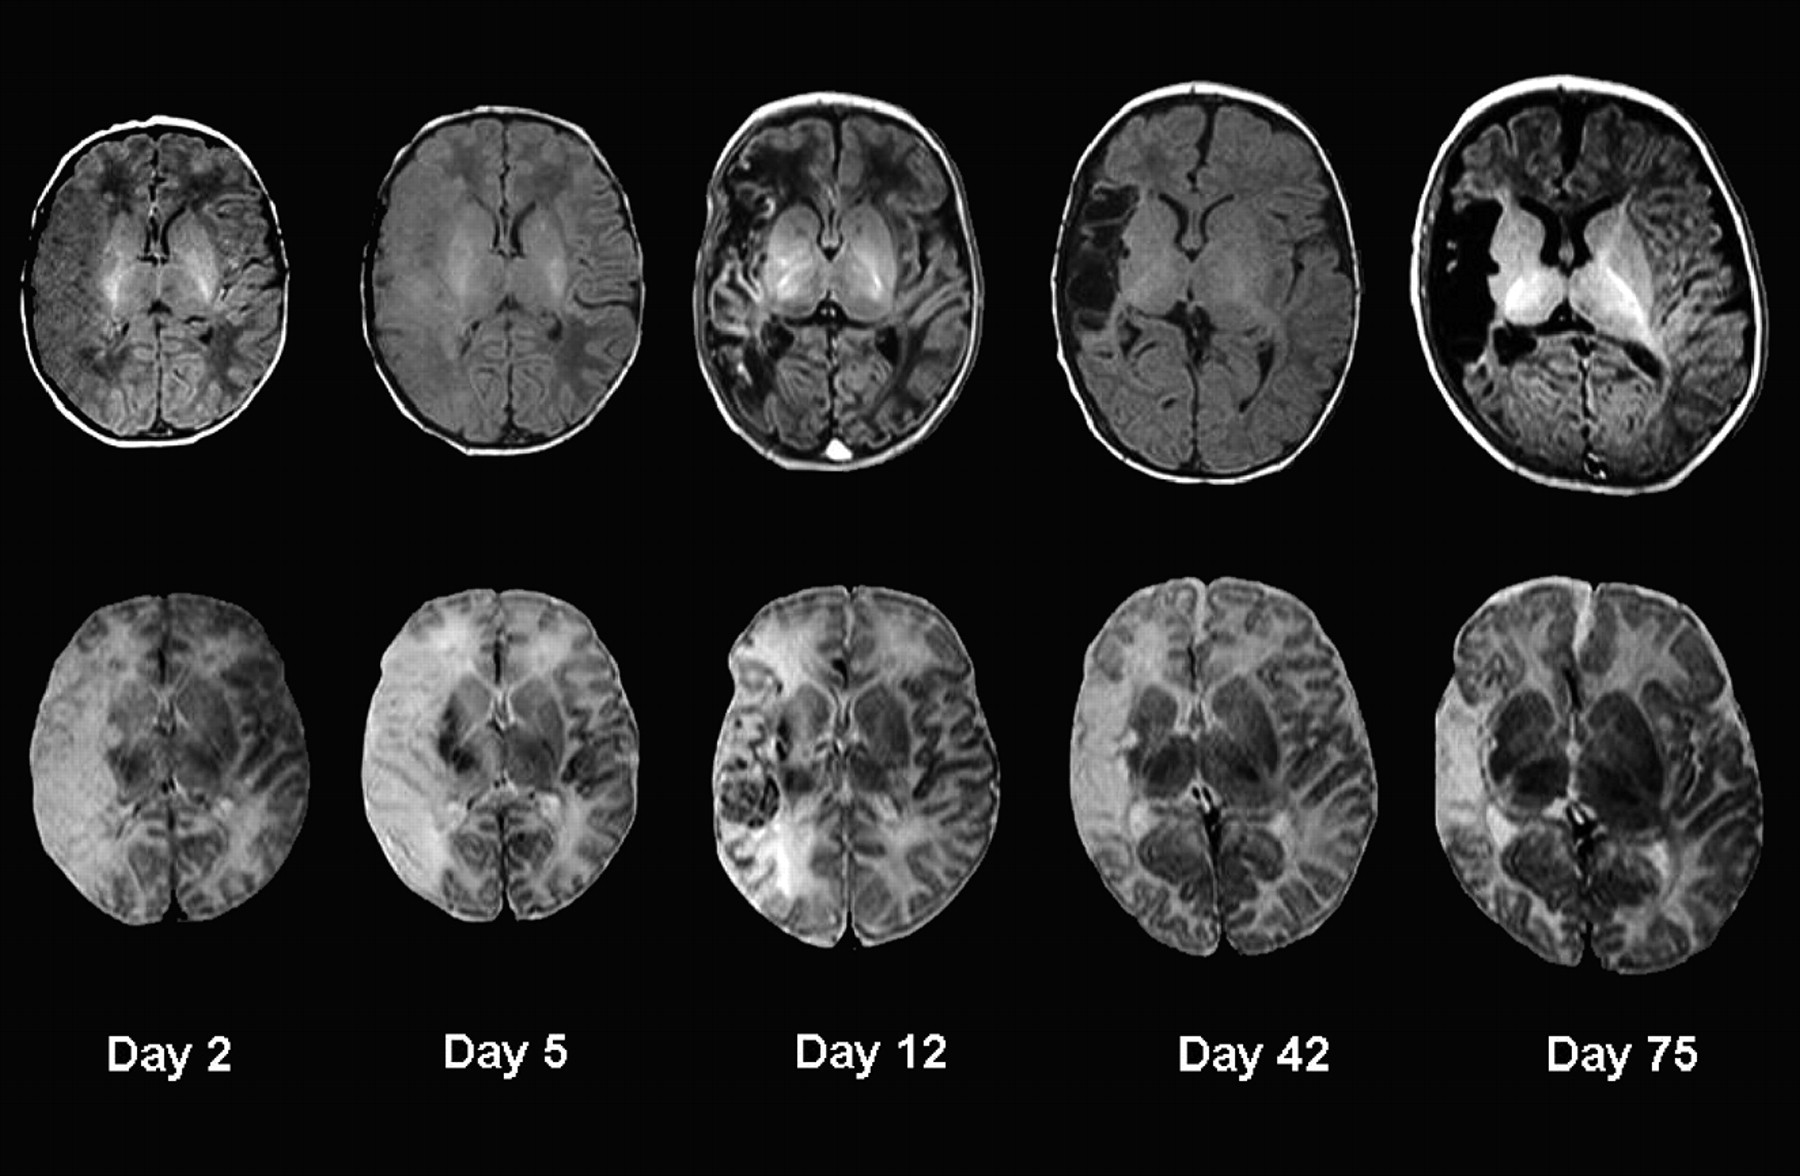
Images show the temporal evolution of a right-sided main branch MCA territory infarction (patient 1) on T1-weighted images (top row) and T2-weighted images (bottom row) obtained on days 2, 5, 12, 42, and 75 postdelivery.
T2-Weighted Imaging
On T2-weighted images, the cortex in the region of infarction was initially of high SI but became low SI after day 6. Loss of cortical tissue in the areas of infarction was seen from day 14 and was most marked after 1 month. During the period of 1–2 months of age, there was no difference in SI compared with the contralateral side in the remaining tissue (Fig 4). The white matter was of high SI on T2-weighted images until 2–3 weeks of age (Fig 5), when the SI of the remaining tissue became isointense with the contralesional side. Tissue atrophy often with cyst formation was evident after 1 month but started between 14 days and 1 month. The basal ganglia were of high SI in the first 4 days and became low SI from day 4 until day 7. From day 7 until day 14, we saw a checkerboard pattern, and after 1 month, atrophy or cysts were seen (Fig 3). During the study period, a higher SI was seen in the ipsilateral PLIC in 9 patients compared with the contralesional PLIC, suggesting abnormal myelination. In 5 patients, we saw high SI in the ipsilateral brain stem on the T2-weighted images in the first postnatal week. No SI differences were seen after 1 month. In 4 of these patients (infants 1, 5, 14, and 18) who had late scanning, ipsilateral brain stem atrophy presumed due to wallerian degeneration (a shrunken pyramidal tract at the mesencephalic level) was seen by 1 month of age. On both the T2-weighted images and DWIs, we saw high SI in the ipsilateral thalamus in the first postnatal week. These findings suggest acute corticothalamic network injury, showing secondary changes in distant nuclei and tracts associated with primary cortical or white matter injury (Fig 6).
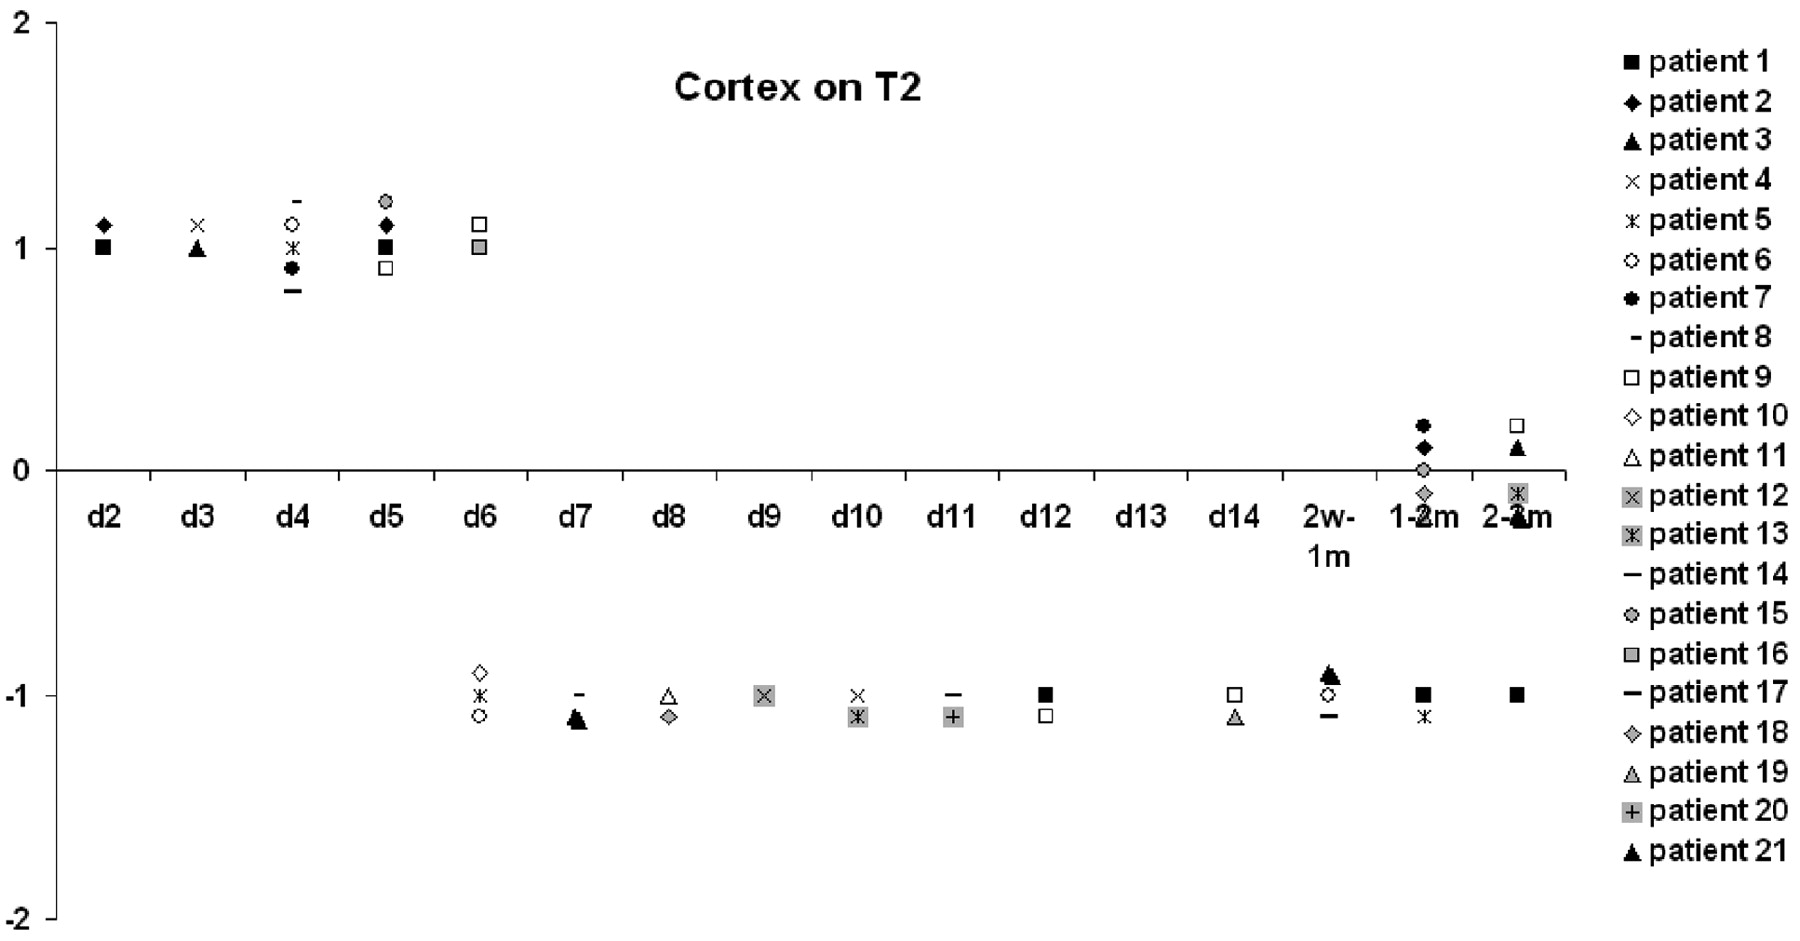
Graph shows the SI score (y-axis) of the infarcted cortex on T2-weighted MR images from each postnatal day (x-axis). d indicates day; w, week; m, month.

Graph shows the SI score (y-axis) of the infarcted white matter (WM) on T2-weighted MR images from each postnatal day (x-axis). d indicates day; w, week; m, month.

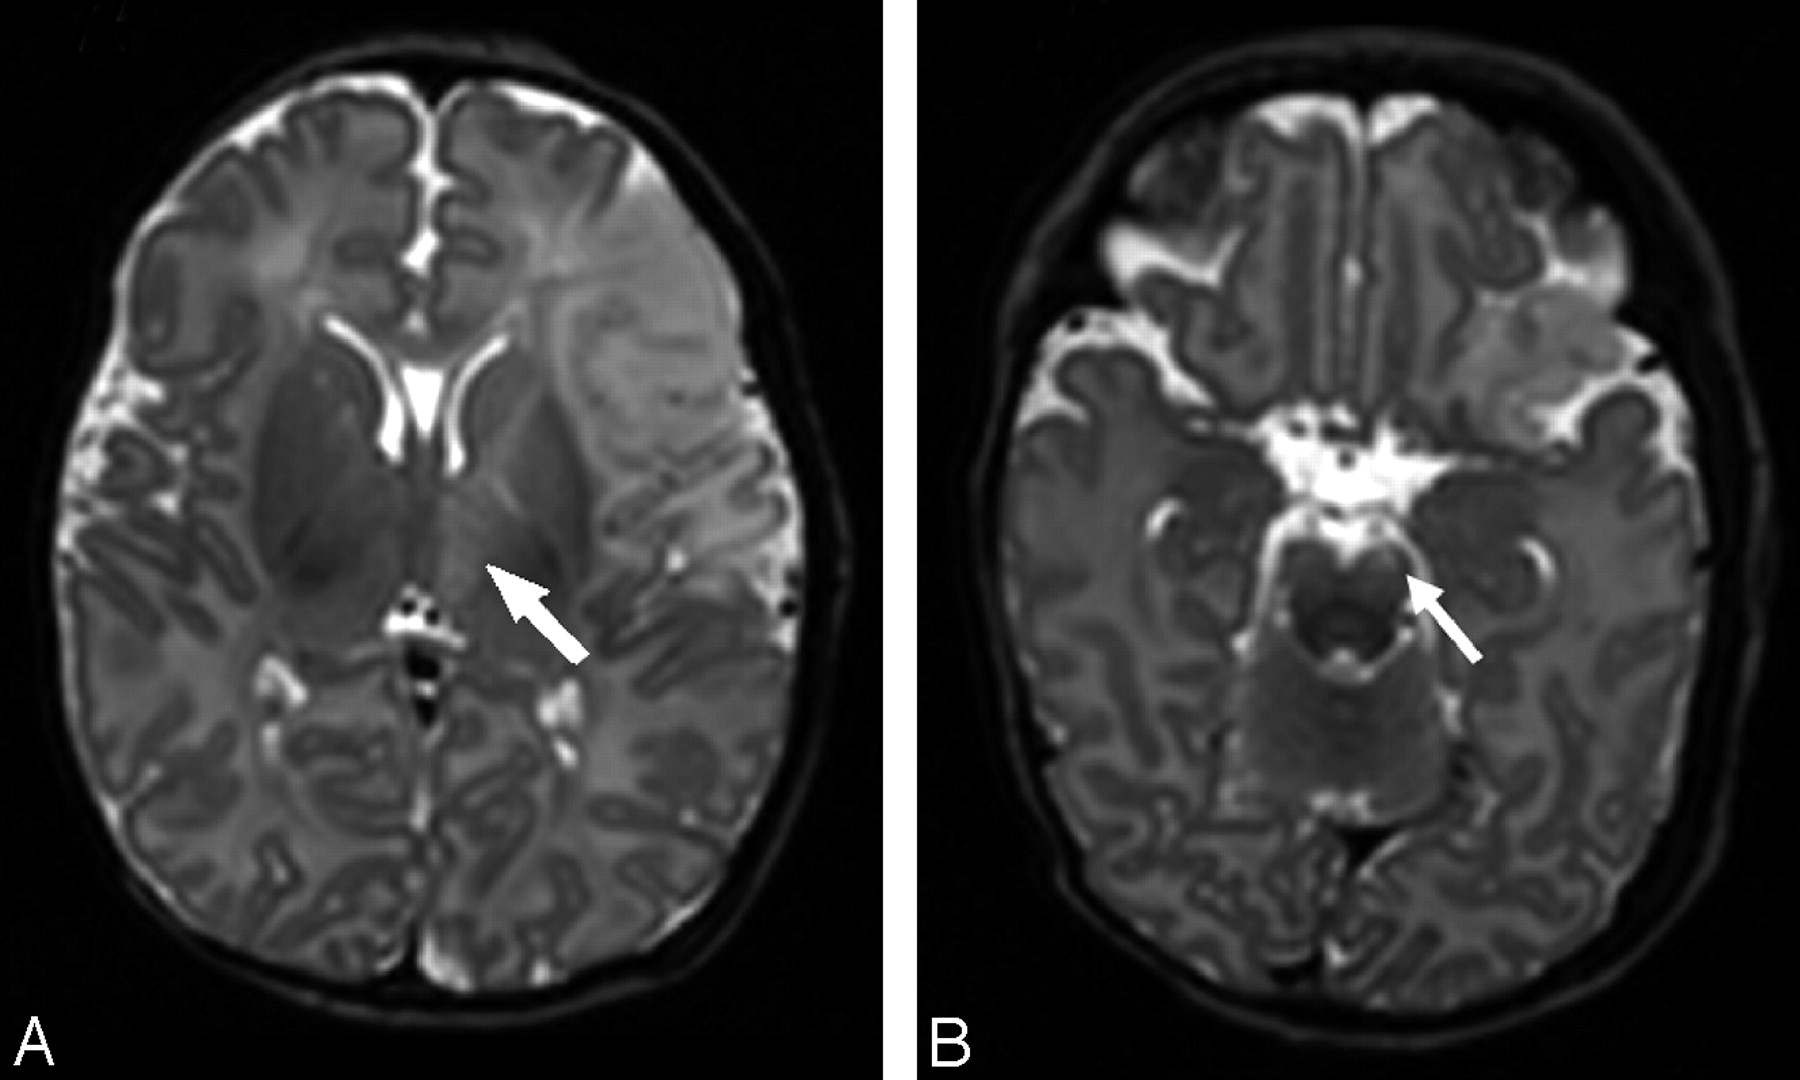
T2-weighted images of a patient with an infarction within the anterior MCA branch territory on day 5 (patient 15) show high SI changes within the ipsilateral thalamus (arrow, A) and the ipsilateral brain stem (arrow, B).
Cortical–White Matter Contrast and Stroke Borders
The evolution of changes in stroke-border recognition and contrast between white matter and cortex is described in Fig 7, where a composite of the scoring system for all infants is given. During the first 5 postnatal days, the infarcted cortex became increasingly isointense with white matter, increasing the definition of the margins of the infarct, with the affected cortex appearing absent (the “missing cortex” sign).9 Around day 6, SI in the cortex and white matter was more varied, making recognition of the stroke borders more difficult. After day 6, white matter and cortex contrast became sharper, rendering the borders visible. After 1 month, the combination of tissue loss (often with cysts) and slowly fading contrast between white matter and cortex made the borders again inconspicuous.

Graph shows the evolution of changes in stroke border recognition and contrast in white matter (WM) by using a composite of the scoring system.
DWI Findings
The results from DWI are summarized in Fig 8. All DWIs showed high SI in the white matter until day 4 after birth. Thereafter, the SI on DWI was lower, and all SIs were equal to or below those of the contralateral hemispheres by day 12. The extent of tissue involvement was usually the same on DWI and conventional images in the first week and seemed to be equal or less on the repeated DWIs. DWI changes tended marginally to overestimate the size of the infarct at 4–8 weeks. In the first week, the lesional SIs on DWIs were all higher than the SIs seen on T1- and T2-weighted images, making lesion contrast most apparent on the DWIs. Increased SI was clearly seen in parts of the ipsilateral thalamus in 5 infants on DWIs.

Graph shows the SI score (y-axis) of the infarcted tissue on DWIs from each postnatal day (x-axis). d indicates day. HSI indicates high SI.
Discussion
Our results demonstrate that the patterns of SI change on conventional imaging and DWI following PAIS were consistent among infants, suggesting that PAIS in our infants who were symptomatic soon after birth occurred within a limited timeframe around birth. Insights into the natural evolution of MR imaging characteristics of neonatal stroke are important for estimating the age of a lesion, especially when the time of symptom onset can be unclear. Knowledge of neonatal stroke evolution on MR imaging can also be used to interpret the results of medical intervention strategies and for determining optimal timing for imaging. Because, to our knowledge, the literature on radiologic timing of neonatal stroke onset in humans is limited, our data add to the understanding of the evolution of neonatal stroke. Because changes in MR imaging parameters reflect histopathologic changes in brain tissue, we will discuss how our findings relate to the literature on the histo- and pathophysiologic evolution of arterial ischemic stroke, most of which is based on adult and animal studies.
In our patients, SI increase on DWI consistent with restricted diffusion was seen within the infarcted area for up to 14 days but was most marked in the first 4 days. For all of the studied infants, the first DWI showed the highest signal intensity consistent with a recent insult (Fig 8). After ischemic arterial injury, energy depletion and impaired ion homeostasis cause cytotoxic edema with restricted diffusion of water and shrinkage of the extracellular compartment, translating into a high DWI SI.25,26 Postmortem studies have shown astrocytic swelling microscopically within 30 minutes after the onset of severe ischemia, and by 4–6 hours, swelling of oligodendroglial nuclei and cytoplasm is seen.27 DWI studies have shown changes in water diffusion within minutes after stroke in animals.28 Our DWI findings in the first week are consistent with those in the adult stroke literature on DWI SI evolution, in which acute ischemic lesions are characterized by very hyperintense SI and show little change in the first 7 days after symptom onset but decrease in SI thereafter (Fig 9).29,30 However in adult patients with stroke, the high SI is reported to last for several weeks.

Graph shows DWIs of a patient with an infarction within the PCA territory, showing severe HSI on day 3 (A) and mild-to-moderate HSI on day 10 (B).
DWI SI is not only influenced by water diffusibility but also by intrinsic T2 properties (T2 shinethrough) and field strength; this influence may contribute to the differences seen in DWI SI evolution between adults and neonates. The quantitative measure of DWI is the computed apparent diffusion coefficient (ADC), which is without the influence of T2 SI. Because the visual classification of the degree of hyper-SI can be difficult, quantifiable ADC maps have been useful in determining the age of ischemic lesions in several adult studies.29,31,32 The lowest ADC values in adult ischemic brain tissue seem to occur around day 3 after lesion onset and take 4–21 days for pseudonormalization.30–32 Because of our rather heterogeneous imaging datasets, we were not able to measure ADC values across the group.
In the first postnatal week (from day 2), T2-weighted images in our patients showed clearly increased SIs in the cortex and white matter. Once the blood-brain barrier is disrupted, vasogenic edema in combination with cytotoxic edema increases the overall water content in the infarcted tissue, which accounts for the prolonged T2 relaxation times, making the infarct readily visible on T2-weighted images between 24 and 48 hours after its onset.30 The visual disappearance of the cortical ribbon in the affected area during this stage represents the so-called missing cortex sign.20 Animal histology studies have shown that from 4 to 6 hours after the onset of stroke to approximately 6 days, damage to the endothelium and breakdown of the blood-brain barrier take place, associated with vasogenic edema and coagulation necrosis.27,28
On T1-weighted images, the affected cortex showed low SI in the first week from day 2. This SI is generally attributed to vasogenic edema. However, the white matter on T1-weighted images was of moderately higher SI than the white matter in the contralateral hemisphere in the first 9 postnatal days, though in the first 5 days when the cortex was of low SI, the overall impression was that the SI in the white matter was lower than that in the contralateral hemisphere. Whether cortical swelling is responsible for this appearance or whether there is actual shortening of the T1 relaxation time in white matter causing high SI on T1-weighted images during this period is unclear.
After approximately 1 week up to 1 month, we documented high SI in the cortex on T1-weighted images (cortical highlighting) and low cortical SI on T2-weighted images. From postmortem studies, this time period seems to coincide with organization within the infarction, a process that involves gliosis, release of myelin lipids, microcyst formation, calcification, and ingrowth of new vessels.27,33 It is an ongoing process, which, in adults, takes place from 3 days to 6 weeks. In postmortem studies, neuronal breakdown products can be seen microscopically in macrophages after day 5 in adults.27 Takana et al34 showed an increase in microglial cells, which changed to a form of lipid-laden phagocytes in rats subjected to focal brain ischemia on day 7. Aoe et al35 showed a clear correlation between T1 values and the number of microglia observed by using lectin staining. However, the high protein content and accumulation of manganese in reactive astrocytes have been suggested as being important in generating the SI changes on T1-weighted images.36
The low cortical SI on T2-weighted images is generally thought to be related to petechial hemorrhage, release of myelin lipids, or calcification.20 Around day 7, there is also evidence of newly formed capillaries. This neovascularization is most marked in gray matter. At the same time, the walls of the remaining blood vessels thicken.27 These vascular changes will also contribute to the cortical changes seen on the conventional images after the first postnatal week.
The areas of infarction evolved into areas of tissue loss and cysts after 1–2 months following an intermediate variegated or checkerboard pattern of mixed high and low SI seen around 2–3 weeks.
Established wallerian degeneration of the ipsilateral corticospinal tract and secondary changes with reduction in size of the ipsilateral thalamus were seen in some of our patients after 1 month. These findings are in accordance with the adult and neonatal literature on secondary degeneration.37–39 SI changes in the ipsilateral cortical-spinal tracts remote from the region of infarction and in the ipsilateral thalamus were seen within the first week (Fig 6).
One of the limitations of our study is the use of the healthy hemisphere as an internal control. None of the infants were considered to have contralateral lesions or pathology on visual analysis of the scans. Trans-synaptic degeneration could cause network injury affecting the contralesional hemisphere, making a case for using healthy term controls in future studies. The visual scoring system we used is practical in a clinical setting; however, for research purposes, relatively new but more time-consuming postprocessing techniques such as automatic segmentation will give more objective measurements of SI and volume change.40
On the basis of the mechanisms that can lead to arterial occlusion and known perinatal risk factors, the arterial occlusion in our patients could have taken place during 3 periods: 1) in later labor, 2) the intrapartum period, and 3) shortly after delivery, each period reflecting different risks factors.13,20,41,42 In this study, we could not differentiate these periods. All infants underwent labor, none being born by prelabor cesarean delivery. In most infants, labor was complicated in that delivery was only spontaneous in 6 infants and the second stage of labor was prolonged (lasted ≥2 hours) in 9 women. No fetus had had problems recorded before the onset of labor; and as is most usual for term-born infants with PAIS, none had low Apgar scores or presented with symptoms of global hypoxia-ischemia immediately after birth. Abnormal DWI SI in our patients was always most marked on the first scan, and the SI started to diminish after 4–6 postnatal days; extrapolating from the adult and animal literature, we believe this would support the onset of the stroke close to the time of birth. We saw consistent change in SI on DWI and conventional images in the first week, with the infarct always being seen even on T1-weighted images on the first scan, suggesting that the infarcts had occurred at least 1–2 days before the first imaging. This further supports the interpretation of our data to indicate that the stroke occurred within a limited timeframe around or during delivery.
Future interventional studies and medicolegal issues will require an even more detailed study of the temporal evolution of PAIS. Prospective studies with serial scanning (including quantitative diffusion tensor imaging) in combination with continuous electroencephalography monitoring and detailed clinical histories might provide this.
Conclusions
The pattern of SI change on conventional images and DWIs following PAIS was remarkably consistent among patients, suggesting that PAIS in symptomatic term-born infants occurs close to the time of birth.
Acknowledgments
We thank the nursing, medical, and radiographic staff members who were involved in scanning, the parents who consented for their children to take part in the studies, and the consultant colleagues who referred infants.
Footnotes
This work was supported by the National Institute for Health Research Biomedical Research Centre Funding Scheme, Philips Medical Systems (Best, the Netherlands), the Medical Research Council, the Academy of Medical Sciences, and the Health Foundation.
References
- Received October 12, 2008.
- Accepted after revision December 1, 2008.
- Copyright © American Society of Neuroradiology


