
Abstract
BACKGROUND AND PURPOSE: On clinical MR images, the subthalamic nuclei (STN) are poorly delineated from adjacent structures, impeding safe direct targeting for placement of electrodes in the treatment of Parkinson disease. Susceptibility-weighted MR phase imaging offers improved contrast and spatial resolution at reduced imaging times relative to clinically used T2-weighted spin-echo imaging for STN visualization. Our purpose was to assess STN visibility by using phase imaging, comparing phase and magnitude images obtained concurrently by using susceptibility-weighted imaging (SWI). The goal was to identify an efficient scanning protocol for high-quality phase images of STN.
MATERIALS AND METHODS: Seventy-eight SWI scans were acquired at 3T by using different TEs and acceleration factors. STN visibility and delimitation from adjacent structures were scored from 0 (not interpretable) to 5 (excellent). Regression analyses assessed the relationship of STN visibility to scanning parameters
RESULTS: STN were identified at all studied TEs on phase images. Visibility and delimitation of STN were consistently superior on phase images compared with magnitude images. Good visualization (score of ≥4) of STN on phase imaging occurred at a mean TE of 20.0 ms and a sensitivity encoding (SENSE) of 1.40. Scores of STN visualization on phase images were dependent on SENSE (P < .002) and TE (P < .031). Good delimitation of the STN on phase imaging occurred at a mean TE of 21.6 ms and a SENSE of 1.36.
CONCLUSIONS: Visualization and delimitation of STN was superior on phase images and was achieved at 3T in <2.5 minutes. A TE of 20 ms and an acceleration factor of ≤1.5 are recommended to visualize STN by using this method,.
Motor symptoms of therapy-refractory Parkinson disease (PD) can be alleviated by deep brain stimulation (DBS) targeting the subthalamic nuclei (STN).1 The stereotactic procedure of placing electrodes into the STN is performed in 3 steps: statistical planning via identification of anatomic landmarks, direct targeting by visualizing the nuclei with MR imaging (Fig 1), and intraoperative electrophysiologic verification.2 A reliable direct targeting of the STN with clear identification of their shape and location could eliminate the third step and dramatically shorten the procedure (presently, 6–8 hours). None of the currently available methods achieve sufficient delimitation of the STN, and improvement of imaging techniques remains of great interest.
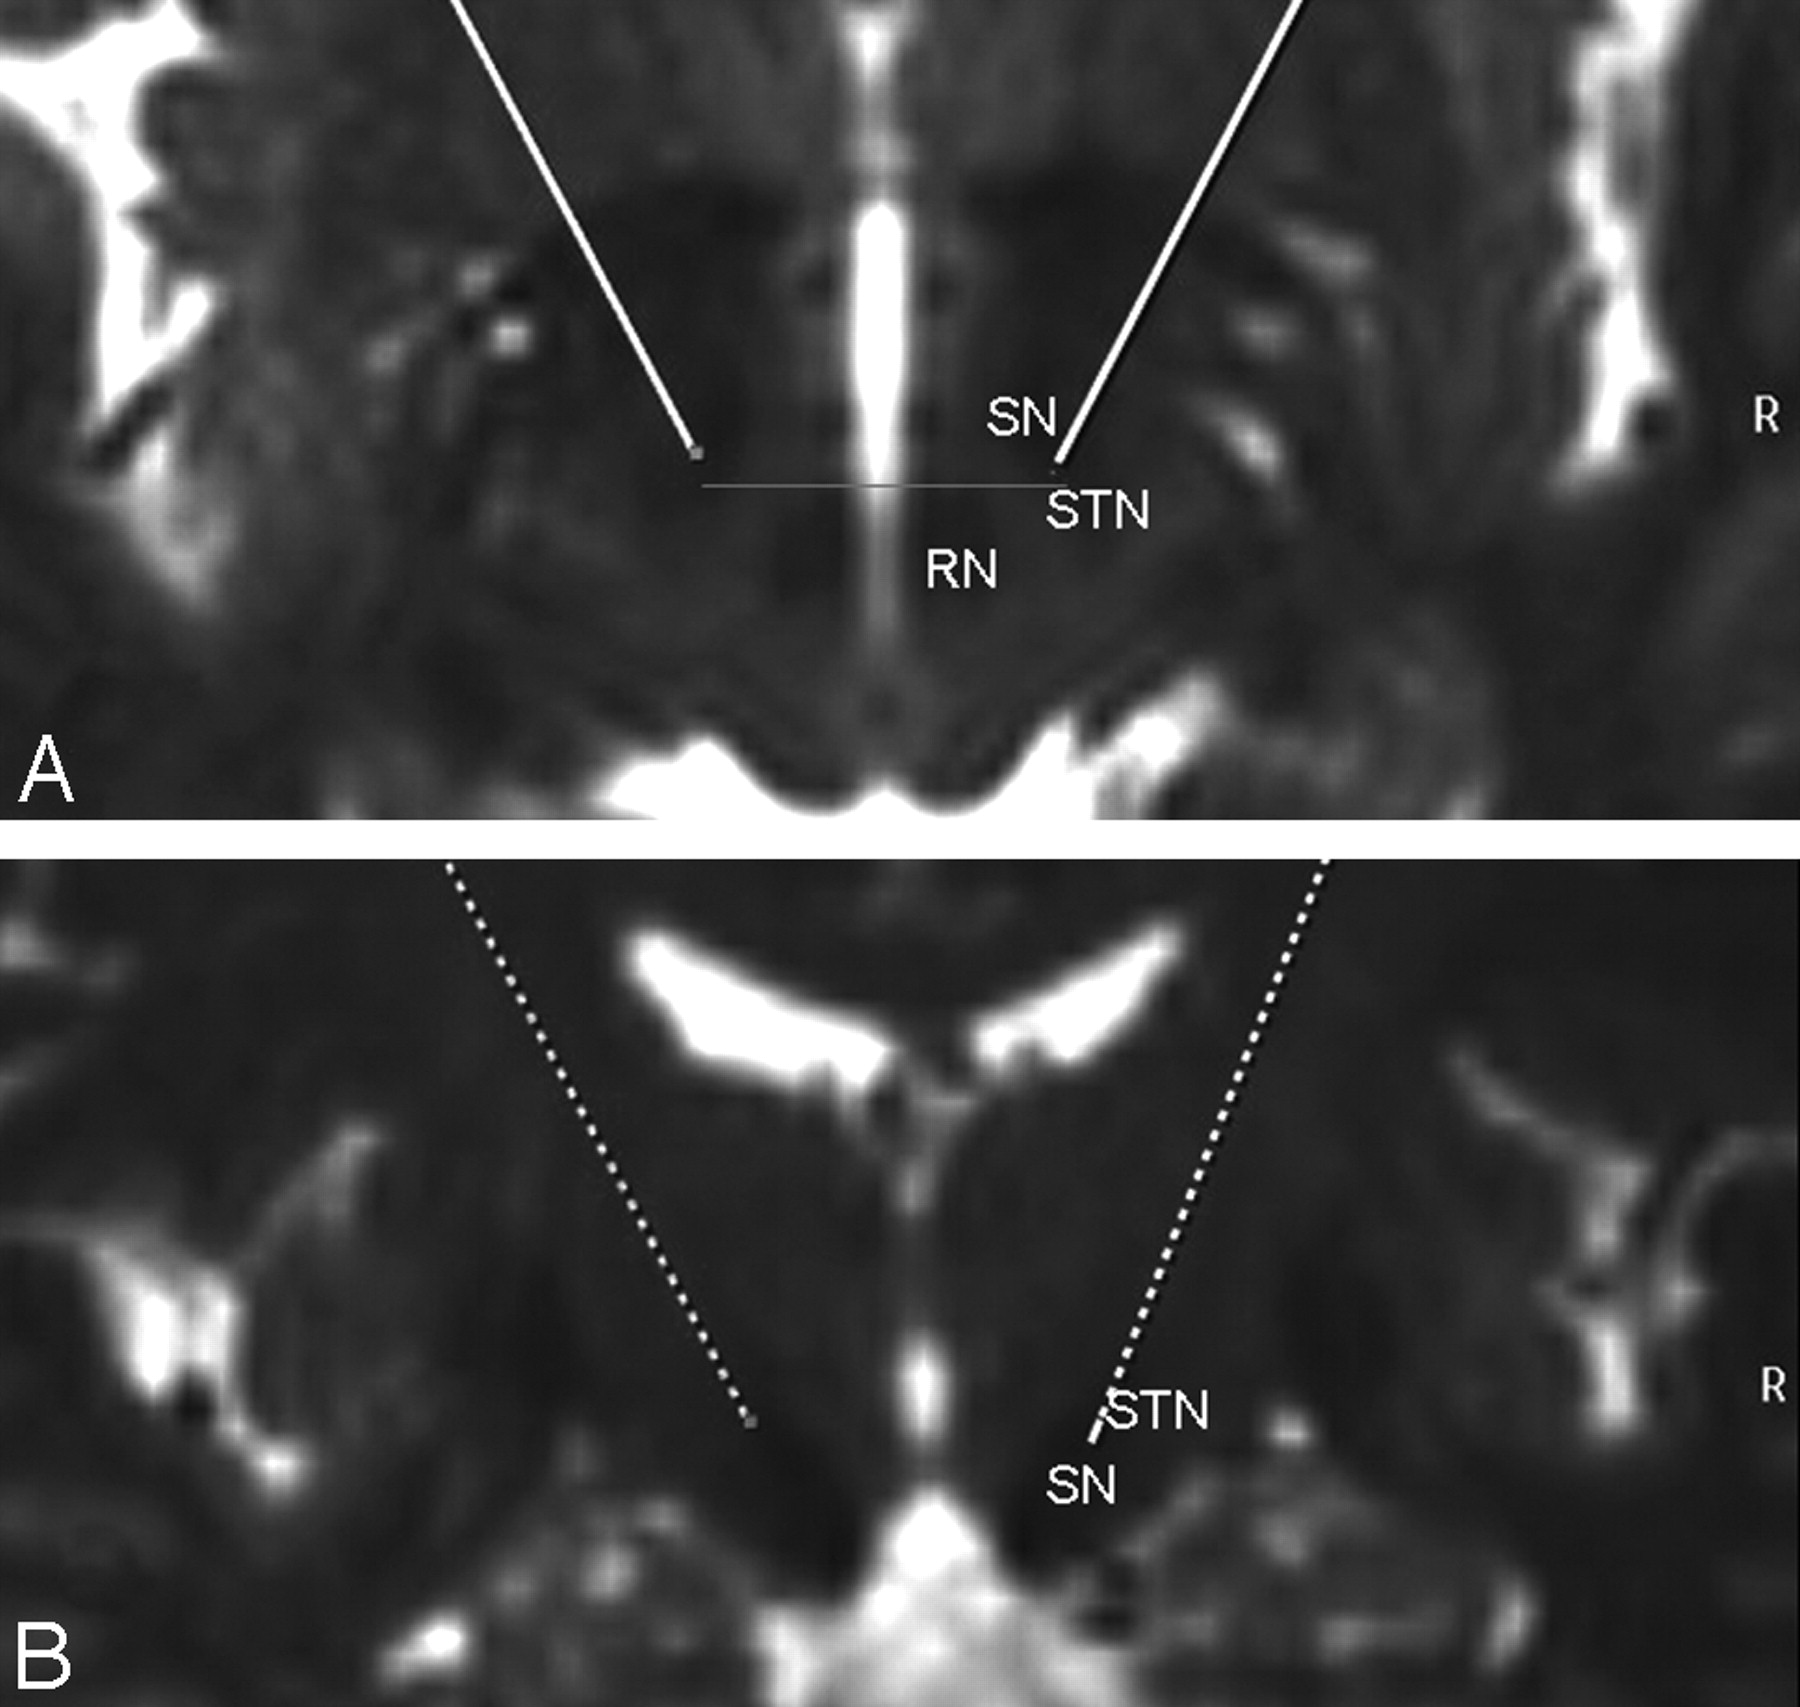
Typical T2-weighted axial (A) and coronal (B) depiction of the target region for STN DBS in a 71-year-old woman with PD. The target point is the lateral hypointensity at the anterior border of the RN (gray line) in the section with the largest diameter of the RN.
Direct visualization of the STN is currently partially achieved by using heavily T2-weighted imaging (eg, turbo spin-echo [TSE]), which exploits the high iron content of the basal ganglia,3,4 particularly the STN, as a source of image contrast. Unfortunately, this method has relatively long acquisition times of approximately 5 minutes and is only a 2D method with relatively thick sections. Fast short inversion recovery, which provides higher image contrast but lower spatial resolution, can provide complementary information to T2-weighted imaging TSE (T2WI-TSE) particularly for determining the inferior margin of the STN. This still requires an imaging time similar to a TSE acquisition and is inferior to T2WI-TSE in other respects.5 Given that T2*-weighting is more sensitive to local iron deposits than T2-weighting, gradient-echo imaging has recently been proposed6 as an imaging method that offers the potential for better identification of the full extent of the STN and could improve differentiation of the STN from the adjacent substantia nigra (SN).
Susceptibility-weighted imaging (SWI), a variant of T2*-weighted imaging, exploits the magnetic susceptibility differences of tissues. It uses a 3D velocity-compensated gradient- echo sequence.7–9 The magnetic susceptibility of iron causes both accelerated signal-intensity decay due to T2* shortening and increased resonance frequency. The latter causes spins to accumulate a phase offset during the period between excitation and sampling at TE, providing an additional contrast mechanism to visualize cerebral anatomy in detail.10 Using postprocessing techniques, a single SWI acquisition can generate 3 sets of inherently coregistered images: T2*-weighted maps of signal-intensity magnitude, phase images, and a combination of the two.7,8 The magnitude images are similar to traditional T2*-weighted gradient-echo images, but with greater susceptibility weighting and higher spatial resolution. In contrast to the magnitude images, which are sensitive to field inhomogeneities, the phase images are also sensitive to offsets in field strength and provide contrast complementary to the magnitude images.11 Combined maps reflect both the magnitude and phase characteristics of the imaged tissue and have also been referred to as “venograms,”7 due to exquisite depiction of vessels containing deoxyhemoglobin. The phase images are of particular interest because they bear information not readily visible on magnitude images11 and have an improved signal intensity–to-noise ratio (SNR) compared with the corresponding magnitude images.12
The purpose of the present study was to assess the visibility and delimitation of the STN by using phase imaging with varying scan parameters (TE and acceleration factor), to compare phase images with the more commonly used magnitude images, and to identify a time-efficient SWI protocol to acquire high-quality images of the STN.
Materials and Methods
The study was approved by the institutional clinical research ethics board. All MR imaging studies were performed with the understanding and full written consent of each subject.
Data Acquisition
Data of 8 healthy volunteers (3 women, 5 men; 22–60 years of age) were acquired on a 3T system (Achieva; Philips Medical Systems, Best, the Netherlands) by using a 6-channel phased-array head coil. Each volunteer was scanned during a single 1-hour session with an imaging protocol that included localizer images and a calibration scan followed by T2-weighted TSE imaging. SWI was performed multiple times with varying scanning parameters. All subjects underwent a total of 12 SWI scans per session, except for 1 subject with 7 scans and 1 subject with 11 scans.
SWI scans with an FOV of 240 × 167 × 54 mm3 and a matrix of 436 × 320 × 36 (voxel size = 0.55 × 0.75 × 1.5 mm3) were acquired after second-order shimming. The parameter space investigated for SWI consisted of different TEs (12.5, 16.1, 20.7, and 25.3 ms), with the corresponding shortest possible TRs of 24, 29.4, 33.7, and 37.7 ms, respectively, and acceleration factors of 1, 1.5, and 1.8 for partial parallel imaging by using sensitivity encoding (SENSE).13 The readout bandwidth was between 70 and 80 Hz per pixel. Acquisition times ranged from 88 seconds (TE = 12.5, SENSE = 1.8) to 262 seconds (TE = 25.3, SENSE = 1).
The flip angle was adjusted to the Ernst angle of gray matter at 3T for each TR, with values ranging from 13° to 16°. Standard T2-weighted TSE scans were acquired with the following parameters: TR = 3900 ms, TE = 120 ms, matrix = 256 × 188, 30 sections, FOV = 230 × 183 × 90 mm3, acquisition time = 1.43 minutes. All scans were acquired in the transaxial plane, parallel to the anterior/posterior commissure (ACPC) line as determined on sagittal scout images (Fig 2) and had coverage from the level of the cavernous sinuses/superior cerebellum to the top of the lateral ventricles.

Sagittal, coronal, and axial T2-weighted images centered at the level of the STN. The ACPC line is defined on the sagittal image where the anterior and posterior commissures can be delineated and a line can be drawn through them as shown. The axial images are acquired parallel to the ACPC line, and the coronal images are perpendicular. The black lines on the sagittal and coronal images show the corresponding position and orientation of the axial image. The black line on the axial image shows the corresponding position on the coronal image. The relative orientation and borders of the RN, SN, and STN are outlined.
Postprocessing
The SWIs were reconstructed to a voxel size of 0.45 × 0.45 × 0.75 mm by zero-filling in all 3 directions. The phase was unwrapped by using the freely available ΦUN package.14 High-pass filtering was performed on the unwrapped phase images by subtracting a low-pass filtered unwrapped phase image from the original unwrapped phase image.15 Low-pass filtering was performed by smoothing with a 2D boxcar averaging kernel of 9.45 × 9.45 mm2. To obtain a uniform dynamic range, we computed the inverse tangent of the unwrapped and filtered phase.
The combined magnitude/phase mask images were computed according to standard SWI processing.16 From the high-pass filtered-phase images, a positive phase mask was computed and applied iteratively 4 times to the corresponding magnitude images.16 Maps of field inhomogeneities, ΔB, were derived from the phase difference, Δφ, between the 2 shortest TEs according to ΔB = Δφ / γΔTE..17 From these maps and the readout bandwidth given in units of fat-water ΔrFW shift in pixels, the geometric distortions were estimated according to Δr [pixels] = ΔrFW [pixels] ΔB [Hz] / 440 [Hz], where 440 Hz is the difference in resonance frequency at 3T between fat and water.
Qualitative Evaluation
A neuroradiologist and a neurosurgeon blinded to the imaging parameters assessed and rated the images in consensus for the following variables: 1) delimitation of STN and the surrounding tissues (particularly the SN anterior, inferior, and medial to the STN); and 2) STN visualization, which took into account not only the visibility and sharpness of both the STN and red nuclei (RN) but also the overall image quality and perceived artifacts. These 2 parameters were rated on a 6-point scale from zero (nondiagnostic, no delimitation) to 5 (excellent). The STN was defined on MR imaging as the hypointense structure lateral to the RN and cranial to the SN, on the basis of imaging atlases and prior MR imaging studies.18,19
Using this knowledge of the relative position of the STN to the RN and SN (Fig 2), the raters were able to determine the visibility of the STN and specified a good level of delimitation of the STN and SN if 2 centers of gravity of hypointensity could be identified around the expected nuclei. For visualization, scores of 5 referred to excellent image quality with sharp appearance of the RN and of a hypointense structure in the expected location of the STN. Ratings of 4 were given for good image quality with slightly less sharp image definition. Ratings of 3 were either not sharp or showed mild distortion of the structures of interest. Images rated 2 still showed the STN but were degraded by artifacts and were fuzzy and distorted. Images rated 1 barely depicted the RN and STN, and images rated 0 were completely degraded with artifacts with no identifiable structure in the expected location of the STN. For delimitation, scores of 5 reflected the ability to confidently identify 2 centers of gravity of hypointensity, with confidence of this delimitation decreasing with lower scores and with scores of zero showing no such variation (as is common in the standard T2WI-FSE images used in surgical planning).
Statistical Analysis
Mean rating scores of STN visibility and delimitation were compared among phase, magnitude, and combined images. Mean values and ranges of TE, acceleration factors, and acquisition times were calculated for phase, magnitude, and combined/venogram studies with scores of ≥4 for STN visibility. The same calculation was performed for phase, magnitude, and combined/venogram studies with respect to STN delimitation. Regression analyses for STN visibility and delimitation scores were performed for phase and magnitude images with TE and acceleration factor as the independent variables, accounting for clustering due to repeated measures in the same subjects.
Results
Scans from 1 volunteer were excluded from the study due to severe motion artifacts, leaving 78 SWI scans for analysis. Background field inhomogeneities near the STN were in the range of ≤50 Hz, giving rise to geometric distortions of <0.35 mm along the readout direction.
Qualitative Ratings
The qualitative ratings are summarized in the Table. Scores of STN visibility and delimitation on phase images were superior in all cases. STN visibility scores on combined/venogram images were intermediate to phase and magnitude images. Magnitude images typically scored zero or 1 for delimitation of the STN with no values >3. No scans received a score of >4 for delimitation of the STN. All scans with good delimitation of the STN on phase images also had good or excellent visualization.
Mean scores of visualization and delimitation for phase, magnitude, and combined images and parameters producing good visualization and delimitation
Regression Analyses
Regression analyses showed that scores of visualization of the STN on phase images were dependent on both SENSE (P < .002, r = −0.76) and TE (P < .031, r = 0.07) in the range of values investigated. Scores of visualization on magnitude images, however, were dependent on TE (P < .05, r = 0.13) but not on SENSE (P = .148). Delimitation of the STN did not show significant dependence on TE or SENSE on either phase or magnitude images (P > .15).
Discussion
The hypothesis that iron in the STN is the source of signal-intensity hypointensity in T2-weighted images has been histologically confirmed,20 and the sensitivity of T2-weighted and T2*-contrast images has since been exploited to visualize the STN.6,21,22 Although SWI has previously been examined in the evaluation of the STN,22 this is the first study specifically using the phase maps (rather than magnitude or combined images) of high-resolution gradient-echo imaging to directly visualize the STN and showing that phase images are superior to magnitude and combined images for STN visualization and delimitation (Fig 3).

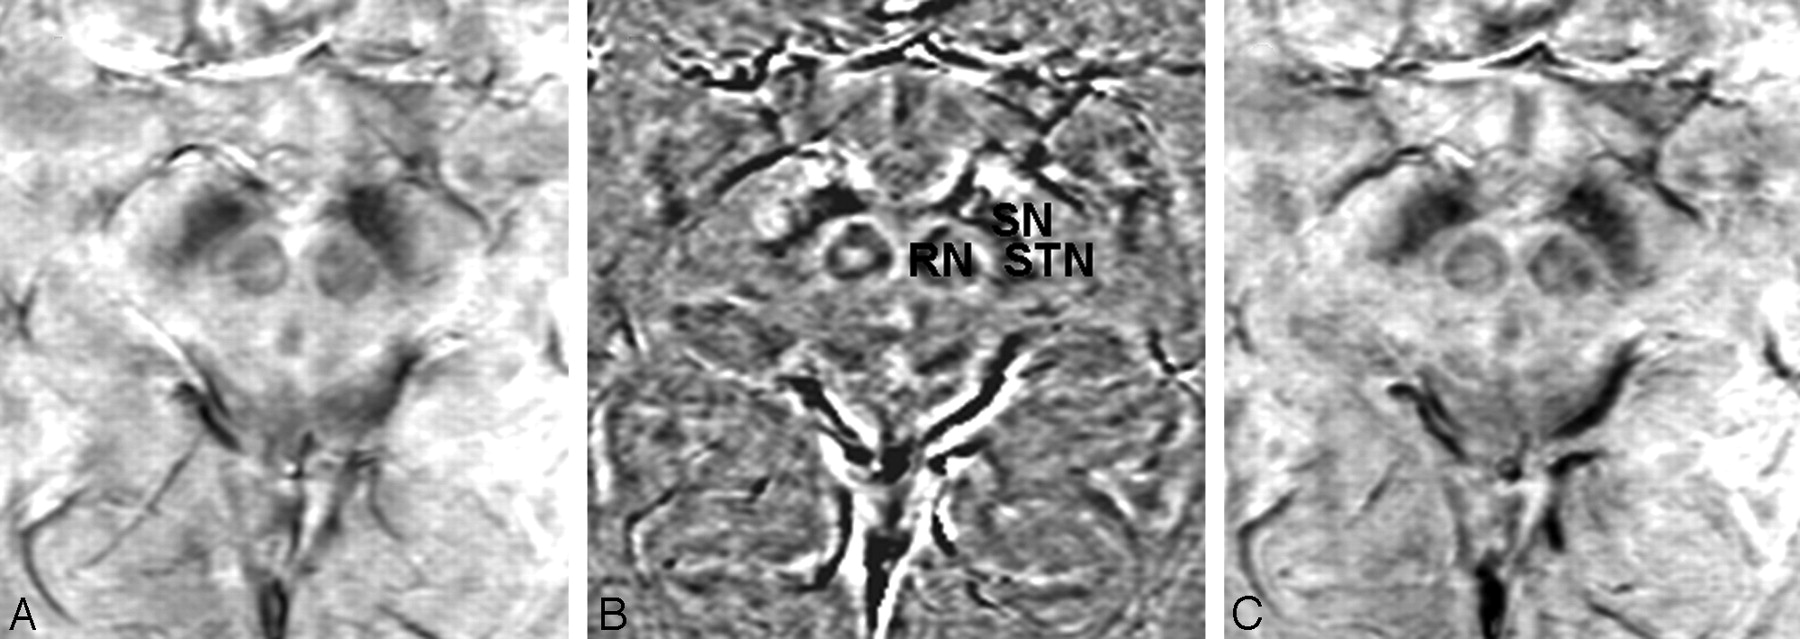
Magnitude (A), phase (B), and combined/venogram (C) images from the same SWI sequence acquisition. The STN, SN, and RN are most sharply delineated on the phase image.
This study focused on TE and acceleration factor, the 2 parameters that provide the greatest trade-off between image quality and acquisition time in SWI. TE is important because it determines T2*-weighting in the magnitude and contrast in the phase images. Shorter TE results in faster data acquisition but also in reduced contrast. Moreover, phase and magnitude images may not require the same TE for good tissue contrast. As expected, TE was shown to influence STN visualization on magnitude and phase images, with good contrast achieved at a lower TE for phase than for magnitude images (Fig 4). Our findings are in agreement with a recent study using T2*-weighted imaging in which good magnitude contrast was achieved with a TE of 20 ms6 but at a lower spatial resolution. They are also in agreement with the initial results of a study conducted at 3T, in which the visualization of the STN in the combined images was investigated for TEs from 30 to 50 ms.22

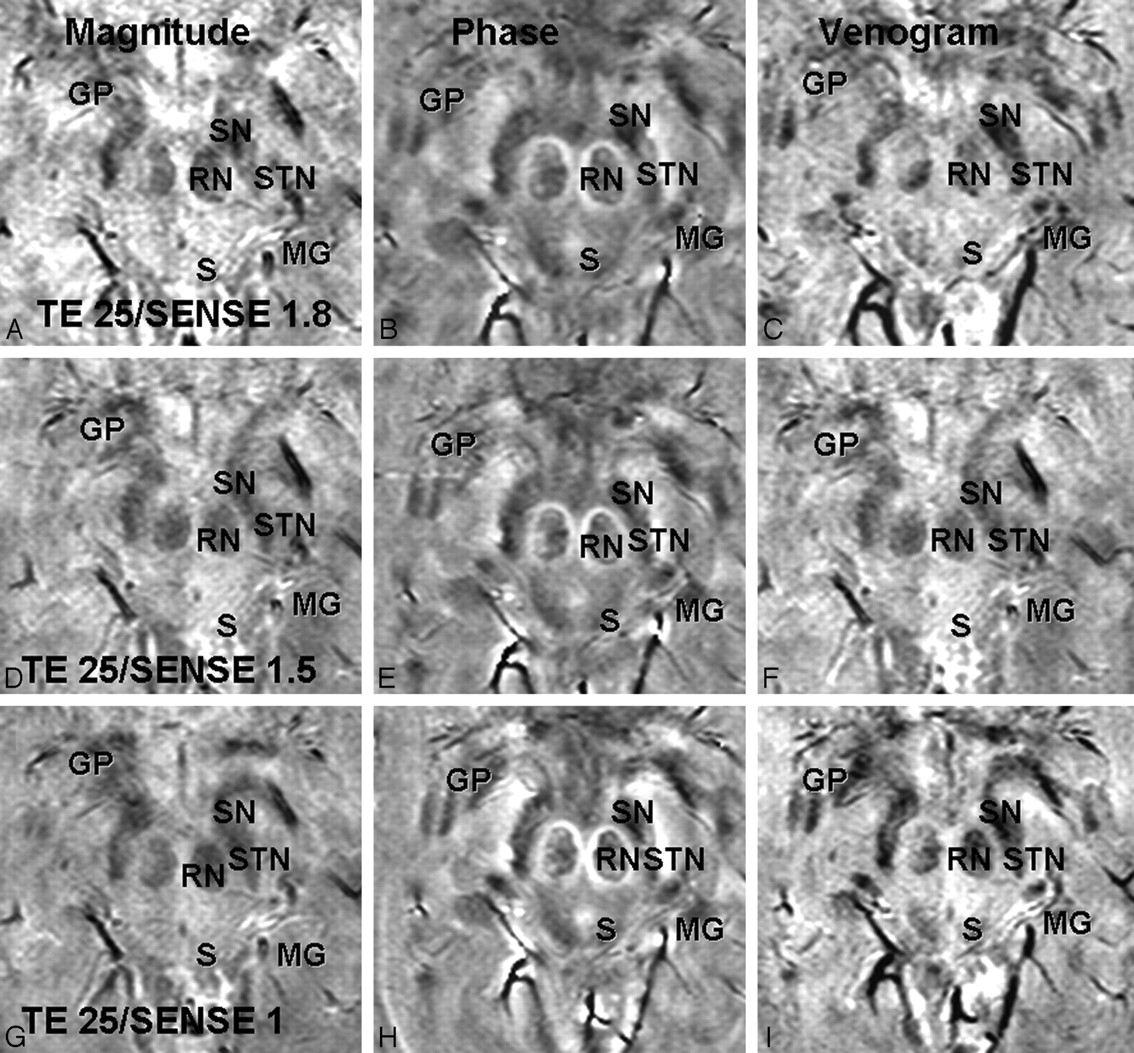
Magnitude (A, D, G), phase (B, E, H), and combined/venogram (C, F, I) images are shown with an acceleration factor of 1 and TEs of 16.11 ms (A–C), 20.7 ms (D–F), and 25 ms (G–I). On phase images, the STN, SN, RN, globus pallidus (GP), and medial geniculate body (MG) are shown with greatest contrast at a TE of 25.3 ms but still can be well seen at a lower TE. On magnitude images, these structures are less well visualized than on phase images at all TEs and are not well visualized below a TE of 25.3 ms. The venogram images are intermediate to phase and magnitude images at all TEs.
Increasing the acceleration factor reduces image acquisition time at the cost of SNR and should influence magnitude images more than phase images, which have been shown to have greater SNR.11 Our finding that the acceleration factor influenced STN visualization on phase but not on magnitude images was, therefore, unexpected. This may be due to the generally poor ratings for STN visibility in magnitude images at the lower TE values. At a higher TE (25 ms), worse image quality on magnitude images with an increased SENSE factor (Fig 5) was observed.
Magnitude (A, D, G), phase (B, E, H), and combined/venogram (C, F, I) images are shown with acceleration factors of 1.8 (A–C), 1.5 (D–F), and 1 (D–F). At a TE of 25 ms, worse image quality is observed as the SENSE factor is increased, particularly on the magnitude images. The STN, SN, RN, globus pallidus (GP), superior colliculus (S), and medial geniculate body (MG) are seen best on the phase images at a SENSE of 1.0 but are relatively well depicted on phase maps at all SENSE factors. Magnitude images, in particular, show decreasing sharpness of the RN, STN, and SN at SENSE factors of 1.5 and 1.8.
Optimization of imaging parameters for good STN visualization seems to be a requirement for good delimitation, though not sufficient to explain it. The delimitation may depend in part on subtle variations in subject anatomy and position that cannot be accounted for in an imaging study. The ability to delineate the STN from the SN was aided by the high spatial resolution of the images. On phase images with the highest quality, the STN were visible on at least 6 sequential images and the borders of the STN and SN could be distinguished by viewing the relationship of these structures on multiple sequential images and appreciating them as 3D structures (Fig 6). This is in contrast to the standard T2WI-TSE images, in which the STN is only seen on a single image.
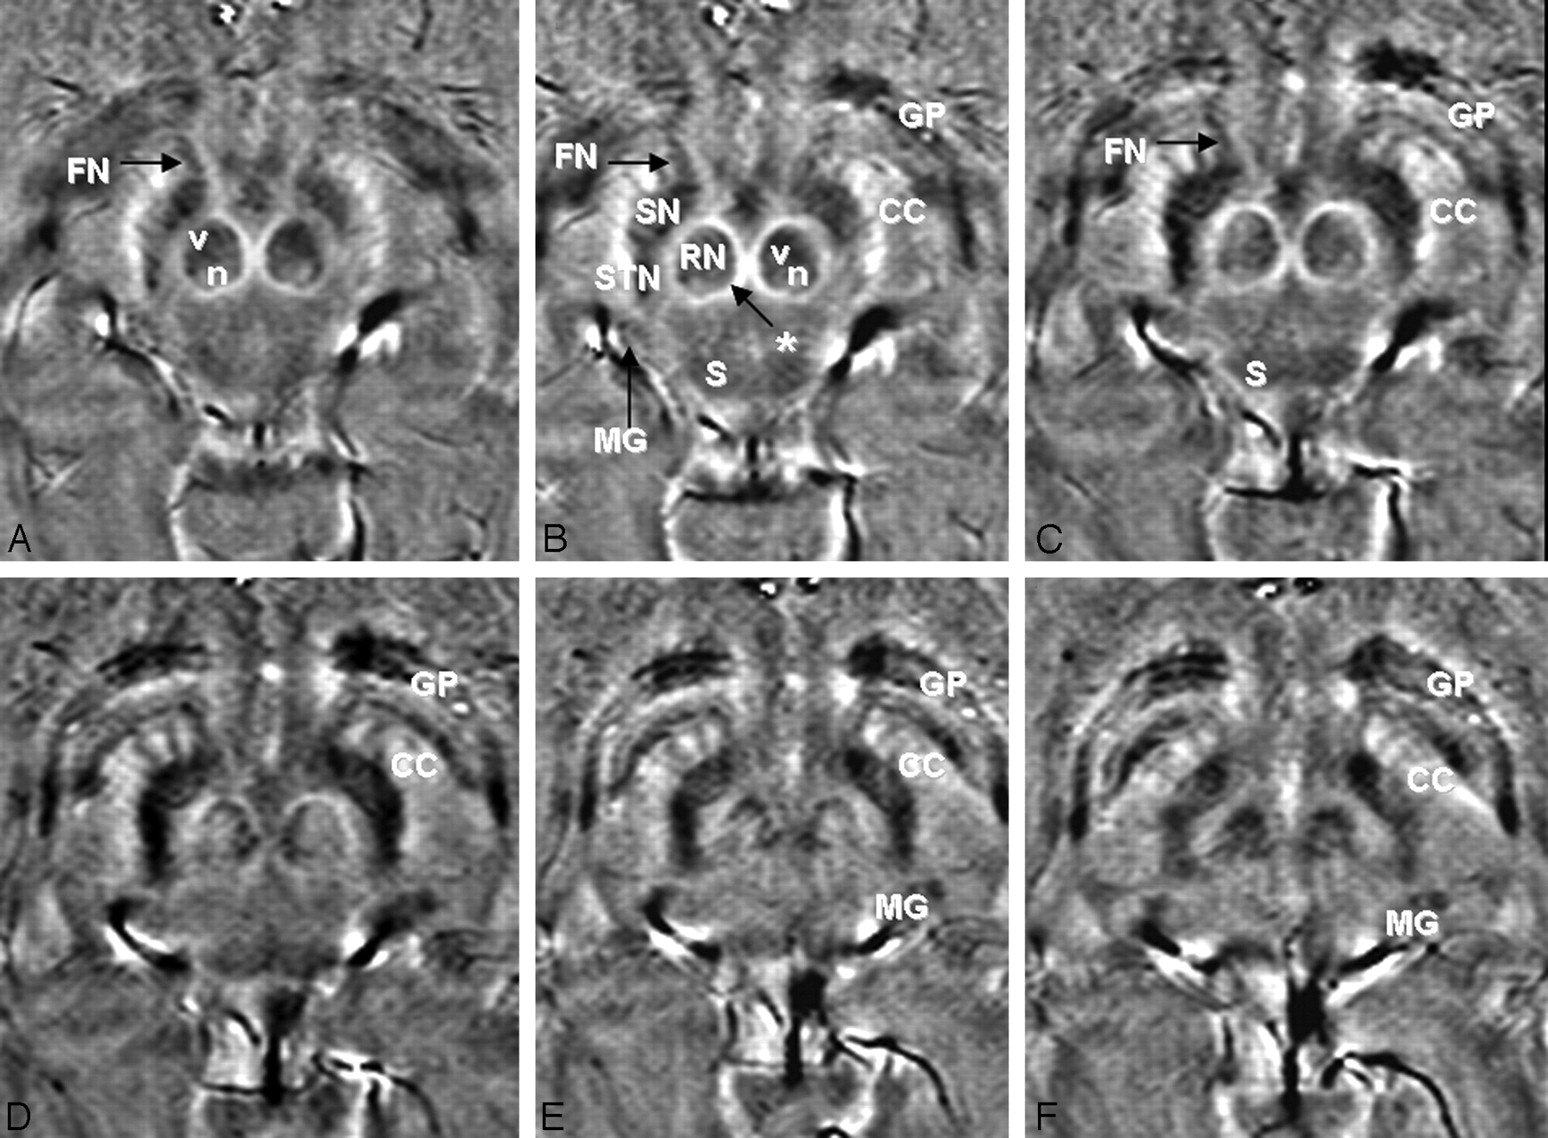
High-quality SWI phase images (subject 7, TE = 20.71 ms, SENSE = 1) rated “good” or “excellent” for both visualization of the STN and delimitation of the STN from adjacent structures (most important, the SN). The STN are visualized on at least 6 images from inferior (A) to superior (F). The STN, SN, and RN are labeled on image B. Other structures of interest that are visible on phase imaging are also labeled on B and on some of the other images where they are well delineated, including the vascularized (v) and nonvascularized (n) portions of the RN, capsule of the RN (asterisk), crus cerebri (CC), fascicula nigrale (FN), globus pallidus (GP), superior colliculus (S), and medial geniculate body (MG).
The problem of differentiating SN and STN arises because of the proximity of the structures. It has been shown that the ACPC plane angulation can have significant influence on depiction of the STN region.23,24 Typically, the T2 hypointense area lateral to the RN (Fig 2) consists of the STN more posteriorly and laterally and the SN more medially and anteriorly.18,19 With increased and individual ACPC inclination, more and more of the SN contributes to this hypointensity.
Coronal imaging can improve STN delimitation, providing more consistently high scores.23 In this study, we chose to evaluate phase imaging in the ACPC plane, given that calculation of the statistical target for STN deep brain stimulation (DBS) as the step before an adjustment to an individual patient's T2 anatomy is based on the establishment of an ACPC reference system. To demonstrate the feasibility of assessing the SWI phase images in 3 planes, we rescanned 1 subject with TE = 20 ms and SENSE = 1 (FOV = 240 × 95.9 × 167.4 mm, matrix = 344 × 259, 137 sections, voxel size = 0.7 × 0.7 × 0.7 mm3, acquisition time = 361 seconds) (Fig 7). This longer protocol allows proper coronal reconstructions, and we were able to confirm findings from the axial images in the coronal plane. The STN was best visualized in the axial (ACPC) plane of phase images, and the coronal image plane was most useful in confirmation of the orientation of the STN and SN.

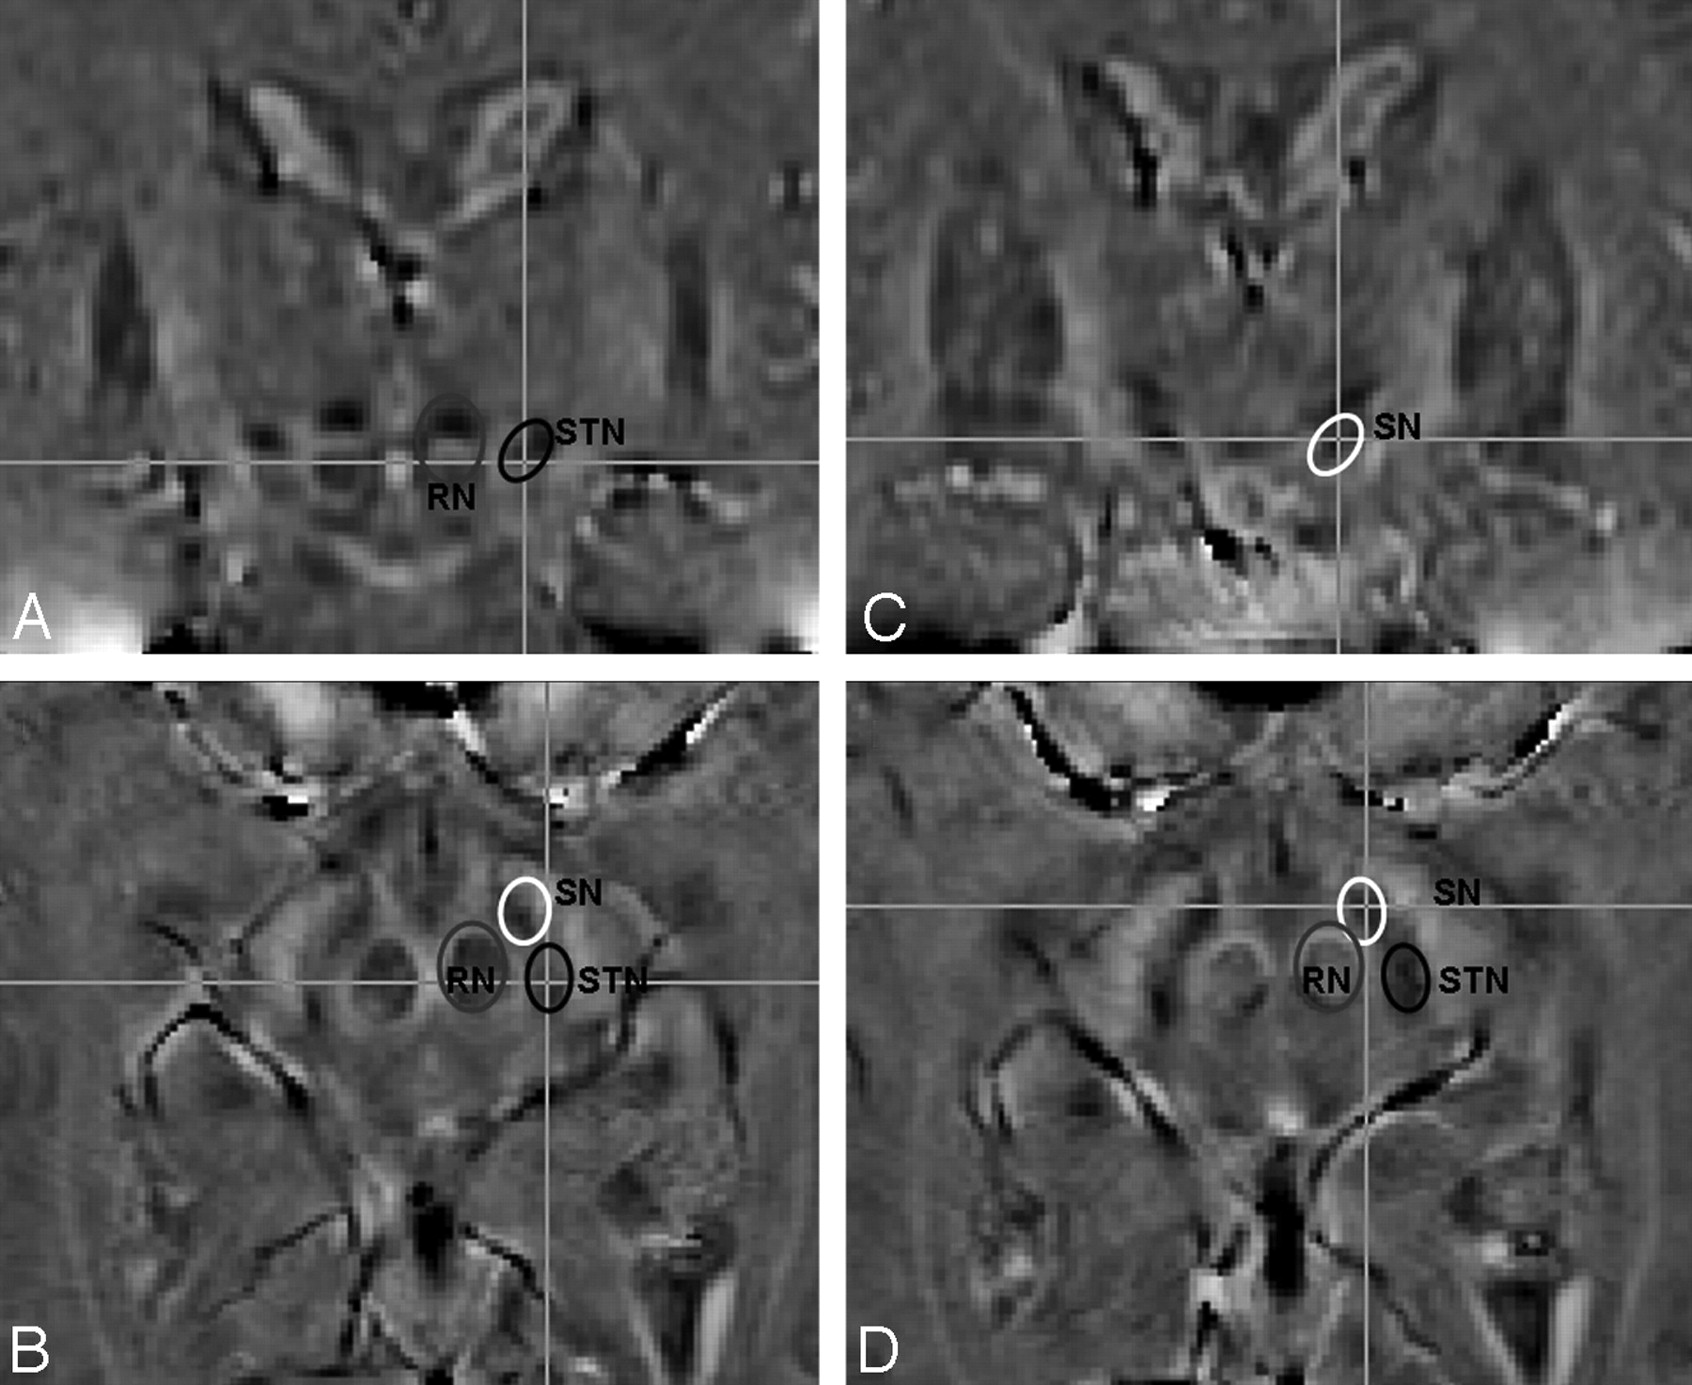
3D axial SWI phase images were obtained with isotropic voxels (TE = 20 ms, SENSE = 1, voxel size = 0.7 × 0.7 × 0.7 mm, acquisition time = 6 minutes). Lines on the coronal images A and C correspond to section planes of axial images B and D, respectively, and vice versa. The RN, SN, and STN are encircled and labeled on each image and are each demonstrated in 2 planes.
We imaged healthy volunteers. Even better image contrast may be obtained in patients with PD who may have increased iron content associated with PD25 and with the typically higher age of the patients compared with our volunteers.3 In clinical practice, motion in patients with PD may also be an issue. To demonstrate the feasibility of the proposed SWI phase protocol in the clinical setting, we scanned 3 patients with PD with SWI (TE = 20 ms, SENSE = 1, acquisition time = 3.5 minutes) and achieved good phase image quality in all 3 (Fig 8).

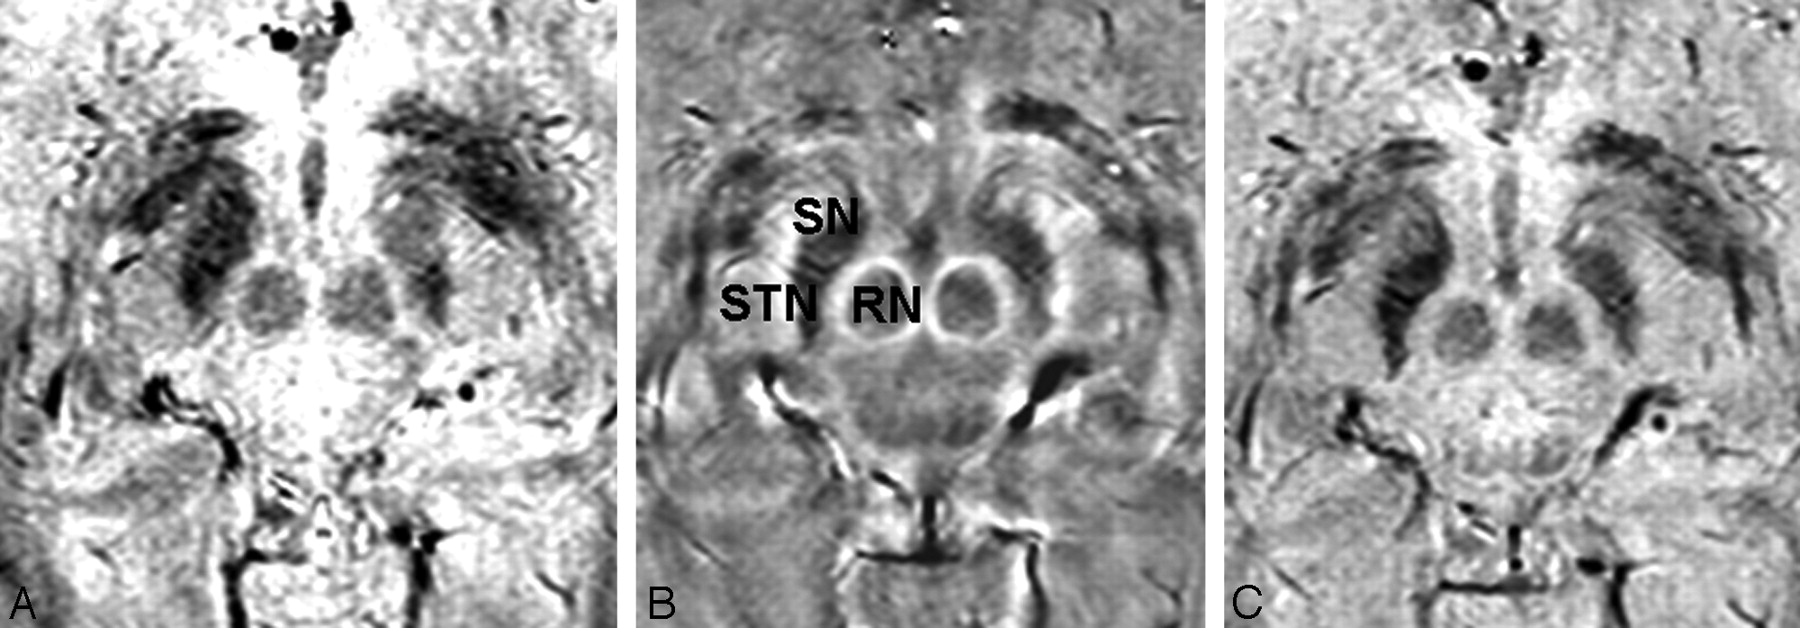
Magnitude (A), phase (B), and combined/venogram (C) images from the same SWI sequence acquisition (TE = 20, SENSE = 1, acquisition time = 3.5 minutes) in a patient with PD (right-handed man, 73 years of age). The STN, SN, and RN are labeled on the phase image.
Although the STN is well visualized on phase images, the anatomic accuracy of the approach must be proved. In all imaging studies evaluating the STN, an apparent structure of interest and its targeting could still lead to poor results without validation by microelectrode recording during surgery.24 During STN DBS surgery, which is a tripartite procedure as described in the introduction, the neurosurgeon places the definite DBS electrode (typically with a 7.0-mm active tip, 1.3-mm diameter, 4 contacts of 1.5-mm length, and 0.5-mm intercontact distance) in the anterior lateral and superior STN.23 Good direct targeting sequences today provide approximately 2.0 mm of placement accuracy (though the isotropic resolution of the image is higher, often 0.6–1.5 mm at 3T). Although contrast and SNR are high in these images, the STN region (depending on the scanner) might be spatially displaced as confirmed with electrophysiology.24 Moreover, more than the pure anatomic ideal position of the electrode itself, the electrical characteristics of the brain tissue surrounding the electrode characterize its optimal position. In this respect, direct targeting alone with the current standard sequences will lead to an electrode positioning within 2 mm of the ideal target area.
During surgery, for additional accuracy and clinically sufficient positioning, electrophysiology is needed. In approximately 50% of all cases, an initially planned trajectory (direct targeting) has to be left because of the results of microelectrode recording and macrostimulation (step 3); the latter simulates the postoperative beneficial clinical effects.23 Electrophysiology is needed to compensate for a lack of delimitation of the STN and a lack of spatial accuracy in conventional sequences. Macrostimulation in this respect might prove to be indispensable in the operative setting, though it will be dramatically shortened if the ideal trajectory can be reached in a single step. Microelectrode recording, however, taking 60 minutes in a bilateral procedure in experienced hands, might become superfluous. A better direct targeting, depending on differentiation of the STN from the SN (as done in this article) and correct spatial geometric accuracy (in future studies), will help to reach the target area directly and might omit the time-consuming step of microelectrode recording and its evaluation. This indicates the need for improved direct-targeting MR images that allow better delimitation of the STN and high spatial accuracy at the same time. Only then will new sequences help to shorten the surgical procedure of STN DBS.
Conclusions
Good visualization of the STN was achieved by SWI phase images at 3T by using a TE of 20 ms and acceleration factors of <1.5 for the acquisition of high-resolution images in stereotactic orientation in <2.5 minutes. Visualization of the STN in 3D with phase imaging by using isotropic voxels is possible but at a longer scanning time of 6 minutes. This new technique may shorten STN DBS surgery time by approximately 1–2 hours by eventually omitting the cumbersome and time-consuming step of microelectrode recording and its evaluation during electrode placement. However, although SWI proves to be superior in delineating STN boundaries with the studied technique, its geometric accuracy should be proved before this step can be safely eliminated.
Footnotes
Dr. Coenen is recognized as an equal contributing author.
Previously presented in part at: Annual Meeting of the International Society for Magnetic Resonance in Medicine, May 3–9, 2008; Toronto, Ontario, Canada.
This work was supported by the Parkinson Society Canada and the Michael Smith Foundation for Health Research. Dr. Coenen received a stipend of the Wilhelm Toennis Foundation from the German Society of Neurosurgeons.
References
- Received February 27, 2009.
- Accepted after revision April 13, 2009.
- Copyright © American Society of Neuroradiology
In this issue


Jump to section
Related Articles
Cited By...
- No citing articles found.