
Abstract
BACKGROUND AND PURPOSE: Neuromyelitis optica (NMO) is an idiopathic mostly relapsing inflammatory disease with attacks on the optic nerves and spinal cord. Whether NMO is a separate disease or a subtype of classic multiple sclerosis (MS) is unclear. Clinically, CSF and MR imaging parameters and histopathologic data suggest that the normal-appearing white matter (NAWM) may be affected in MS but not in patients with NMO. Therefore, we hypothesized that the NAWM in NMO is normal.
MATERIAL AND METHODS: We studied prospectively 8 patients with clinically definitive NMO or remitting longitudinal extensive transverse myelitis (LETM) and 8 healthy controls. Ratios of N-acetylaspartate to creatine (Cr) and choline to Cr and the absolute concentrations of the metabolites were measured by chemical shift imaging with a 1H-MR spectroscopy operating at 3T. All patients with clinically definitive NMO and LETM were found to be positive for NMO−immunoglobin G with a commercially available test.
RESULTS: The metabolic pattern of the NAWM of patients with NMO showed no difference compared with age- and sex-matched healthy controls.
CONCLUSIONS: Diffuse white matter damage is absent in NMO.
Neuromyelitis optica (NMO) is a relapsing inflammatory demyelinating disease of the central nervous system (CNS) of unknown origin.1 NMO is characterized by severe attacks on the optic nerves and spinal cord.1 Other areas of the CNS are usually not or, if ever, much less affected.1 Whether NMO is a subtype of multiple sclerosis (MS) or a separate disease is still debated.1–3 However, NMO can be distinguished from classic relapsing-remitting MS (RRMS) by clinical, laboratory, pathologic, and MR imaging findings and by therapy response.1,4–9 In contrast to RRMS, the optic nerves and spinal cord seem to be the main predilection sites of inflammatory attacks in NMO.4,6 Spinal cord lesions are usually large, extending over ≥3 vertebral segments.4 Typical RRMS brain lesions are usually absent in patients with NMO.4
Only a few patients with NMO develop typical MS brain lesions in long-term follow-up,1 and in contrast to MS, NMO only very seldom follows a secondary-progressive course.10 Moreover, in MS subtle diffuse axonal damage with reduced N-acetylaspartate (NAA) levels may be found in the normal-appearing white matter (NAWM) in very early disease stages.11,12 1H-MR spectroscopy is sensitive to metabolic alterations and allows an in vivo assessment of subtle metabolic changes within the NAWM.12–14
Signals of NAA, creatine (Cr), and choline (Cho) can be well quantified with 1H-MR spectroscopy. NAA is almost exclusively found in the active mitochondria of neurons and axons and thus is a marker of axonal function and integrity.15 Reduced levels of NAA indicate axonal degeneration or axonal loss in white matter lesions or neuronal damage distant from the areas of investigation.16 Thus, discrete metabolic changes within the NAWM, which may be caused by silent ongoing inflammation, may be detected by 1H-MR spectroscopy.13,14
The quantification of the metabolite concentration is usually based on the metabolite signal-intensity ratio to Cr. However, the concentration of Cr may vary in various pathologic conditions.17 This problem can be solved by the acquisition of water signal intensity from the respective region and by using this as an internal concentration reference.17 Furthermore, the improvements in the 1H-MR 2D spectroscopic imaging (MRSI) allow robust quantification of the respective signals in large regions of the brain simultaneously.17
We hypothesized that NAA levels of the NAWM of NMO do not differ from those of controls. For this purpose, we applied spatially resolved MRSI operating at 3T. Concentrations of metabolites were quantified in relation to each other as well as in respect to the concentration of internal tissue water of well-defined regions of NAWM.
Materials and Methods
Subjects
The study was approved by the local ethics committee. Before the study, written informed consent was obtained from all patients and volunteers.
Eight patients with clinically definite NMO4 or remitting longitudinal extensive transverse myelitis (LETM)4 and 8 healthy volunteers were included. Additionally, all patients with NMO/LETM were found to have positive findings on a commercially available test for NMO−immunoglobin G (IgG).5,18 All patients with NMO were carefully observed, including by the use of close meshed controls of NMO-IgG antibody titers and MR imaging from the brain and spinal cord.18,19 Clinical relapses were also verified by the presence of contrast media−enhancing lesions in respective locations (Table).19 A complete survey of our patients with NMO and controls is provided in the Table 1.
Clinical data of patients with NMO and controls
MR Imaging and MR Spectroscopy
MRSI at a magnetic field strength of 3T was performed to assess the metabolic pattern in the NAWM. MRSI measurements were performed parallel to axial T1- and T2-weighted sections. Routine automatic adjustments were applied before data acquisition. A point-resolved spectroscopy sequence was used for the rectangular voxel of interest selection (8 × 8 × 1 cm) in the frontoparietal white matter well above the lateral ventricles. Special care was taken to avoid skull and subcutaneous tissue contamination. A chemical shift selective saturation sequence was used for water suppression. Sequence parameters included the following: TR/TE, 1500/135 ms; 16 × 16 elliptic weighted phase-encoding steps across a 16 × 16 cm FOV; section thickness of 1 cm; 50% Hanning filter; and 3 averages. To obtain an internal quantification reference, we performed additional scanning with the same timing and geometric parameters without water suppression. The total acquisition time of the spectroscopic sequences was <15 minutes.
Quantification of the spectra was performed off-line in the time domain by using the jMRUI software package.20,21 Signals from voxels (8–12 voxels per patient) matching exclusively frontal white matter without any signs of lesion load on conventional T2-weighted images were selected. For the processing of metabolite spectra, the remaining water signal intensity was removed by using a Hankel-Lanczos singular value decomposition filter, and amplitudes of Cho, Cr, and NAA signals were calculated with appropriate prior knowledge by using the advanced method for accurate, robust, and efficient spectral fitting.22,23 The amplitude of water signal intensity for each processed voxel was assessed from the scan without water suppression.
Concentrations of metabolites are given as ratios of signal intensities of NAA to Cr, NAA to Cho, and Cho to Cr, respectively. Additionally, absolute concentrations of Cho, Cr, and NAA were calculated by using water signal intensity from the voxel identical to the internal reference. Monoexponential spin-lattice and spin-spin relaxation were assumed, and published values of T1 and T2 relaxation times of water and respective metabolites measured at 3T in the NAWM of healthy volunteers were used for relaxation corrections.24,25
Statistical Analysis
For statistical analysis, nonparametric tests (Mann-Whitney U test, Kolmogorov-Smirnov) were applied (Statgraphics Plus; http://www.statgraphics.com/statgraphics_plus.htm). All tests were classified as significant if the P value was < .05.
Results
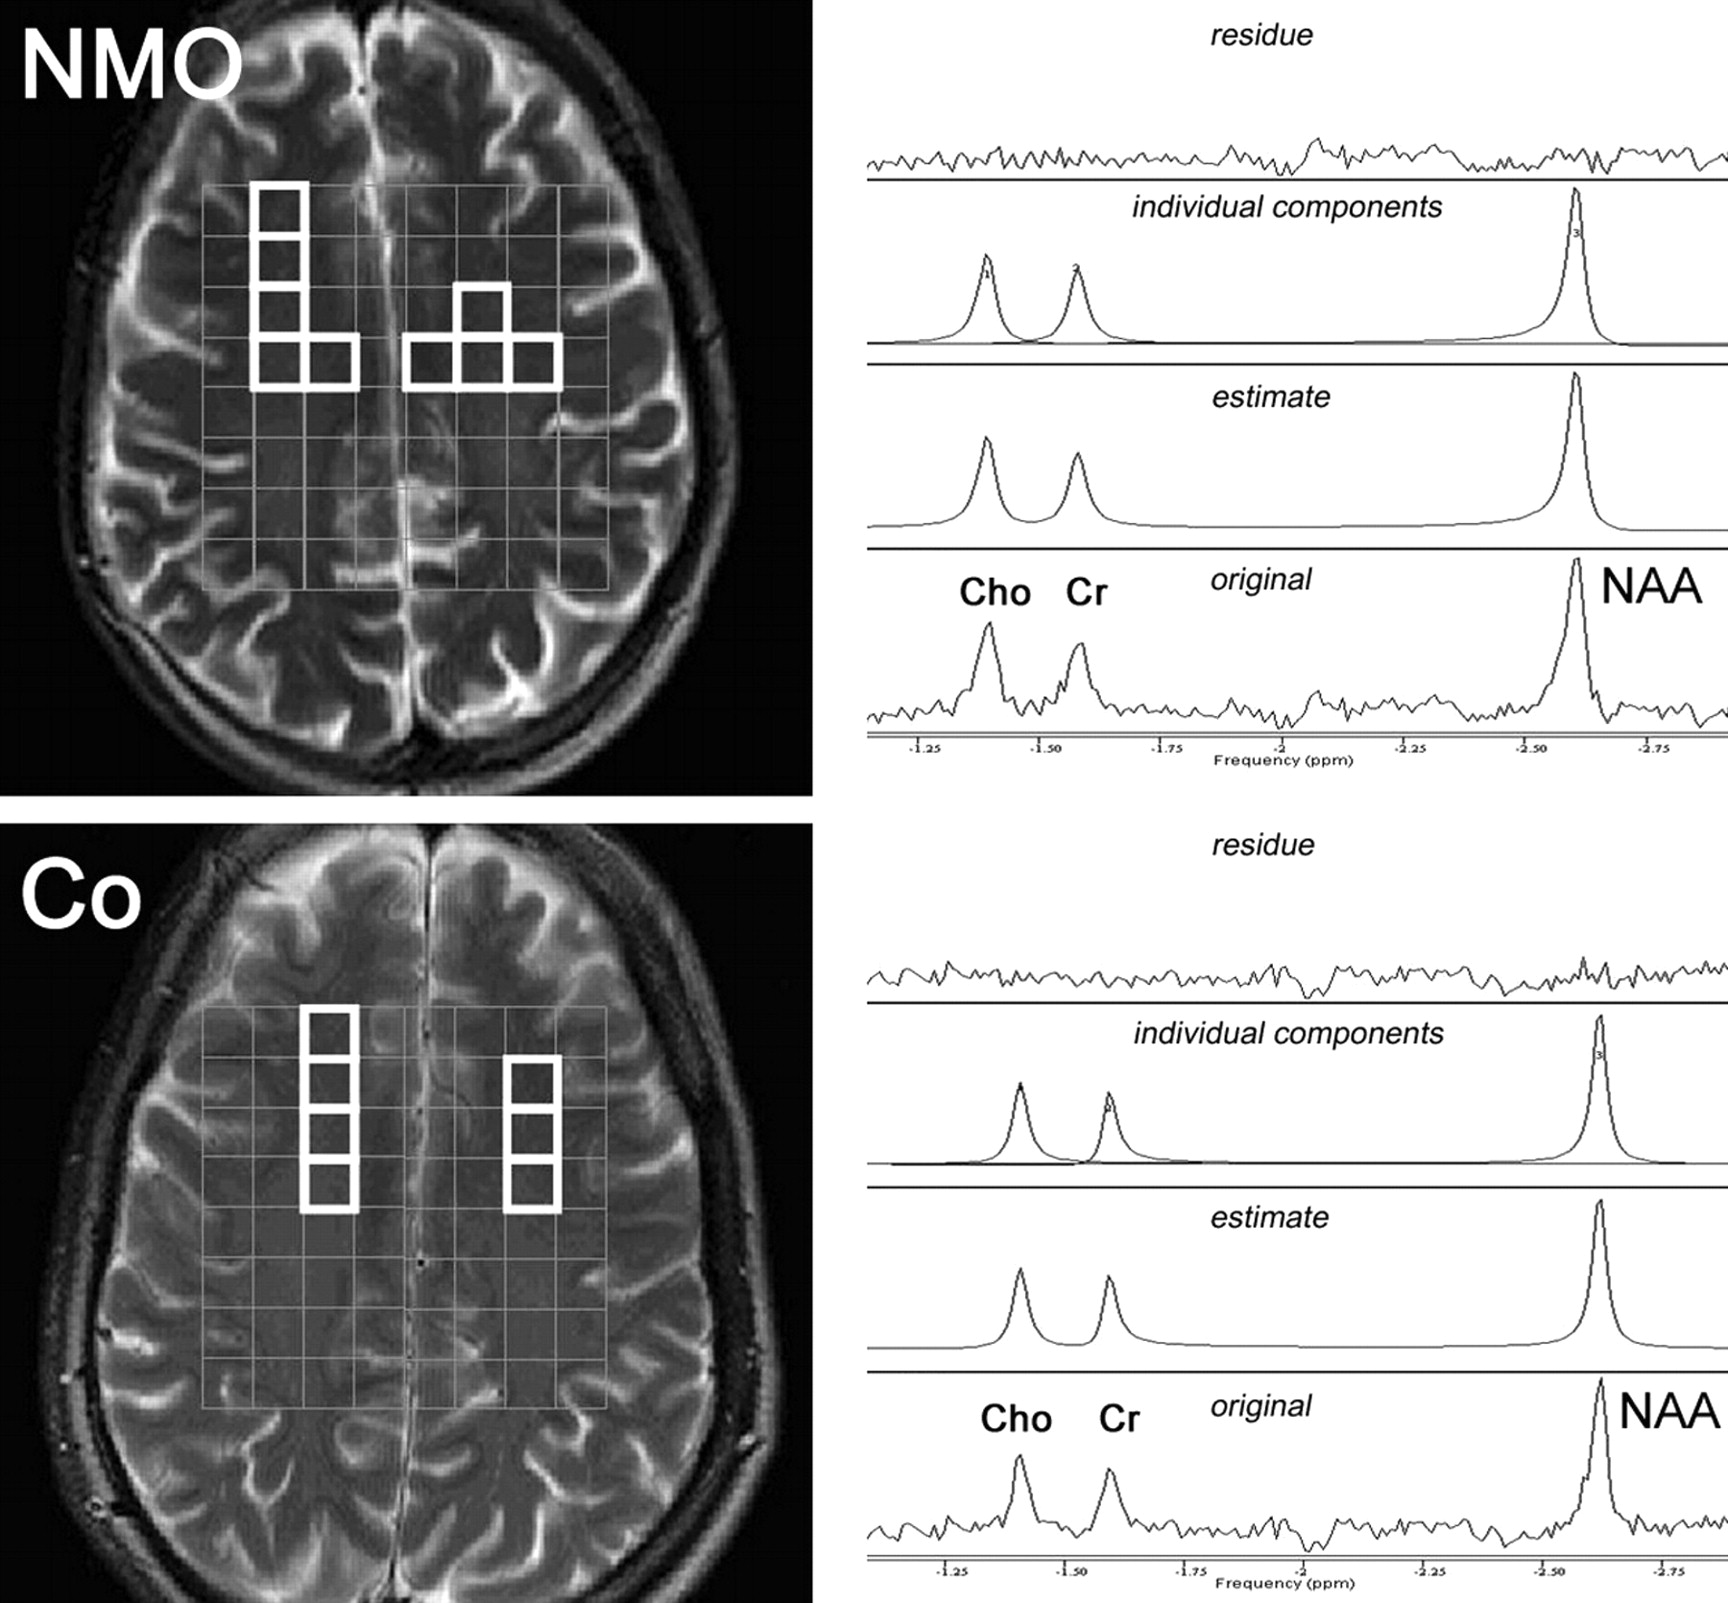
Examples of MR spectra of NMO and a healthy control are given in Fig 1. The relative SD of spectral fitting for all included spectra was ≤5%. All MR spectroscopy data of the NAWM are presented in detail in Fig 2 (ratios of metabolites, relative concentrations) and in Fig 3 (absolute metabolic concentrations).

Spectral region including resonance lines of choline (Cho), creatine (Cr), and N-acetylaspartate (NAA). Left: Anatomic T2-weighted MR images with the depiction of 1H-MR 2D spectroscopic imaging point-resolved spectroscopy sequence box volume of interest (gray, 8 × 8 cm) and voxels in the normal-appearing white matter (NAWM) chosen for the spectroscopic data evaluation. Right: Representative MR spectra from a single voxel with original spectra (lower trace); advanced method for accurate, robust, and efficient spectral fitting estimate (second trace); individual components (third trace); and fit residue (upper trace). NMO indicates neuromyelitis optica; Co, controls.

MR spectroscopy ratios of brain metabolites in the NAWM of patients with NMO and controls. White indicates patients with NMO; gray, controls; squares, NAA:Cr ratio; circles, NAA:Cho ratio; triangles, Cho:Cr ratio; bars, means.

MR spectroscopy absolute concentrations of brain metabolites in the NAWM of patients with NMO and controls. White indicates patients with NMO; gray, controls; circles, NAA absolute concentrations; squares, Cr absolute concentrations; triangles, Cho absolute concentrations; bars, means.
To sum up briefly, neither relative nor absolute concentrations of the examined metabolite (NAA, Cr, and Cho) were found between NMO patients and controls (P > .05).
Discussion
The purpose of our study was to clarify whether there can be diffuse axonal damage in the NAWM of patients with NMO. Therefore, we used 1H-MR spectroscopy operating at 3T and measured the absolute concentrations of metabolites by a chemical shift imaging (multivoxel) technique to overcome possible technical limitations.
The varying quality of the MR spectra results mostly from different field strengths and spectroscopic methods. In our study, hardware (3T MR imaging system) improvement yielding an increased signal intensity-to-noise ratio allowed improved accuracy of the spectral fit.17 The application of the MRSI method with the nominal geometric resolution of 1 cm3, instead of the rather crude single-volume spectroscopy on voxels of usually 8 cm3, decreases the possibility of partial volume effects in the spectra and brings further improvements of the signal intensity-to-noise ratio by decreasing the intravoxel dephasing effects.17 Furthermore, acquisition of an 8 × 8 spectroscopic signal-intensity matrix allows the addition of signals from appropriate voxels forming so-called anatomy-matched voxels, covering larger, more representative regions of NAWM. In respect to the methods of metabolite quantitation, the well-accepted approach of water signal intensity as an internal concentration reference used here eliminates the effects of possible concurrent changes of separate metabolite signal intensity on their ratios.17
In our study, we found no metabolic changes in the NAWM of patients with NMO. The absence of axonal metabolic changes in the NAWM of patients with NMO is consistent with the relapsing-remitting nature of the disease.1,4 Only very seldom does NMO follow a progressive course.10 CNS inflammation occurs only temporarily when patients relapse and is confined to the blood-brain barrier and perivascular foci only.4,6 The entire brain parenchyma seems not affected (continuously) in patients with NMO.1,26 In contrast to NMO in classic RRMS, even in very early disease stages, axonal metabolic changes and damage might be found in a subgroup of patients with RRMS,27 whereas in other patients with RRMS, NAA levels are normal and remain stable for years (F.A.-.E., unpublished data; 2007–2009; manuscript in preparation).28
Our MR spectroscopy data confirm the previous observation of Bichuetti et al,26 who studied 16 patients with NMO and 16 controls, and the clinical observations found by others and ourselves.4,10,18 The main differences from our study are that Bichuetti et al used a 1H-MR spectroscopy operating at 1.5T (single-voxel technique, and ratios of NAA and Cho to Cr), their patients were not analyzed for the presence of NMO-IgG antibodies, and no CSF data were provided.
Conclusions
NAA levels were found to be normal in 8 patients with clinically definite NMO (all positive for NMO-IgG in serum) measured by chemical shift imaging with 1H-MR spectroscopy operating at 3T.
Footnotes
-
Fahmy Aboul-Enein and Martin Krssak contributed equally to this study.
-
This work was funded by the Multiple Sklerose Forschungsgesellschaft Wien (www.ms-ges.or.at) and by the Medical Research Society Vienna, DC (www.mfg22.at). For MR spectroscopy analysis, MRUI software was used (http://www.mrui.uab.es./mrui). MRUI development and improvement were secured thanks to the European Union project HCM-CHRX-CT94–0432 (1994–1997) and TMR/Networks ERB-FMRX -CT970160 (1998–2001).20,21
-
Previously presented at: World Congress on Treatment and Research in Multiple Sclerosis, September 17–20, 2008; Montreal, Ontario, Canada; and Annual Meeting of the American Society of Neuroradiology, May 16–22, 2009; Vancouver, British Columbia, Canada.
Indicates open access to non-subscribers at www.ajnr.org
References
- Received April 15, 2009.
- Accepted after revision June 18, 2009.
- Copyright © American Society of Neuroradiology
In this issue


Jump to section
Related Articles
Cited By...
- MR T2-relaxation time as an indirect measure of brain water content and disease activity in NMOSD
- An optimal 1H-MRS technique at 7T: Proof-of-principle in Chronic Multiple Sclerosis and Neuromyelitis Optica Brain Lesions and Normal Appearing Brain Tissue
- Quantitative 7T MRI does not detect occult brain damage in neuromyelitis optica
- Neuromyelitis Optica: A Diffusional Kurtosis Imaging Study
- Conventional and Advanced Imaging in Neuromyelitis Optica
- Serum and CSF N-acetyl aspartate levels differ in multiple sclerosis and neuromyelitis optica
- Comment on "Global N-Acetylaspartate Declines Even in Benign Multiple Sclerosis"