
Abstract
BACKGROUND AND PURPOSE: GM is typically affected in HD since the presymptomatic stage. Our aim was to investigate with MT MR imaging the microstructural changes of the residual brain subcortical and cortical GM in carriers of the HD gene and to preliminarily assess their correlation with the clinical features.
MATERIALS AND METHODS: Fifteen HD gene carriers with a range of clinical severity and 15 age- and sex-matched healthy controls underwent MT MR imaging on a 1.5T scanner. The MT ratio was measured automatically in several subcortical and cortical GM regions (striatal nuclei; thalami; and the neocortex of the frontal, temporal, parietal, and occipital lobes) by using FLS tools.
RESULTS: The MT ratio was significantly (P < .05 with Bonferroni correction for multiple comparison) decreased in all subcortical structures except the putamen and decreased diffusely in the cerebral cortex of HD carriers compared with controls. Close correlation was observed between the subcortical and cortical regional MT ratios and several clinical variables, including disease duration, motor disability, and scores in timed neuropsychological tests.
CONCLUSIONS: MT imaging demonstrates degeneration of the subcortical and cortical GM in HD carriers and might serve, along with volumetric assessment, as a surrogate marker in future clinical trials of HD.
Abbreviations
- CAG
- cytosine-adenine-guanine
- FIRST
- FMRIB's Integrated Registration and Segmentation Tool
- FMRIB
- Functional MR Imaging of the Brain
- FSL
- FMRIB's Software Library
- GM
- gray matter
- HD
- Huntington disease
- MNI
- Montreal Neurological Institute
- MT
- magnetization transfer
- NGMV
- normalized GM volume
- NS
- not significant
- NWMV
- normalized WM volume
- UHDRS
- Unified Huntington's Disease Rating Scale
- WM
- white matter
MR imaging has a relevant role in the investigation of the structural brain changes in HD.1 In particular, T1-weighted images can be used to quantify and monitor, in vivo, the irreversible loss of volume of the GM structures typically affected by the disease, such as the striatum and the cerebral cortex, and of the cerebral WM.2–4
Interest is increasing in the capability of MR imaging to detect and quantify the microstructural changes of the residual GM or WM in HD, with the prospect of using them as surrogate markers in clinical trials assessing the new therapies aimed at halting or even reversing neurodegeneration.1 Diffusion-weighted or diffusion tensor MR imaging studies have documented a distributed pattern of damage in the remaining WM in HD.5–8 While increased diffusivity was reported in the striatal nuclei in symptomatic HD carriers,5,9 recently Mandelli et al10 reported a bimodal behavior of diffusion changes in the striatal nuclei of HD carriers with decreased diffusivity in the caudate but not in the putamen of presymptomatic subjects and increased diffusivity in the putamen and caudate in symptomatic subjects. However, no data, to our knowledge, about the capability of diffusion studies to detect cortical GM damage in HD are available. MT represents a valuable technique to investigate subcortical and cortical GM microstructures in a number of degenerative diseases.11–15
In a prior study by using manually drawn regions of interest and histogram analysis,5 a not statistically significant decrease of the MT ratio in the GM subcortical structures and in the whole brain was observed in symptomatic carriers of the HD gene compared with healthy controls.5 Recently, a model-based automatic segmentation/registration tool termed “FIRST” was developed as part of the FSL (http://www.fmrib.ox.ac.uk/fsl/)16 to assess the volumes of subcortical GM structures. FIRST can easily be combined with MT imaging to compute the MT ratio in the same structures (see “Materials and Methods”). Moreover, we developed a computational procedure to automatically measure the MT ratio in the cortical GM regions, avoiding contamination of CSF spaces and partial volumes at the WM/GM interface.17
Taking into account the primary involvement of the GM in HD,4,18 we assessed the potentials of these sophisticated tools to improve the analysis of the MT ratio and possibly detect microstructural changes in the atrophic subcortical and cortical GM structures in carriers of the HD gene mutation compared with healthy controls. Moreover, we preliminarily investigated the possible correlation between the regional subcortical and cortical GM MT ratios and the genetic and clinical features.
Materials and Methods
Subjects
Twenty carriers of the HD gene (8 women and 12 men; mean age, 56 ± 13 years) consecutively observed at the Ambulatory for Movement Disorders of the Neurologic Clinic of the University of Florence gave their informed consent to participate in this prospective study, which was approved by the local ethics committee. Molecular diagnosis was made according to a previously reported method,19 and the CAG triplet number in chromosome 4 encoding for the protein huntingtin of the HD carriers ranged between 39 and 50 (normal value, ≤32).20
At the time of the MR imaging examination, the same neurologist (S.P.) blinded to the results of MR imaging defined disease duration (years since onset of the first motor or nonmotor symptoms or signs) in the HD gene carriers and computed her or his score on the UHDRS.21 This included evaluation of motor symptoms and 3 selected timed psychomotor tests,4 namely the Verbal Fluency, the Stroop Color Word Interference, and the Symbol Digit tests, which were chosen for the UHDRS because of their sensitivity for frontal-striatal dysfunction in HD.21 Their clinical stages of functional capacities were also determined by using the criteria defined by Shoulson and Fahn.22 These 5 stages take into account an individual's engagement in an occupation, the ability to handle financial affairs, manage domestic responsibilities, and perform activities of daily living, and his or her need for care facilities.
Fifteen age-matched healthy volunteers unrelated to the HD carriers and without personal or familial history of neurologic diseases (7 women and 8 men; mean age, 55 ± 12 years) served as controls.
MR Examination
HD gene carriers and controls underwent MR imaging on a 1.5T system (Intera; Philips, Best, the Netherlands) with 33 mT/m maximum gradient strength and SENSE coil technology. After scout imaging, a sagittal 3D T1-weighted turbo gradient-echo sequence (TR = 8.1 ms, TE = 3.7 ms, flip angle = 8°, TI = 764 ms, FOV = 256 mm, matrix size = 256 × 256, 160 contiguous sections, section thickness = 1 mm) was obtained for the assessment of the volumes of the subcortical and cortical cerebral structures. For MT imaging, axial images without and with a gaussian sinc-shaped off-resonance pulse (bandwidth = 342 Hz, off-set frequency = 1100 Hz, duration = 17500 μs) were acquired with a gradient recalled-echo sequence (TR = 37 ms, TE = 3.7 ms, flip angle = 8°, FOV = 256 mm, matrix size = 128 × 128, 100 contiguous sections, section thickness = 3 mm, NEX = 2).
Data Analysis
Volumetric Analyses.
Global brain volumes were measured on the 3D T1-weighted images by using the cross-sectional version of the SIENA software, termed SIENAX (part of FSL 4.0; http://www.fmrib.ox.ac.uk/fsl/).23,24 SIENAX allows measures of normalized GM (NGMV) and normalized WM (NWMV).25
For volume measurement of the subcortical GM nuclei, namely the caudate, putamen, pallidum, and thalamus, we used FIRST,16,26,27 part of FSL. FIRST uses a Bayesian probabilistic approach: The shape and appearance of models in FIRST are constructed from a library of manually segmented images. Using these learned models, FIRST searches, through shape deformation, the most probable shape of the given deep GM structure.
To implement this procedure, we registered the T1-weighted input data into the MNI 152 standard space brain atlas at 1-mm resolution by means of affine transformations based on 12 df (ie, 3 translations, 3 rotations, 3 scalings, and 3 skews). Then a subcortical GM mask was applied to locate the different subcortical structures, followed by segmentation based on shape models and voxel intensities. Due to possible mistakes in the registration and segmentation as a consequence of the global and regional cerebral atrophy that is common in HD, in this study, all the automatically segmented subcortical regions in HD carriers and controls were visually checked by the same operator (A.G.), who performed a section-by-section boundary correction when necessary. Because of the evident brain atrophy in most of the HD carriers, blinding to the diagnosis was not possible. An example of subcortical GM nuclei segmentation after manual boundary correction in an HD carrier is shown in Fig 1. Finally, absolute volumes of the left and right caudate, putamen, pallidus, and thalamus were extracted from the individual subcortical masks and multiplied by the scale factor provided by the SIENAX procedure to obtain normalized bilateral volumes of each subcortical structure.
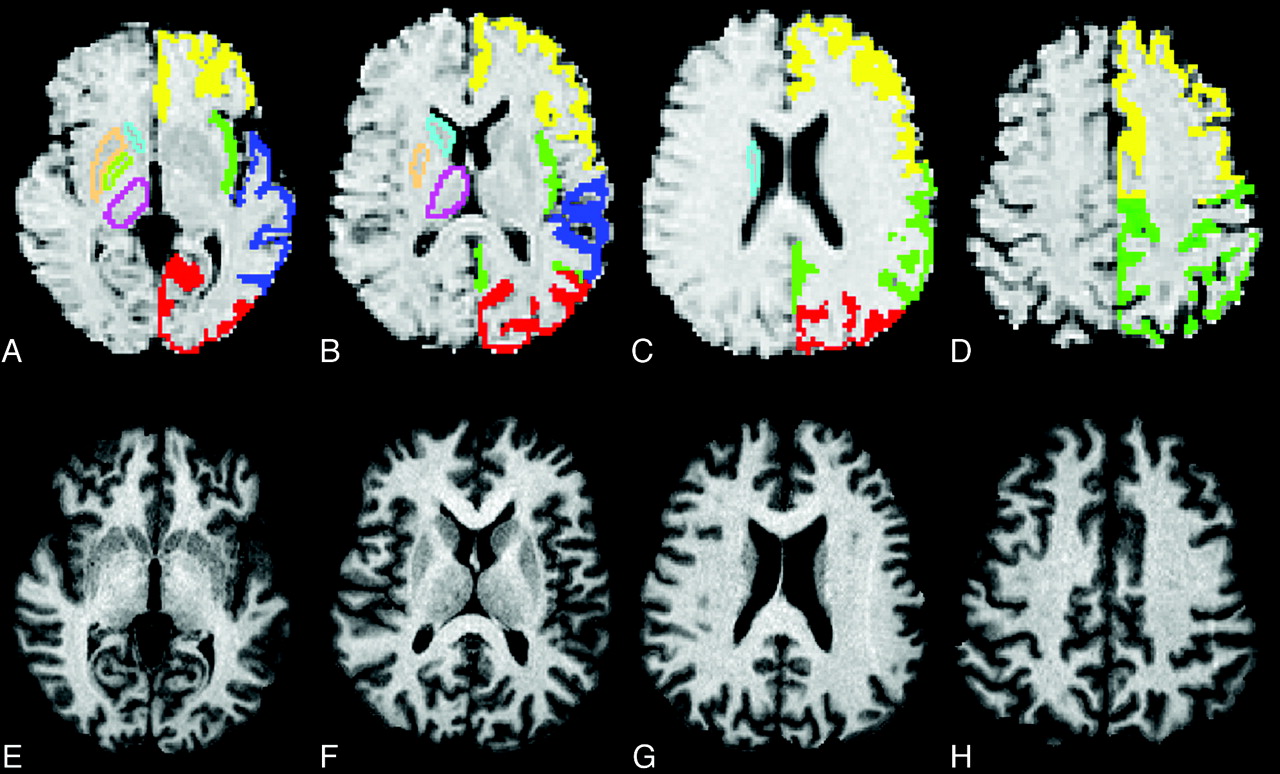
A–H, Example of the FIRST segmentation of the striata and thalami (light blue indicates the caudate; light green, the pallidus; yellow ochre, the putamen; lilac, the thalamus) in HD gene carrier in clinical stage I (A–D), which was manually edited on the basis of the structure contour identified in the subject's heavily T1-weighted images (E–H). A–D, The automatic definition of the cortical GM ribbon performed by the in-house-developed software is also displayed with different colors corresponding to the 4 cerebral lobes (yellow indicates frontal; green, parietal-insular; dark blue, temporal; red, occipital).
For volume measurement of specific cortical GM regions, predefined standard space masks were used to select the cortical GM of these regions (MNI structural atlas in http://www.fmrib.ox.ac.uk/fsl/data/atlas-descriptions.html#mni) and to estimate volumes normalized for subject's head size. We considered here the normalized volumes of frontal, temporal, parietal (which included the insula), and occipital lobes of both hemispheres.
MT Ratio Analysis.
Subcortical and cortical MT ratios were measured by using an automated method extensively described elsewhere.17 In general, this consists first of using the T1-weighted MR images to generate very conservative probabilistic tissue-class images of the GM and WM and then in applying these masks to the MT ratio images. In particular, for analysis of the MT ratio of the subcortical structures, the subject's mask created with FIRST (see above) for volume assessment was superimposed onto the MT ratio images. Likewise, to select identical cortical GM brain regions in each subject, predefined standard-space cortical GM masks were inversely transformed and applied to the native MT ratio images to compute the MT ratio of the frontal, temporal, parietal-insular, and occipital lobes. In all these measurements, a particularly conservative approach to segmentation prevented partial volume contamination of the WM-GM junction and the CSF-GM borders.15,17
The values of the MT ratios of the different regions were calculated by averaging the values of all voxels contained in the given region.
Statistical Analyses.
Because there are indications that brain atrophy and hence progression of neurodegeneration in HD might be asymmetric,28,29 preliminarily we assessed, with the Wilcoxon test for paired samples (right versus left), possible differences between the volumes and MT ratios of the right and the left caudate nucleus; putamen; pallidus; thalamus; and frontal, temporal, parietal and occipital cortical GM in the HD carrier.
Due to the relatively small sample size and the not normal distribution of the data, we used the Mann-Whitney U test to assess the differences between HD carriers and controls for the volumes and MT ratios. A Bonferroni correction for multiple comparisons was applied within the group of volume and MT ratio measurements, separately.
Finally, in the HD carriers, the subcortical and cortical GM volumes and MT ratios of the 2 sides combined were correlated with the individual number of triplets, disease duration, and the scores on the motor section of the UHDRS, Verbal Fluency, Trail-Making, and Stroop tests by using the Spearman rank correlation test. For all analyses, the statistical threshold was set at P < .05.
Results
Subjective MR Imaging Evaluation
Five symptomatic HD carriers showed motion artifacts in T1-weighted or MT images and were excluded from further analyses. The genetic and clinical characteristics of the remaining 15 (7 women and 8 men) HD carriers are detailed in Table 1. At the functional evaluation, one HD gene carrier was asymptomatic (stage I), 4 had very mild impairment (stage II), 6 mild impairment (stage III), and 4 moderate impairment (stage IV).
Genetic and clinical features in 15 HD gene carriers
Group Differences of Volumes
All global and regional volume measurements are summarized in Tables 2 and 3. As expected in HD carriers, the NGMV (mean, 696 ± 73 mm3) and NWMV (mean, 633 ± 61 mm3) were significantly reduced compared with those in the controls (mean NGMV, 792 ± 61 mm3 and mean NWMV, 678 ± 46 mm3) (P < .001 for all).
Volumes and MT ratios of the striatal nuclei and thalami in 15 healthy controls and 15 HD carriers
Mean normalized volumes and MT ratios of the cerebral cortical GM in 15 healthy controls and 15 HD carriers
In the group of HD gene carriers, the left caudate, pallidus, and thalamus tended to be smaller than the right nuclei, but these differences were not statistically significant. In contrast, all the left cortical regions were significantly smaller than the right cortical regions. These data are summarized in On-line Tables 1 and 2.
The volumes of all subcortical structures except the thalami and of all cortical structures were significantly reduced in HD carriers compared with the controls.
Group Differences of Regional MT Ratios
The MT ratio of the whole brain GM was significantly lower in HD carriers (mean, 51.2 ± 3.5) than in controls (mean, 54.5 ± 0.6) (P = .003), whereas the MT ratio of the whole brain WM (mean, 58.5 ± 1.6) was not significantly lower in HD carriers than in the controls (mean, 59.4 ± 3.5).
The group of the HD gene carriers did not show any significant asymmetry of the regional cortical or subcortical GM MT ratios (On-line Tables 1 and 2).
Tables 2 and 3 summarize the mean and SD values of the MT ratio in the subcortical nuclei and lobar cortical GM. All the subcortical GM structures except the putamen showed significantly decreased MT ratios (P ≤ .02 for all), whereas a significant decrease of the cortical MT ratio was found diffusely in all cerebral lobes (P < .01).
Correlation of MR Imaging Measurements with Genetic and Clinical Variables
Table 4 reports the Spearman rank correlation coefficients of the volume and MT ratio measurements with the genetic and clinical variables. The distribution of the data for the highest correlation of the MT ratio measurements is shown in Fig 2 . The number of triplets did not show correlation with any volume or MT ratio measurement. Disease duration showed a close inverse correlation with the volume of the caudate, putamen, and globi pallidi; with the volume of the fontal and parietal cortex; with the MT ratio in all subcortical GM structures except the globi pallidi; and in all cortical regions, with the highest correlation coefficient (R = −0.77) in the temporal cortex (Fig 2A). The UHDRS motor score showed close correlation with all volume measurements, with the exception of the normalized WM volume, and with the MT ratio measurements in all structures except the caudate and thalami, with the highest correlation coefficient (R = −0.78) in the putamen (Fig 2B). Of the 3 psychomotor tests, the scores of the Verbal Fluency test showed a general correlation with several volume and MT ratio measurements, with the highest correlation coefficient (R = 0.83) with the temporal cortex MT ratio (Fig 2C), whereas the scores of the Symbol Digit inversely correlated only with the volume of the caudate nuclei and occipital cortex and with the MT ratio in the putamen and in the temporal cortex (R = 0.81; Fig 2D). Finally the scores in the Stroop test correlated with atrophy of the thalami and occipital cortex and with the MT ratio in the putamen.
Spearman rank correlation coefficients between the clinical-genetic variables and volumes and MT ratios in 15 HD carriers
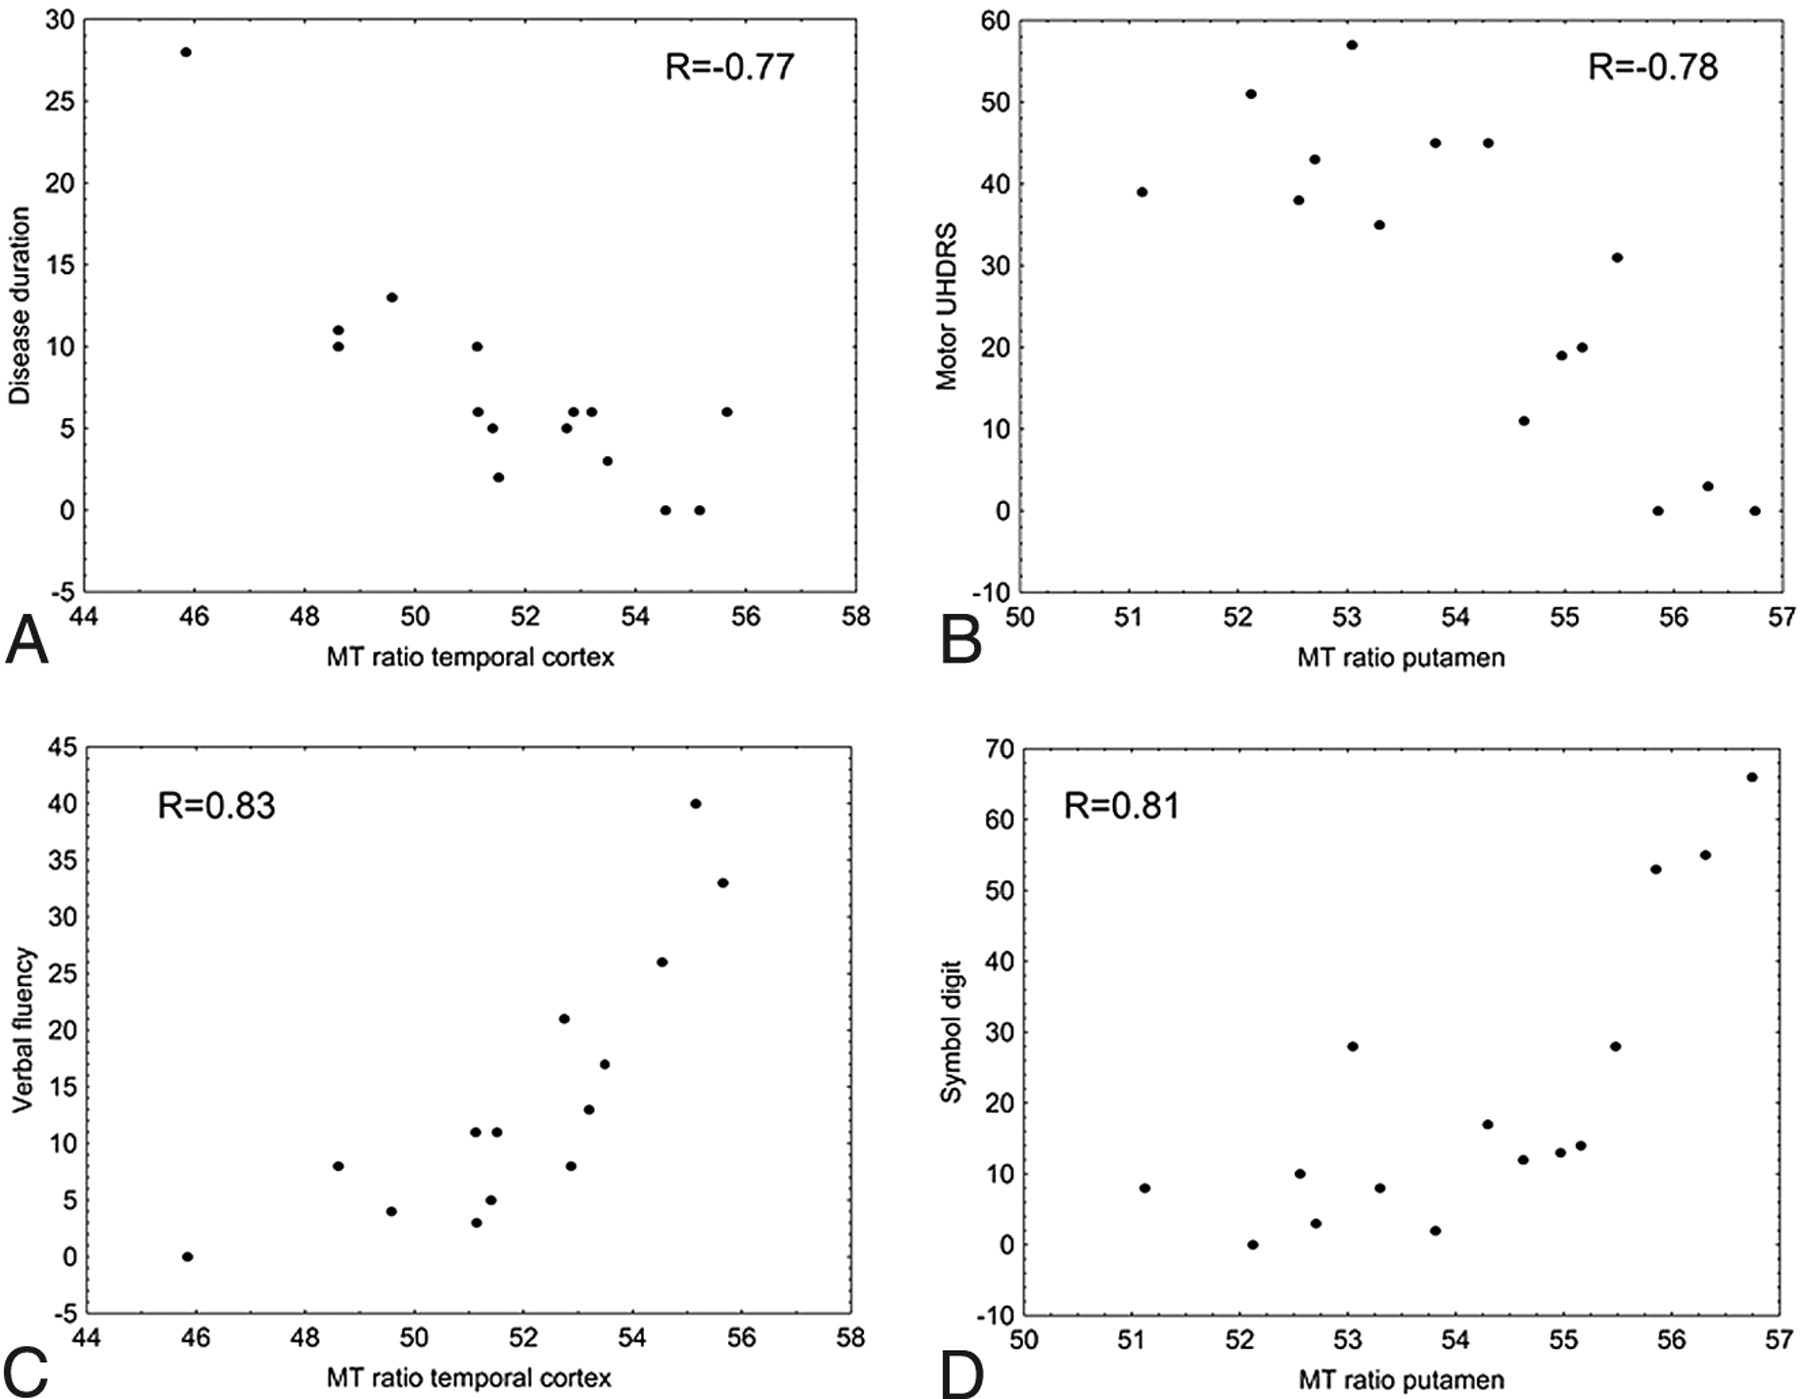
Plots showing correlation between clinical variables (disease duration, motor UHDRS, Verbal Fluency test, and Symbol Digit test) and MT ratio measurements in the temporal lobe cortex (A,C) and putamen (B,D).
Discussion
In the present study, we explored regional MT ratios in the atrophic subcortical and cortical brain GM in a sample of HD carriers with a range of clinical severity and in a group of healthy age- and sex-matched controls and found a statistically significant decrease of the MT ratio in all subcortical GM structures except the putamen and in the cerebral cortex diffusely. Conversely, in line with prior data,5 the MT ratio of the whole brain WM was not significantly decreased.
The demonstration of a significant decrease of the MT ratio in the subcortical GM structures in the present study as opposed to the previous one5 by our group can be explained by the following reasons: 1) Here we used high-resolution thin-section heavily T1-weighted images for automatic but manually corrected segmentation of the GM subcortical nuclei to create the individual masks to be superimposed on MT ratio maps for computation of the data, whereas in the prior study, the manually drawn regions of interest were taken directly onto the MT ratio maps. 2) In the present study, we acquired 3-mm-thick MT images as opposed to the 5-mm-thick MT images obtained previously. These 2 factors might have decreased partial volume effects with CSF and nearby WM in the atrophic caudate and putamen. Moreover, they enabled measuring the mean value of the MT ratio over many more voxels in the subcortical nuclei than in the previous study, with the benefit of an increased statistical power. 3) Finally, the contribution might arise from a different MT sequence, which was T1-weighted gradient-echo in this study and T2*-weighted gradient-echo in the prior study.5 We recognize as a persistent limitation of the present approach the operator dependence associated with manual editing of the FIRST segmentation of the basal ganglia.
The cerebral cortex was not assessed in previous MT studies of HD. The following 2 elements make us confident that the decrease of the cerebral cortical MT ratio in our HD gene carriers reflects microstructural damage rather than volume loss: 1) The in-house-developed software and the conservative parameters we chose for its application should have virtually eliminated the possibility of partial volume effects at the GM, WM, and CFS interfaces. 2) In the HD carriers, we observed a leftward bias of loss of volume of the cerebral cortex, confirming previous findings,28,29 whereas the MT ratio values in the cerebral cortex were essentially symmetric.
The observation in our study of decreased MT ratios throughout the cerebral cortex in HD gene carriers is important for 2 reasons. First, it indicates that the decrease of the cortical MT ratio is probably a nonspecific finding reflecting GM neurodegeneration and is not characteristic of a given neuropathologic process as has been proposed for Alzheimer disease.13 Second, it confirms the capability of MT imaging to reveal microstructural changes in the remaining cortical GM in neurodegenerative diseases of the CNS.14,15
The diffuse distribution of cortical cerebral atrophy in our sample of HD carriers with a range of clinical severity is expected on the basis of the neuropathologic29 and MR imaging findings,30,31 which indicate that early or more severe cortical changes are observed in the occipital regions from which, with disease progression, they proceed forward with sparing of the medial temporal lobes and most of the anterior and limbic portions of the frontal lobes.
The apparent discrepancy of our results compared with those of Jurgens et al,32 who reported that the mean of the MT ratio of the whole brain, GM, and WM was similar in 16 presymptomatic HD gene carriers and in 14 healthy controls, can be explained by both the different clinical severity of the HD carriers in the 2 samples and by the global analysis of the MT ratio they performed compared with the regional analysis in our study. Nonetheless, they observed a significant inverse correlation between the height of the peak of the GM MT ratio histogram, reflecting a more severe grade of microstructural damage, and the motor abnormalities and between the height of the peaks of the whole brain, GM, and WM MT ratio histograms and the number of CAG repeat lengths in the HD gene carriers.
A general correlation between striatal atrophy and the number of CAG repeats was reported in symptomatic HD carriers.2,33 In our opinion, lack of correlation between the number of triplets and the volume or MT ratio measurements in our series can be explained by the small number of HD carriers and the relatively narrow interval of the abnormal triplet expansion. Conversely, the correlation we observed between clinical features and volume measurements is substantially in line with prior data in larger sample sizes of symptomatic HD carriers.1 In particular, the correlation between cortical atrophy and some clinical features supports the view that the distribution and severity of cerebral cortical atrophy might contribute to the clinical heterogeneity of HD.4 More interesting, the regional subcortical and cortical MT ratio measurements showed a general correlation with the same clinical variables. In particular, the fact that regional GM MT ratios also correlated with the scores in selected neuropsychological tests confirms the possibility that assessment of the quality of the residual GM by using MT ratios might reflect an increasing severity of the biophysical changes associated with neurodegeneration15 and might explain some of the clinical features of HD, notably the cognitive changes.1,4 As such, the MT ratio might serve as an independent marker of the HD pathologic process along with volume loss. In our opinion, further cross-sectional studies in presymptomatic subjects are valuable to compare the sensitivity of the MT ratio and of the volume measurements with HD neurodegeneration, while longitudinal studies might clarify the temporal relationship between volumetric and MT ratio changes, which is at present unknown.
Admittedly, the phenomena underlying the decrease in MT ratio in the GM of HD carriers and in neurodegenerative diseases in general are poorly understood. Because MT imaging explores the relationship between free protons and those bound to macromolecules, the MT ratio depends on the local chemical and biophysical environment of macromolecules. Tentatively, such phenomena could reflect changes associated with neuronal loss, ubiquinated nuclear inclusions, increased attenuation of oligodendrocytes, severe astrogliosis, and a loose textured neuropil, which are the neuropathologic features observed in the striata of human HD.18 More sophisticated acquisitions and analyses of the MT phenomenon, including 3D sequences and estimation of the fractional size of the restricted and free pools of protons, the T2 of the restricted pool, and the relaxation times in the free pool,13,34 have been developed and, in principle, might provide a better characterization of the biophysical events underlying MT ratio measurement. However, they were not used in the present study.
Footnotes
Indicates article with supplemental on-line tables.
References
- Received April 20, 2010.
- Accepted after revision May 14, 2010.
- Copyright © American Society of Neuroradiology
In this issue


Jump to section
Related Articles
Cited By...
- Magnetization Transfer Imaging in Premanifest and Manifest Huntington Disease: A 2-Year Follow-Up
- Magnetization Transfer Imaging in Premanifest and Manifest Huntington Disease
- Magnetization Transfer Imaging Demonstrates a Distributed Pattern of Microstructural Changes of the Cerebral Cortex in Amyotrophic Lateral Sclerosis