
Abstract
BACKGROUND AND PURPOSE: T2 relaxation times provide a continuous measure of changes in intervertebral disk biochemistry. The purpose of this study was to correlate T2 relaxation times in lumbar disks with patient age and stage of degeneration.
MATERIALS AND METHODS: Sagittal T1- and T2-weighted images and axial images were acquired in 20 patients referred for MR imaging for back pain or radiculopathy. Two readers inspected these images and assigned a Pfirrmann grade to each disk. An additional sagittal multiecho FSE image sequence was obtained, and T2 relaxation times were calculated for a each lumbar disk. T2 relaxation times were correlated with Pfirrmann grade. T2 relaxation times in nondegenerated disks were correlated with patient age. Statistical significance was tested by ANOVA, ad hoc tests, and Pearson coefficients.
RESULTS: T2 relaxation times were calculated for 95 lumbar disks in 19 patients and discarded for 5 disks in 1 patient due to motion artifacts. Forty-four disks were classified as Pfirrmann grade II; 34, as grade III; 14, as grade IV; and 3, as grade V. Mean T2 relaxation times of the central region decreased from 108 ms for grade II to 53 ms for grade IV disks. T2 relaxation times correlated significantly with Pfirrmann grade. For grade II disks, T2 relaxation times of the central region decreased significantly from an average of 132 ms for patients in their 20s to 86 ms for those in their 60s.
CONCLUSIONS: T2 relaxation times in lumbar disks correlate with stage of degeneration and patient age.
Abbreviations
- ANOVA
- analysis of variance
- FSE
- fast spin-echo
- MRI
- MR imaging
- Postop
- postoperative
Measuring T2 relaxation times of intervertebral disks by MR imaging may provide a means to quantify intervertebral disk degeneration and aging in vivo. Water content, a measure of disk age and degeneration in laboratory studies, is a major factor in the T2 relaxation time of the disk. T2 relaxation times have been used experimentally to measure disk aging and degeneration.1–4 To validate its use, T2 relaxation times in cadaver disks have been correlated with the disk morphology or biochemistry.5–10
The purpose of this study was to test the hypothesis that T2 relaxation time decreases as the stage of lumbar intervertebral disk degeneration advances. On the theory that disk degeneration occurs progressively once the process is initiated, methods have been devised to stage disk degeneration. A method of grading lumbar disk degeneration based on MR images, Pfirrmann grading, has been used investigationally.11–13 The grading system has fair-to-good intra- and inter-reader agreement.11 The correlation of Pfirrmann grade and T2 relaxation time has not been investigated, to our knowledge. Significant correlation between in vivo T2 relaxation times and the stage of degeneration would validate the use of T2 measurements to study degenerative disk disease. A second purpose of our study was to correlate T2 relaxation time with patient age in lumbar disks without evidence of degeneration.
Materials and Methods
Patient Recruitment
The institutional review board of the University of Wisconsin School of Medicine and Public Health approved a prospective study to acquire T2 measurements in 20 patients with back pain or radiculopathy. Inclusion criteria were referral for MR imaging by a spine specialist, availability of scanners with the T2 map pulse sequence at the time of the patient's scheduled scanning, and consent from the patient to participate in the study. Exclusion criteria were age younger than 18 years or age older than 70 years or contraindication to MR imaging. One of the investigators (N.L.M.) reviewed requests for MR imaging received daily between August 4, 2008, and November 21, 2008; selected, for logistic reasons, no more than 1 potential patient each day for the study; informed patients of the goals and risks of the study; and requested written consent. The investigator had otherwise no conscious criteria for selecting or excluding patients. Patients who agreed to participate had the T2 map pulse sequence added to the standard lumbar spine MR imaging protocol.
MR Imaging
Lumbar spine imaging was performed on a 1.5T scanner with a 4-channel cervical-thoracic-lumbar coil (Signa; GE Healthcare, Milwaukee, Wisconsin; software Version 14.0). Localizer images, sagittal T2-weighted images (TR/TE, 4000/80 ms; thickness, 4.0 mm; FOV, 24 cm; matrix, 512 × 512; NEX, 7; bandwidth, 63.9 kHz; and fat saturation), and sagittal and axial T1-weighted images were acquired. The additional T2 map multiecho sequence was then performed as a single midline sagittal image. Parameters for this sequence included TR/TE, 2000/9 ms; interecho delay, 9 ms; echo-train length, 16; section thickness, 5.0 mm; FOV, 20 cm; matrix, 256 × 256; NEX, 1; and bandwidth, 63.9 kHz. Fat saturation and anterior saturation bands were applied. The scanning time for this sequence was 5 minutes 30 seconds.
Pfirrmann Grading of Disks
Two readers reviewed the sagittal T2-weighted MR images and independently graded each intervertebral disk, levels L1–2 through L5–S1, by Pfirrmann criteria without reference to T2 measurements. The Pfirrmann criteria, with additional explications for this study, were provided to each reader (On-line Table 1).11 Stage II was defined as an adult disk with homogeneous high signal intensity in the central region clearly differentiated from the peripheral annulus fibrosus; stage III, as signal intensity from the central disk region less than CSF while still higher than and differentiated from the peripheral annulus fibrosus; stage IV, a disk with decreased height and central region poorly differentiated from the peripheral annulus; and stage V, as a disk with collapse of the disk space and no difference in signal intensity between the central disk region and the peripheral annulus fibrosus.
Independent results from the 2 reviewers were tabulated and compared. If the readers agreed on the Pfirrmann grade for a disk, that grade was recorded for analysis. If the readers disagreed, they reviewed the images together and reached a consensus, without knowledge of the T2 measurements.
Calculation of the T2 Relaxation Time
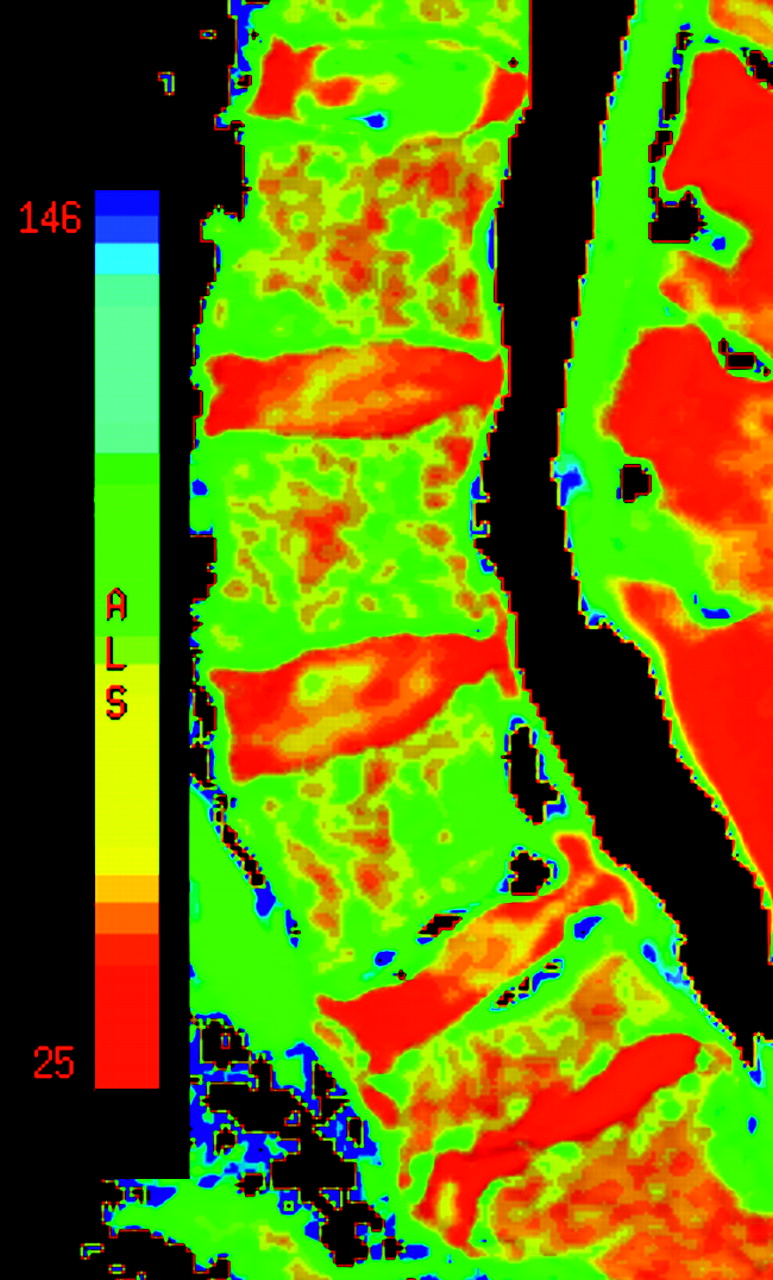
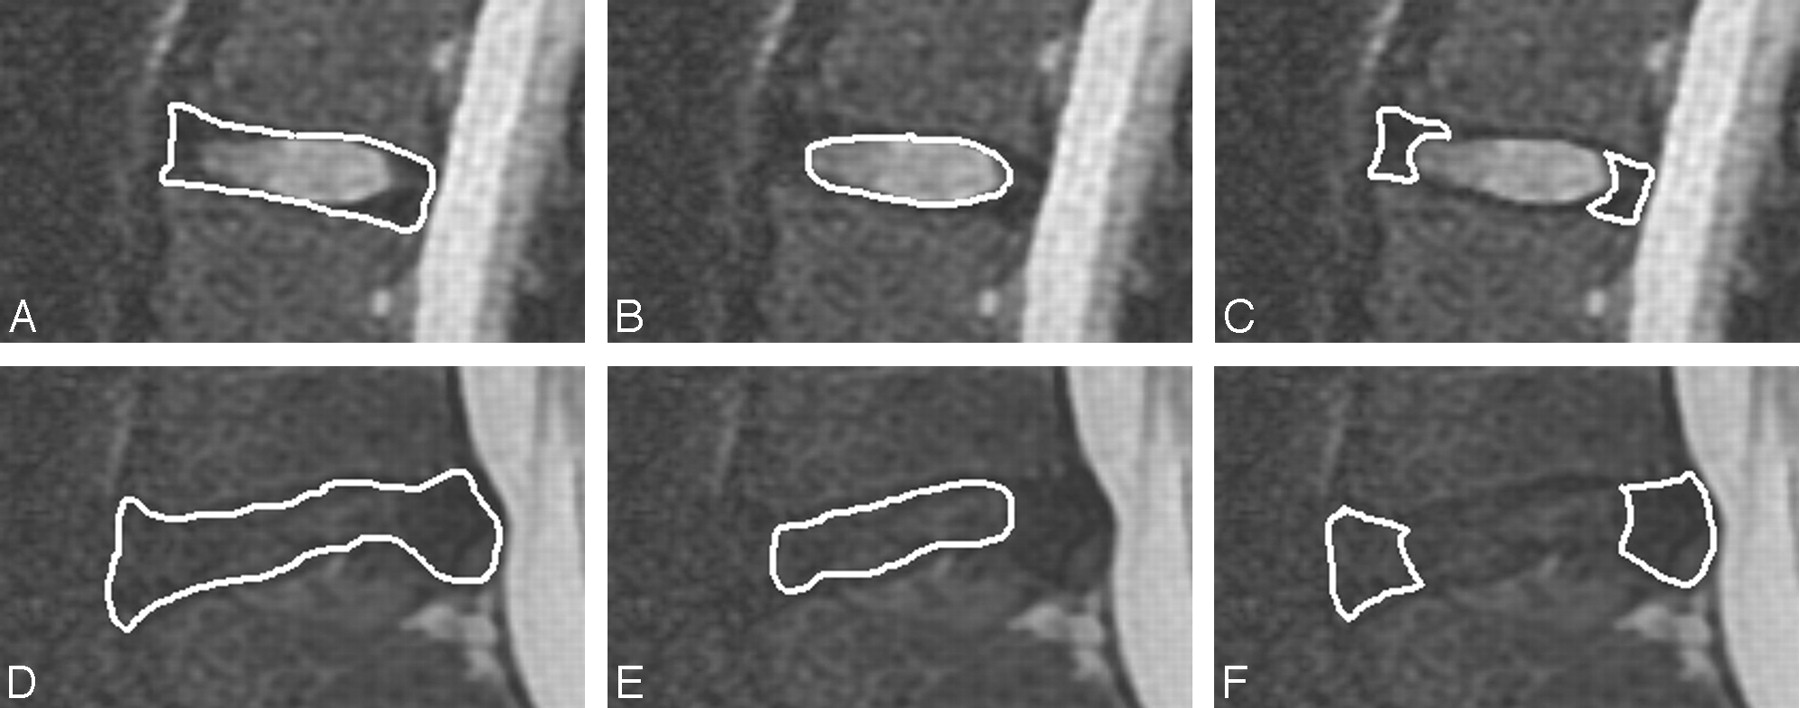
Images were inspected for evidence of artifacts from motion or metal. Image data from the sagittal T2 map acquisitions were imported into Matlab (Version 7.0/R14; MathWorks, Natick, Massachusetts) so that signal intensities for each of the 16 consecutive echoes in the echo train were tabulated for each voxel. The signal intensities for each voxel were fitted to an exponential decay model, and the slope was calculated. The T2 relaxation time for each voxel was recorded as the negative inverse of the slope of the line. T2 relaxation times were mapped as a gray-scale or color image with the same dimensions as the source T2 map acquisition images (Fig 1). On source images, a region of interest was drawn to include the entire intervertebral disk at each level (Fig 2) and the central (high signal intensity) region of each disk. This portion of the disk is, for simplicity, designated the nuclear region. For disks in which the boundary between the nucleus pulposus and annulus fibrosus was not distinguishable, a region was selected by the investigator corresponding to the expected location of the nucleus pulposus region. Small regions of interest were also drawn in the anterior and posterior low-signal-intensity regions of the disk corresponding to the location of the peripheral annulus fibrosus. For disks with complete or nearly complete height loss, an irregularly shaped region of interest was placed to encompass the thin intervertebral disk or nucleus pulposus region. T2 relaxation times were averaged for the whole disk and the nuclear region for each Pfirrmann classification.

Color image of a T2 relaxation time map. The color scale ranges from 25 to 146 ms. The image shows 5 lumbar disks. A grade II disk is illustrated at L1–2; grade III, at L3–4 and L4–5; grade IV, at L2–3; and grade V, at L5–S1. Areas with T2 relaxation times that are off the scale are black, for example, as shown by the CSF in the central spinal canal. The color scale shows relaxation times from 25 ms (red end of scale) to 146 ms (blue end of scale).

Region-of-interest placement for the whole disk (A and D), nucleus pulposus region (B and E), and annulus fibrosus (C and F) for a Pfirrmann grade II disk (A–C) and a Pfirrmann grade IV disk (D–F).
For Pfirrmann grade II disks, the T2 relaxation time of the entire disk and of the nuclear region was plotted against the patient's age.
Statistical Analysis
Differences in T2 relaxation times for Pfirrmann grade II, III, and IV disks were tested for significance with 1-way ANOVA. Differences between successive grades for the whole disk and for the nucleus pulposus region alone were tested by a Student t test of the means with significance set at P < .05. The correlation of T2 relaxation time and age was tested for significance by least squares regression analysis. Statistical calculations were performed by using the Analysis Toolpak in Microsoft Excel, 2003 edition (Bothell, Washington).
Results
Twenty patients were enrolled, including 8 men and 12 women, ranging in age from 21 to 69 years, with an average age of 41 years (Table). One patient's data, patient 17 in the Table, were excluded due to significant motion during the T2 map acquisition. Artifact-free images were obtained for each of the 5 lumbar disks from 19 patients, for a total of 95 lumbar disks. Of these 19 patients, 4 had prior lumbar spine surgery.
Demographic, clinical, and L1–2 through L5–S1 imaging data for the 20 patients
Of the 95 disks, 44 were grade II; 34, grade III; 14, grade IV; and 3, grade V as determined by consensus between the 2 readers (Fig 3). The agreement rate for the readers on their independent readings was 75%. Readers disagreed by 1 grade in 24 disks in 11 patients and never by >1 grade (Fig 4). The most common disagreement was grade II versus grade III. The most frequent reason for initial disagreement was the issue of normal or reduced signal intensity and the distinctness of the annulus fibrosus. One or the other of the 2 readers modified his initial stage classification in the 24 instances, and neither reader prevailed consistently.

T2-weighted images illustrating 4 Pfirrmann disk grades. Midsagittal images show a grade II disk (A) with high signal intensity in the central region and lower signal intensity in the peripheral region, clearly distinguishing the nucleus pulposus region from the annulus fibrosus; a grade III disk (B) with lower signal intensity in the central region and less clear distinction between the nucleus pulposus region and annulus; a grade IV disk (C) with homogeneously low signal intensity and with no distinction of the nucleus pulposus region and annulus; and a grade V disk (D), which is collapsed.

T2-weighted image of a disk initially interpreted by 1 reader as Pfirrmann grade III and by the other reader as grade IV. By consensus, it was classified as grade IV.
The mean T2 relaxation time for 95 whole lumbar disks was 74 ± 23 ms, ranging from 39 to 139 ms. For Pfirrmann grades II, III, IV, and V, mean T2 relaxation times for the whole disk were 91, 62, 51, and 47 ms, respectively (Fig 5A) with the differences significant by 1-way ANOVA (P < .001). Post hoc t tests showed significant differences in the whole-disk mean T2 relaxation times for grade II versus grade III and grade III versus grade IV disks, with P < .001 and P = .007, respectively. Because of the small number of grade V disks, the difference between grade IV and V was not tested for significance.

Mean T2 relaxation times versus Pfirrmann grade for whole disks (A) and the nucleus pulposus region (B). The means (±SDs) for all disks of each grade are illustrated. The vertical bars represent the SD from the mean.
The mean T2 relaxation time for the nuclear region of disks of all grades combined was 84 ± 30 ms and ranged from 41 to 164 ms. For Pfirrmann grade II, III, IV, and V disks, mean T2 relaxation times for the nucleus pulposus region were 108, 69, 54, and 53 ms, respectively (Fig 5B), with the differences significant by 1-way ANOVA (P < .001). Post hoc t tests showed significant differences in mean T2 relaxation times for grade II versus grade III and grade III versus grade IV disks, with P < .001 and P < .001, respectively. Because of the small number of grade V disks, the difference between the nucleus pulposus region T2 relaxation times in grade IV and V was not tested for significance.
For the 44 Pfirrmann grade II disks, the nuclear region mean T2 relaxation time decreased from an average of 132 ms for patients in their 20s to 86 ms for those in their 60s (Fig 6). The decrease was significant (R2 = 0.46, P < .001) by least squares linear regression analysis.

Mean T2 relaxation times for the nucleus pulposus region of Pfirrmann grade II disks for each decade of life. Mean T2 relaxation times are calculated as the averages for those in their 20s, 30s, 40s, 50s, and 60s. The vertical bars represent the SD from the mean.
Discussion
In symptomatic patients referred for MR imaging, T2 relaxation times correlated with Pfirrmann grades for intervertebral lumbar disk degeneration. Relaxation times shortened significantly between Pfirrmann grade II and III disks as well as between grade III and IV disks. The correlation was significant statistically for both the whole disk region of interest and the nucleus pulposus region of interest. For this patient cohort, T2 relaxation times in the disk shortened with increasing patient age.
This study agrees well with other published studies of human in vivo and cadaver T2 relaxation times of healthy and degenerated disks. Kerttula et al1 measured the T2 relaxation times of healthy and degenerated in vivo thoracolumbar disks as 80 ± 19 ms and 59 ± 17 ms, respectively, close to our measurements of 91 ± 19 ms in Pfirrmann grade II disks to 51 ± 10 ms in Pfirrmann grade IV disks. In another study, the central region of normal human cadaver lumbar disks had a mean T2 relaxation time of 114 ± 33 ms, and degenerated lumbar human cadaver disks had a mean of 50 ± 18 ms,9 close to results of the nucleus pulposus region in this study. T2 relaxation times measured from axial T2 maps decreased with successive grade of degeneration and with age.14 The T2 relaxation times for Pfirrmann grade II, III, and IV disks in that study were substantially lower than our values, for reasons that are not clear, but different sampling of disk tissues and different grading criteria may have a role. By assigning grade I degeneration to disks in subjects older than 20 years of age and by including more disk tissue lateral to the sagittal section, Watanabe et al14 may have biased their data toward lower T2 relaxation times. In cadaver lumbar disks, T2 relaxation times have been reported to decrease with increasing grade of degeneration, measured by the Thompson system of grading.5,6 The decrease in T2 relaxation times with the stage of degeneration is associated with a decrease in water and glycosaminoglycan content in the disk.15–17
The inverse correlation of T2 relaxation time in the disk and patient age has been reported by Jenkins et al18 and Watanabe et al.14 We found a similar inverse correlation between age and relaxation time for grade II disks. In our study, the average T2 relaxation time decreased progressively by decades except for those in their 50s, probably due to small sample sizes. The age-related reduction in T2 relaxation time is associated with decreasing glycosaminoglycan and water content.19,20
The major limitation of this study was the lack of a criterion standard for staging disk degeneration. While the Pfirrmann grading system is used to classify disk degeneration, it has limitations. Readers in the original study of Pfirrmann et al11 did not agree in the grade assignment in 16% of disks, and in subsequent studies, readers have disagreed in a larger percentage of cases.21 In our study, readers disagreed in 25% of cases. A bias in our study resulting from the process of reaching consensus cannot be excluded, though readers were blinded to the T2 relaxation times when grading the disks and when reaching consensus. A selection bias in the enrollment of patients cannot be excluded; though selection was primarily based on logistics, no bias was apparent and no effect could be estimated. The manual selection of a region of interest for the central nuclear region may be a source of bias, especially when the central nuclear region was poorly differentiated from the peripheral annulus. No attempt was made to determine which disks were the source of patient symptoms and which were not. One report suggested that T2 relaxation times were lower in the lumbar disks that investigators determined were symptomatic disks than in the ones that they determined were not.3
Conclusions
This study shows that T2 relaxation times of lumbar intervertebral disks correlate with degenerative changes as determined by reference to MR images, and they correlate with age in normal-appearing disks. Providing a continuous measure rather than an ordinal one, the T2 relaxation times may have a role in evaluating lumbar disk aging and degeneration.
Footnotes
-
Paper previously presented in part at: 24th Annual Meeting of the North American Spine Society, November 10–14, 2009; San Francisco, California.
-
indicates article with supplemental on-line table.
References
- Received December 11, 2009.
- Accepted after revision February 1, 2009.
- Copyright © American Society of Neuroradiology
In this issue


Jump to section
Related Articles
Cited By...
- The relationship between acceleration during running at optimal speed and changes in the T2 times of the lumbar intervertebral disc
- Intervertebral Disc Elastography to Relate Shear Modulus and Relaxometry in Compression and Bending
- Variability of T2-Relaxation Times of Healthy Lumbar Intervertebral Discs is More Homogeneous within an Individual Than across Healthy Individuals
- We Need to Talk about Lumbar Total Disc Replacement
- T1{rho} and T2 Mapping of the Intervertebral Disk: Comparison of Different Methods of Segmentation
- Comparison of the T2 Relaxation Time of the Temporomandibular Joint Articular Disk between Patients with Temporomandibular Disorders and Asymptomatic Volunteers
- MR Imaging Assessment of Lumbar Intervertebral Disk Degeneration and Age-Related Changes: Apparent Diffusion Coefficient versus T2 Quantitation