
Abstract
BACKGROUND AND PURPOSE: The histogram method has been shown to demonstrate heterogeneous morphologic features of tumor vascularity. This study aimed to determine whether whole-tumor histogram analysis of the normalized CBV for contrast-enhancing lesions and perienhancing lesions can differentiate among GBMs, SMTs, and lymphomas.
MATERIALS AND METHODS: Fifty-nine patients with histopathologically confirmed GBMs (n = 28), SMTs (n = 22), or lymphomas (n = 12) underwent conventional MR imaging and dynamic susceptibility contrast-enhanced imaging before surgery. Histogram distribution of the normalized CBV was obtained from whole-tumor voxels in contrast-enhancing lesions and perienhancing lesions. The HW, PHP, and MV were determined from histograms. One-way ANOVA was used initially to test the overall equality of mean values for each type of tumor. Subsequently, posttest multiple comparisons were performed.
RESULTS: For whole-tumor histogram analyses for contrast-enhancing lesions, only PHP could differentiate among GBMs (4.79 ± 1.31), SMTs (3.32 ± 1.10), and lymphomas (2.08 ± 0.54). The parameters HW and MV were not significantly different between GBMs and SMTs, whereas the 2 histogram parameters were significantly higher in GBMs and SMTs compared with lymphomas. For the analyses of perienhancing lesions, only MV could differentiate among GBMs (1.90 ± 0.26), SMTs (0.80 ± 0.21), and lymphomas (1.27 ± 0.34). HW and PHP were not significantly different between SMTs and lymphomas.
CONCLUSIONS: Using a whole-tumor histogram analysis of normalized CBV for contrast-enhancing lesions and perienhancing lesions facilitates differentiation of GBMs, SMTs and lymphomas.
Abbreviations
- ANOVA
- analysis of variance
- AUC
- area under the ROC curve
- CBV
- cerebral blood volume
- CEL
- contrast-enhancing lesion
- GBM
- glioblastoma multiforme
- HW
- histogram width
- ICC
- intraclass correlation coefficient
- MV
- maximum value
- NPV
- negative predictive value
- PEL
- perienhancing lesion
- PHP
- peak height position
- PPV
- positive predictive value
- rCBV
- relative cerebral blood volume
- ROC
- receiver operating characteristic
- SMT
- solitary metastatic tumor
It is not the differential diagnosis but the clinical or histologic diagnosis that affects eventual outcome of patients and alters treatment planning.1,2 Patients with GBM usually do not require systemic work-up; however, patients with a metastatic tumor should undergo a systemic clinical and imaging work-up to identify the primary origin site and additional distant metastatic foci.2 Unlike other high-grade intracranial tumors, lymphoma is treated with combined high-dose chemotherapy and radiation therapy without surgery. Surgical intervention is usually limited to performing a biopsy to obtain tissue for a pathologic diagnosis.3–5 More important, when patients with lymphoma undergo steroid therapy to decrease intracranial pressure before a biopsy, the pathologic findings can be difficult to interpret and a definitive diagnosis cannot be established.6 However, differentiation of GBM, SMT, and lymphoma with conventional structural MR imaging alone remains challenging because the 3 intra-axial tumors often show a similar appearance on structural MR imaging.
It has been reported that GBMs show heterogeneous morphologic features of tumor capillaries7; however, the degree of neovascularity and permeability through tumor capillaries within a GBM can be variable. The vasculature of a metastatic tumor is similar to that of the original tumor.8 On the other hand, a central nervous system lymphoma does not usually show a prominent feature of neovascularization, though vascular abnormalities such as tumor invasion of endothelial cells and invasion even into the vessel lumen can often be seen. One of the most striking histopathologic features of lymphoma is the angiocentric growth pattern and widening of the perivascular space.6
Dynamic susceptibility contrast-enhanced imaging that provides noninvasive evaluation of tumor vascularity has been widely used to assess morphologic and physiologic information on brain tumor vascularity.9,10 The rCBV derived from dynamic susceptibility contrast-enhanced MR perfusion imaging can be used to identify and quantify areas of neovascularization and has been shown to correlate with the glioma grade.9–11 Most previous studies have used the localized region-of-interest method to determine the maximum rCBV value in the evaluation of brain tumor capillaries.9–12 However, this method has some inherent limitations. The selection of the maximum rCBV area within a glioma can be highly operator-dependent because qualitative detection of this area for quantification and differentiation of blood vessels and the tumor region can be challenging.13 Therefore, the development of a more objective method that simplifies the analysis may allow even inexperienced operators to obtain reproducible data. Recent published reports have introduced histogram analysis of rCBV values for glioma grading.13,14 Compared with the use of the localized maximum region-of-interest method, the histogram method has been reported to have higher interobserver agreement and comparable diagnostic accuracy.13,14 Moreover, this method could demonstrate heterogeneous morphologic features of tumor vascularity, which is the major histopathologic feature of a high-grade glioma. In addition, the method could be used to determine the maximum rCBV value.
In the present study, we have proposed the use of a semiquantitative analytic method for the determination of histogram parameters derived from the normalized rCBV, which can provide whole-tumor evaluation and requires a reasonable time for postprocessing and image analysis. Three histogram parameters were used for the differential diagnosis of solitary enhancing brain masses in contrast-enhancing and perienhancing T2 lesions. The HW represents the heterogeneous distribution of the degree of the normalized CBV within selected contrast-enhancing and perienhancing lesions. PHP is the normalized CBV value of maximum frequency. The MV has been shown to correlate with pathologic glioma grading and tumor microvessel attenuation.9–12 The purpose of this study was to determine whether semiquantitative whole-tumor histogram analysis derived from dynamic susceptibility contrast-enhanced imaging could differentiate GBMs, SMTs, and lymphomas.
Materials and Methods
Study Population
Our institutional review board approved this retrospective study, and the requirement for patient informed consent was waived. Between August 2006 and November 2009, we retrospectively reviewed the MR images of 74 patients with histologically proved GBMs, SMTs, and lymphomas. Five patients with multiple brain lesions, 5 patients with a clinical history of any therapy including steroid to the brain, and 2 patients with poor MR image quality were excluded. Finally 62 patients were enrolled in this study. All study patients underwent dynamic susceptibility contrast-enhanced imaging as well as conventional structural MR imaging before a surgical biopsy and/or resection. There were 33 male and 29 female patients, and their ages ranged from 15 to 73 years, with a mean of 46 years. An experienced neuropathologist performed the histopathologic evaluations. All tumors were pathologically proved by means of either a stereotactic resection (n = 37) or a stereotactically guided biopsy (n = 25), and tumors were classified in accordance with the revised World Health Organization system of brain tumors.15 Gross total or near-total resection of solitary contrast-enhancing tumors was performed in all patients with GBMs, 7 of 22 patients with SMTs, and 2 of 12 patients with lymphomas for a presumptive diagnosis of high-grade glioma.
MR Imaging Protocol
MR imaging was performed by using a 3T system (Achieva; Philips Healthcare, Best, the Netherlands) with an 8-channel sensitivity encoding head coil. Our conventional MR imaging protocol included the following sequences: transverse fast spin-echo T2-weighted imaging; transverse spin-echo T1-weighted imaging; conventional gradient-echo imaging (T2*-weighted); diffusion-weighted imaging; and contrast-enhanced transverse, sagittal, and coronal T1-weighted imaging. The parameters for these sequences were the following: transverse fast spin-echo T2-weighted images—TR/TE, 3000/80 ms; FOV, 20 cm; section thickness, 5 mm; matrix, 348 × 270; acquisition time, 1 minute 54 seconds; transverse spin-echo T1-weighted images— TR/TE, 475/10 ms; FOV, 20 cm; section thickness, 5 mm; matrix, 256 × 190; acquisition time, 3 minutes 42 seconds; and diffusion-weighted images: TR/TE, 3804/46 ms; FOV, 22 cm; section thickness, 5 mm; matrix, 128 × 126; acquisition time, 1 minute 17 seconds. Contrast-enhanced transverse, sagittal, and coronal spin-echo T1-weighted images (TR/TE, 450–495/10 ms; FOV, 20–22 cm; section thickness, 5 mm) were obtained after the administration of gadopentetate dimeglumine (Magnevist; Schering, Berlin, Germany; 0.1 mmol per kilogram of body weight).
Dynamic susceptibility contrast-enhanced imaging was performed with gradient-echo echo-planar sequences during the administration of a standard dose of 0.1 mmol/kg gadopentetate dimeglumine (Magnevist) per kilogram of body weight at a rate of 4 mL/s with an MR imaging−compatible power injector (Spectris; MedRad, Indianola, Pennsylvania). A bolus of contrast material was followed by a 20-mL bolus of saline, which was administered at the same injection rate. The detailed imaging parameters for dynamic susceptibility contrast-enhanced imaging were as follows: TR/TE, 1407/40 ms; flip angle, 35°; FOV, 24 cm; section thickness, 5 mm; intersection gap, 0 mm; and matrix, 128 × 128. The total acquisition time for this imaging was 1 minute 30 seconds. It was performed by using the same section orientations as those used for conventional MR imaging, which covered the entire tumor volume.
Dynamic Susceptibility Contrast-Enhanced Image Processing
Dynamic susceptibility contrast-enhanced and conventional MR imaging data were transferred from the MR imaging scanners to an independent PC for quantitative perfusion analysis. Perfusion parametric maps were obtained by the use of a dedicated software package (NordicICE; NordicNeuroLab, Bergen, Norway). An rCBV map was generated by use of an established tracer kinetic model applied to the first-pass data.16,17 To reduce the effects of recirculation, we fitted ΔR2* curves to a γ-variate function, which approximates the first-pass response as it would appear in the absence of recirculation. As described by a previous report,18 the dynamic curves were mathematically corrected to reduce contrast-agent leakage effects by using trapezoidal integration over the 120 acquired time points. After the elimination of recirculation and leakage of contrast agent, the rCBV was computed by numeric integration of the curve. On a pixel-by-pixel basis, the rCBV maps were normalized by dividing every rCBV value in a specific region of interest by an unaffected white matter rCBV value defined by a neuroradiologist. To minimize confounding factors in normalized CBV analysis, we kept the size of regions of interest constant (40 mm2). The normalized CBV maps were displayed as color overlays on postcontrast T1-weighted images.
Histogram Analysis
To assess the interobserver agreement, 2 experienced neuroradiologists independently defined regions of interest around the entire region of a contrast-enhancing lesion and perienhancing lesion in each section from coregistered postcontrast T1-weighted and T2-weighted images, respectively. For semiquantitative analysis, histogram parameter values of each region of interest drawn by each observer were measured and then averaged. Areas of contrast enhancement seen on the postcontrast T1-weighted images were used to define the outermost contrast-enhancing lesion margin, and high-signal intensity areas thought to represent tumor tissue or edema on the T2-weighted images were used to define the outermost perienhancing lesion margin. Areas of necrosis, cysts, or nontumor macrovessels evident on the postcontrast T1-weighted images were excluded. Regions of signal-intensity dropout caused by susceptibility on the echo-planar images and areas of necrotic, cystic, and macrovessel regions of a tumor were excluded from the regions of interest.
As described in previous studies,13,14 histograms were generated by classification of the normalized CBVs in each region of interest into a predefined number of bins. The interval between the minimum and maximum pixel values was divided into 108 equally spaced bins that showed the highest diagnostic performance in the previous study.13 The number of pixels corresponding to each bin was counted, and frequency counts were plotted as a function of the bin locations. The peak height was normalized by dividing each histogram frequency value by the total number of voxels in the sample. The range of normalized CBVs along the x-axis was kept constant (between zero and 10). The perfusion characteristics of the contrast-enhancing lesions and perienhancing lesions of all the intra-axial masses were assessed by the measurement of HW, PHP, and MV. The HW can be related to the heterogeneous morphologic features of tumor capillaries, the PHP is indicative of the rCBV value of maximum frequency, and the MV on a histogram shows true maximum normalized CBV values. Figure 1 demonstrates an example of HW, PHP, and MV in a contrast-enhancing lesion for a GBM.
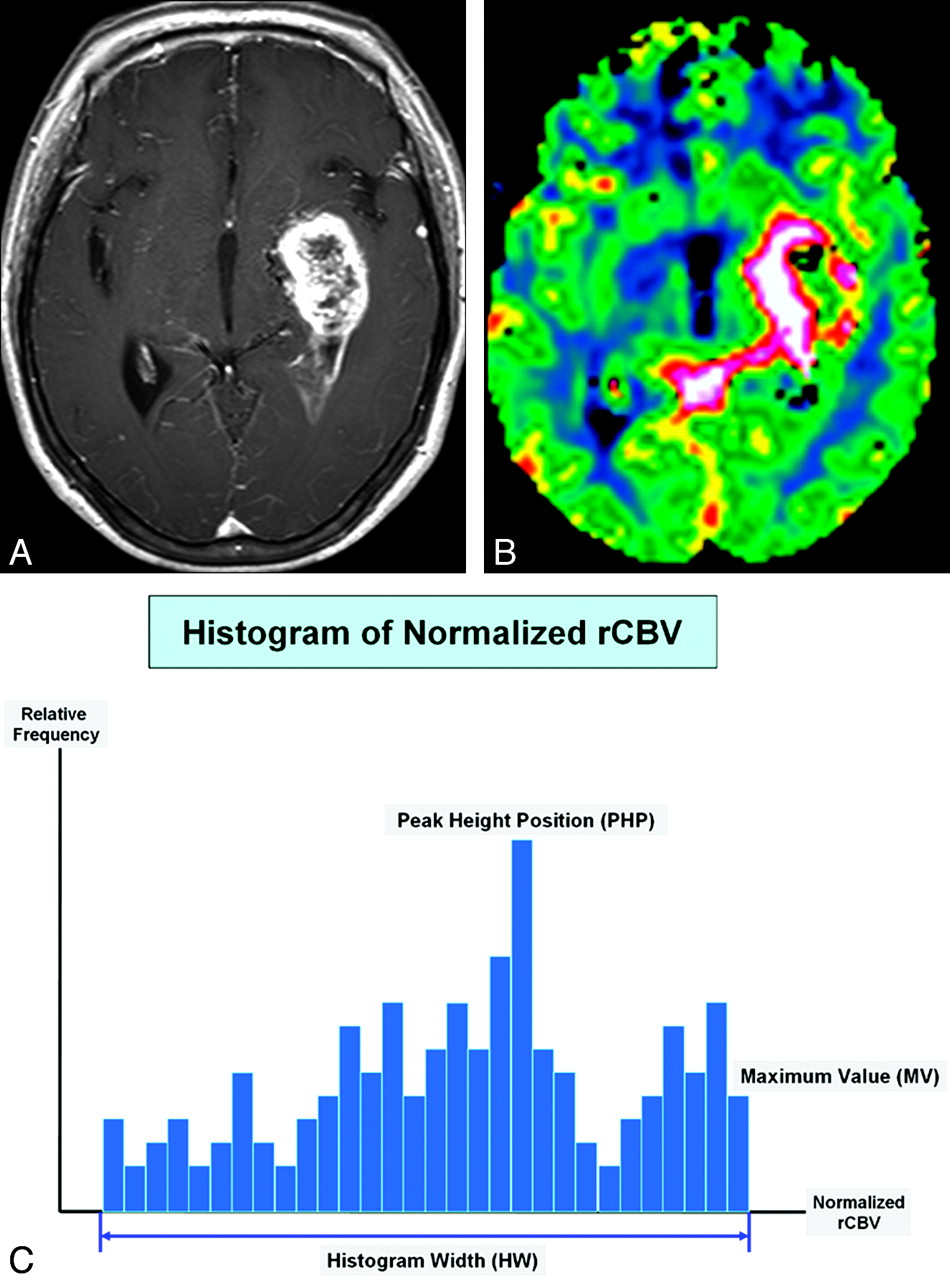
The schema of histogram distribution in a patient with GBM. A and B, Axial postcontrast T1-weighted image (A) and the normalized CBV map (B) show typical findings of GBM. C, Three histogram parameters are defined as HW, PHP, and MV.
Statistical Analysis
Data were initially assessed for normality with the Kolmogorov-Smirnov test. Based on these results, a 1-way ANOVA test was used to compare the values of histogram parameters among the 3 types of intra-axial tumors. The 1-way ANOVA test was initially used to test overall equality of medians for each type of tumor. When statistically significant differences occurred, posttest multiple comparisons were performed. The ICC was used to determine the levels of interobserver variability in the semiquantitative analysis of MR perfusion histograms. The Pearson product moment correlation was calculated to evaluate the relationship between region-of-interest volume of contrast-enhancing lesions or perienhancing lesions and histogram parameters. ROC curve analyses were performed to determine optimum thresholds and the diagnostic accuracy of each histogram parameter for discrimination of the 3 types of tumors. These analyses permitted the determination of the sensitivity, specificity, PPV, and NPV associated with each histogram parameter as a function of the threshold value used to discriminate the 3 types of tumors. The ICC, Pearson correlation, and ANOVA tests were analyzed by using the Statistical Package for the Social Sciences software (Version 13.0, SPSS, Chicago, Illinois), and the ROC curves were analyzed by using MedCalc for Windows (MedCalc Software, Mariakerke, Belgium). A level of significance of P < .05 for comparative measurements was used throughout the study.
Results
Visual Analyses of Histogram Parameters for the 3 Types of Tumors
The mean additional time for postprocessing of MR perfusion histograms, including coregistration and drawing of regions of interest, was 7 minutes 37 seconds. Among 22 patients with metastatic brain tumors, the primary lesions consisted of non-small cell lung cancer (n = 14), small cell lung cancer (n = 5), breast cancer (n = 2), and esophageal cancer (n = 1). For the visual analyses of histogram parameters for contrast-enhancing lesions of the 3 intra-axial tumor types, lymphomas showed a trend toward having a narrower HW, lower PHP, and lower MV compared with GBMs or SMTs. In the visual analyses of histogram parameters for perienhancing lesions, GBMs showed a trend toward having a wider HW, higher PHP, and higher MV compared with SMTs or lymphomas. A schematic illustration of semiquantitative histogram analyses of the normalized CBV for GBMs, SMTs, and lymphomas is shown in Fig 2.

MR images and dynamic susceptibility contrast-enhanced imaging histograms in patients with GBM (A), metastatic tumor (B), and lymphoma (C).
Semiquantitative Analyses of Histogram Parameters for Contrast-Enhancing and Perienhancing Lesions
Interobserver agreement was excellent for the semiquantitative analysis of all histogram parameters (ICC for HW, 0.86; ICC for PHP, 0.91; ICC for MV, 0.92). For the correlations of the regions-of-interest volume of contrast-enhancing and perienhancing lesions with the 3 histogram parameters, HW and MV were significantly correlated with the extent of contrast-enhancing and perienhancing lesions (HW, r = 0.456, P = .011; MV, r = 0.439, P = .037), whereas PHP was independent of the extent of contrast-enhancing and perienhancing lesions (r = 0.282, P = .087). The mean values ± SDs of HW, PHP, and MV for the 3 types of intra-axial tumors for contrast-enhancing lesions and perienhancing lesions are listed in Table 1, and the comparisons of these parameters among the 3 pathologic types are demonstrated in Fig 2.
Mean ± SD of histogram parameters for glioblastomas, metastatic tumors, and lymphomas
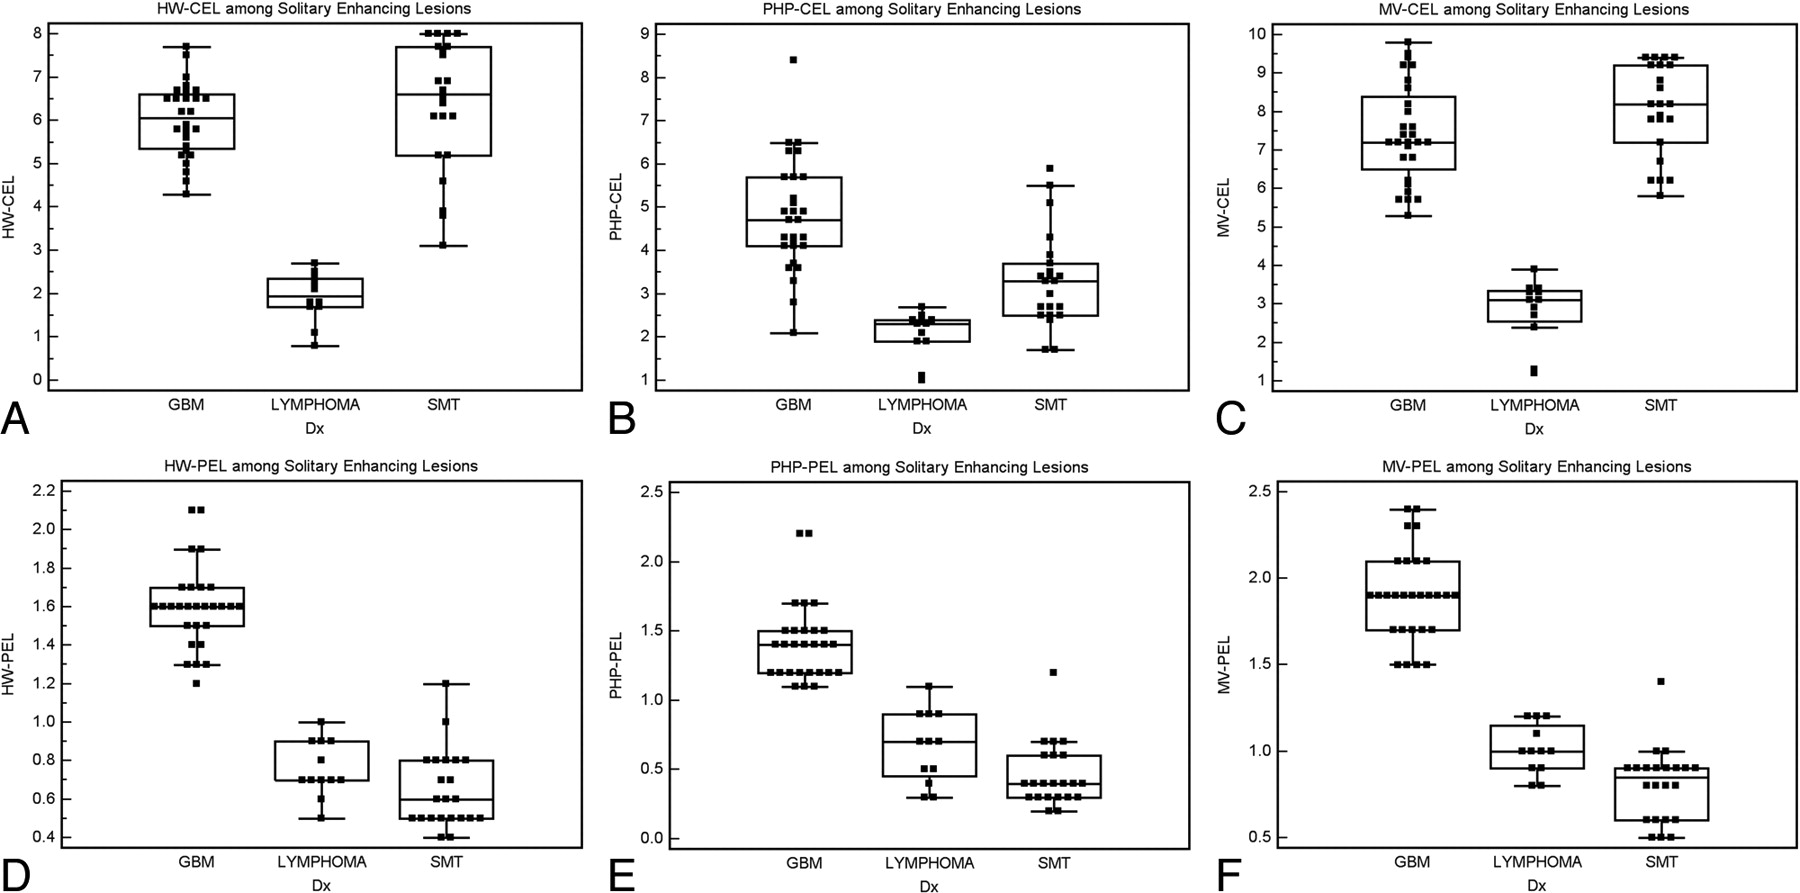
In whole-tumor histogram analyses for contrast-enhancing lesions, only the PHP could differentiate among GBMs, SMTs, and lymphomas. HW and MV were not significantly different between GBMs and SMTs, whereas the 2 histogram parameters were significantly higher in GBMs and SMTs compared with lymphomas. In an analysis of perienhancing lesions, only the MV could differentiate among GBMs, SMTs, and lymphomas. HW and PHP were not significantly different between SMTs and lymphomas (Fig 3). In Fig 2, examples of histogram distributions of GBMs, SMTs, and lymphomas are shown. P values for the comparison of the 3 intra-axial tumor types with respect to each histogram parameter are listed in Table 2.

Box-and-whisker plots of 6 histogram parameters for 3 pathologic groups of solitary enhancing brain lesions. A, HW in contrast-enhancing lesions. B, PHP in contrast-enhancing lesions. C, MV in contrast-enhancing lesions. D, HW in perienhancing lesions. E, PHP in perienhancing lesions. F, MV in perienhancing lesions.
P values for the differential diagnosis among glioblastomas, metastatic tumors, and lymphomas using each histogram parameter
ROC Curve Analyses for Histogram Parameters
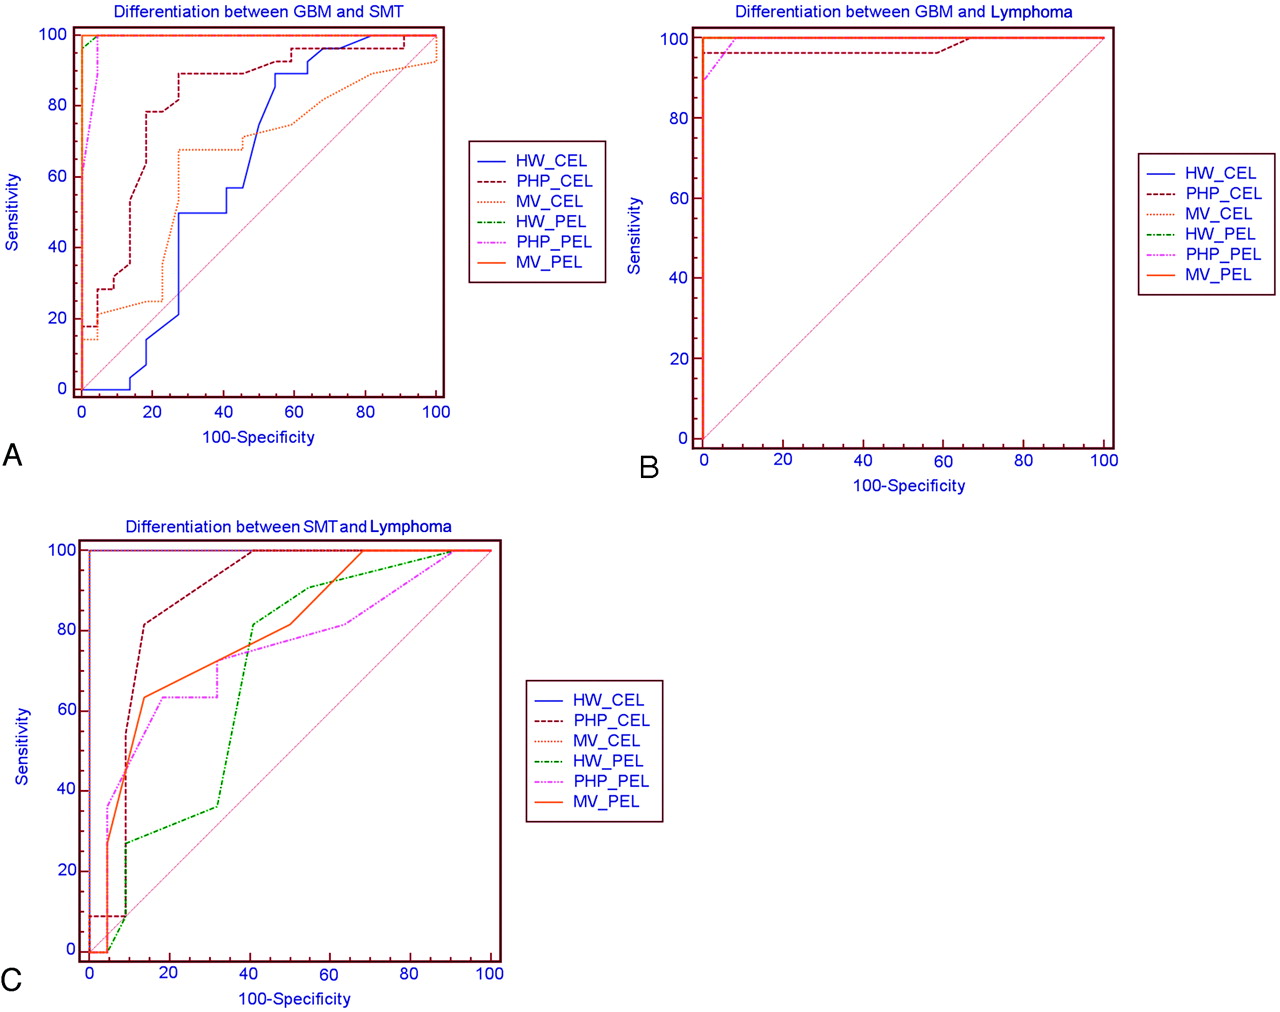
According to ROC curve analyses to distinguish GBMs and SMTs, the MV for perienhancing lesions showed the largest AUC (Fig 4A). MV for perienhancing lesions optimally helped to distinguish GBMs from SMTs with a sensitivity of 100% and a specificity of 100% at a cutoff value of 1.4. For the differential diagnosis between GBMs and lymphomas, HW and MV for contrast-enhancing lesions showed the largest AUC (Fig 4B). The MV for contrast-enhancing lesions helped to distinguish GBMs from lymphomas at a cutoff value of 3.9, and the HW for contrast-enhancing lesions optimally helped to distinguish GBMs from lymphomas at a cutoff value of 2.7. The MV for contrast-enhancing lesions had the largest AUC among the 6 histogram parameters to distinguish SMTs from lymphomas, but this finding was not significantly different compared with the HW for contrast-enhancing lesions (P=.083), though there was a trend toward significance (Fig 4C). The optimum threshold, sensitivity, and specificity of each histogram parameter to distinguish the 3 intra-axial tumor types are summarized in Tables 3–⇓5.

Comparison of ROC curves of 6 histogram parameters in the contrast-enhancing lesions and perienhancing lesions for differentiating GBM and SMT (A), GBM and lymphoma (B), and SMT and lymphoma (C).
Optimum threshold, sensitivity, and specificity of each histogram parameter for distinguishing glioblastoma from SMT
Optimum threshold, sensitivity, and specificity of each histogram parameter for distinguishing glioblastoma from lymphoma
Optimum threshold, sensitivity, and specificity of each histogram parameter for distinguishing SMT from lymphoma
Discussion
Our study has shown that semiquantitative histogram analysis of the normalized CBV was able to distinguish accurately among GBMs, SMTs, and lymphomas. The results are in concordance with the findings of a number of previous studies regarding the localized maximum rCBV.9–12 In this study, we used 6 histogram parameters derived from normalized CBV maps of dynamic susceptibility contrast-enhanced MR perfusion imaging to differentiate GBMs, SMTs, and lymphomas. We found that the MV for perienhancing lesions was the most significant parameter in the differential diagnosis of GBMs from SMTs. This result was comparable with the findings of Law et al12 and Cha et al.2 We also found that HW and PHP for perienhancing lesions could differentiate GBMs and SMTs with reasonable sensitivity and specificity. Observed peritumoral hyperperfusion in GBMs is consistent with the known infiltrative nature of gliomas, with the tumors extending beyond the margin of contrast enhancement to the perienhancing region of T2 signal intensity abnormality.12,19–21 A perienhancing lesion of a brain metastasis represents pure vasogenic edema that results from uncontrolled leakage of blood plasma into the interstitial compartment due to leaky capillaries.8,22 There have been very few studies regarding the utility of dynamic susceptibility contrast-enhanced histogram analysis for cerebral gliomas. We found 3 histogram parameters (HW, PHP, and MV) to be valuable metrics for hyperperfusion in perienhancing lesions, in keeping with increased angiogenesis that occurs beyond the contrast-enhancing portions of a tumor.12
For the analyses of contrast-enhancing lesions to differentiate GBMs from SMTs, previous studies have demonstrated that perfusion MR imaging could not be used to differentiate GBMs and SMTs reliably because both lesions are highly vascular tumors that demonstrate an increased rCBV.6,12 In the present study, only the PHP for contrast-enhancing lesions could differentiate the 2 tumor types. However, the pathologic background for this finding is not clear because unlike gliomas, histopathologic features of metastatic tumor vessels have not been established. Furthermore, the P value, sensitivity, and specificity of the PHP for contrast-enhancing lesions were not high; therefore, further studies including larger variances for individual tumor types are needed to improve the integrity of the cutoff values with higher confidence levels.
To differentiate lymphomas from GBMs or SMTs, all 3 histogram parameters were significant for contrast-enhancing lesion regions. Although there is moderate overlap of the PHP parameter for the contrast-enhancing lesion, particularly for differentiating SMT and lymphoma, PHP was the only histogram parameter that can significantly distinguish the 3 tumor types. In multiple comparison tests, MV and HW are the more significant parameters for differentiating lymphomas from GBMs or SMTs. However, in view of the differential diagnosis of solitary enhancing brain lesion, PHP can be a useful parameter. Although there are few published reports on dynamic susceptibility contrast-enhanced imaging characteristics of primary central nervous system lymphomas, our results are in accord with the findings of a previous pathologic report in which neovascularization was not a prominent feature for lymphomas, though tumor invasion of endothelial cells and even into the vessel lumen can often be seen.23 One of the most striking histopathologic features of a primary central nervous system lymphoma is the angiocentric growth pattern, in which tumor cells form multiple thick layers around the host vessels and widen the perivascular space.6 Our results for lymphoma are in concordance with the findings of previous MR perfusion studies for primary central nervous lymphoma.24,25 These studies showed that primary central nervous lymphomas tend to have low maximum CBV ratios. On the other hand, the percentage of signal-intensity recovery indicating contrast leakage showed discrepancy between the 2 previous studies.24,25 In our small population of lymphomas, this parameter was variable. However, it was not the main issue in this study, and more large-population studies should be performed to validate the above findings.
The HW for contrast-enhancing lesions probably reflects the heterogeneity of tumor angiogenesis and microvasculature. The higher value of the HW for GBMs in this study is similar to results of previous studies in which high-grade gliomas showed a trend toward having a higher SD compared with low-grade gliomas.13,14 Law et al14 have suggested that the histogram metric having the highest correlation with glioma grade was SD. Because SD is a measure of the dispersion of data around the arithmetic mean, increased SDs for high-grade gliomas could reflect heterogeneous tumor angiogenesis. In our study, the HW for contrast-enhancing lesions was also high for SMTs; however, the pathologic background should be established with larger population studies. The higher MV seen for contrast-enhancing lesions of GBMs is similar to results of previous studies for glioma grading using the maximum localized region-of-interest method, which have shown that the maximum value of the rCBV for gliomas correlates with the pathologic tumor grade.9–11 As shown in previous studies6,12 and our study, SMTs can have an equally high MV for contrast-enhancing lesions compared with GBMs. On the basis of our experience of perienhancing lesion histogram analysis, lymphomas showed variable values of the 3 histogram parameters; however, the histogram values were significantly lower than the corresponding values for GBMs.
In view of statistics, the PHP that indicates “mode” and the MV that indicates “maximum” are location statistics. The maximum is known to be a less accurate reflection of the location than the mode, so the finding that PHP might be a better discriminator than the MV is expected. However, the median is more accurate than the mode, and the mean is even more accurate than the median. The HW that indicates range is a measure of dispersion, as are the SD and interquartile range, which would be less dependent on the sample size. Nevertheless, we did not analyze mean, median, SD, or interquartile range in this study because we focused on quick semiquantitative histogram analysis based on the histogram shape rather than the detailed statistical value.
There are several limitations to this study. First, it included a small number of study patients. It would have been preferable to include more patients to strengthen the statistical power. Second, an obvious challenge with the use of the histogram method is identifying the appropriate perienhancing tumor portion region. The optimal definition of the entire tumor volume is complicated because gliomas are infiltrating tumors with indistinct borders beyond the radiologic margins.26,27 However, a previous study has shown that variations between observers caused by imperfect tumor delineation are relatively unimportant, given the large number of data points included in the histogram.13 Law et al14 have suggested that the confounding effect of lesion size can be a limitation for the use of SD in predicting the glioma grade. For total tumor measurements, it is conceivable that larger tumors will have a more prominent impact on the total tumor perfusion metrics compared with smaller tumors.
The issue of tumor size is much more complex because primary glial tumors are known to infiltrate the adjacent normal-appearing brain parenchyma.14 However, in the present study, the HW, which is a histogram parameter similar to SD, weakly correlated with lesion size. Third, when confined to the intravascular space, paramagnetic contrast agent produces signal-intensity loss in the extravascular space on T2-weighted scans. However, because this contrast agent is also an effective T1 relaxation enhancer, the susceptibility contrast signal-intensity loss can be masked by signal-intensity increase in regions where T1 effects are significant. This occurs in enhancing tumors, in which contrast agent extravasates into the interstitial space of lesions with significant blood-brain barrier breakdown. Although both nonlinear γ-fitting and numeric integration to the peak of the first-pass ΔR2 curve can reduce this effect by focusing on the early first pass, the entire first-pass curve is in principle contaminated by the T1 effect.18
In this study, we did not use an administration of a preload of contrast agent, which plays an important role in diminishing the T1 leakage effects that confound dynamic susceptibility-weighted contrast-enhanced data. As described in previous reports,6 our dynamic susceptibility contrast-enhanced imaging protocol for brain tumor used small-flip-angle methods to reduce sensitivity to T1 leakage effects. However, this method can result in poor tumor-brain relative CBV contrast. Finally, a limited variety of metastases was analyzed in this study. Most of the metastatic tumor pathologies in the present study were lung cancer. The possibility remains that metastases of different histopathologic origins can exhibit different values of histogram parameters. Further studies with a larger population and even distribution of tumor pathologies are necessary to validate the utility of histogram parameters to differentiate each intra-axial tumor.
Conclusions
Our results suggest that semiquantitative histogram analysis of the normalized CBV for whole contrast-enhancing and perienhancing lesions can be a useful objective diagnostic tool for differentiating among GBMs, SMTs, and lymphomas.
References
- Received December 18, 2009.
- Accepted after revision March 26, 2010.
- Copyright © American Society of Neuroradiology
In this issue


Jump to section
Related Articles
Cited By...
- Discrimination between Glioblastoma and Solitary Brain Metastasis: Comparison of Inflow-Based Vascular-Space-Occupancy and Dynamic Susceptibility Contrast MR Imaging
- Tumor-related Perfusion Changes in White Matter Adjacent to Brain Tumors: Pharmacodynamic Analysis of Dynamic 3T Magnetic Resonance Imaging
- Differentiation of Primary Central Nervous System Lymphomas and Glioblastomas: Comparisons of Diagnostic Performance of Dynamic Susceptibility Contrast-Enhanced Perfusion MR Imaging without and with Contrast-Leakage Correction
- Differentiation between Brain Glioblastoma Multiforme and Solitary Metastasis: Qualitative and Quantitative Analysis Based on Routine MR Imaging