
Abstract
BACKGROUND AND PURPOSE: Olfactory dysfunction is commonly associated with IPD. We here report the association of OB volume and OS depth with olfactory function in patients with PD.
MATERIALS AND METHODS: Morphometric analyses by using MR imaging and the Japanese T&T olfactometer threshold test were used to evaluate olfactory structure and function in 29 patients with PD and 29 age- and sex-matched healthy controls.
RESULTS: The olfactory recognition thresholds were significantly higher in patients with PD than in healthy controls (3.82 ± 1.25 versus 0.45 ± 0.65, P < .001). Olfactory atrophy with reductions in the volume of the OB (37.30 ± 10.23 mm3 versus 44.87 ± 11.84 mm3, P < .05) and in the depth of OS (8.90 ± 1.42 mm versus 9.67 ± 1.24 mm, P < .05) was observed in patients with PD but not in controls. Positive correlations between olfactory performance and OB volumes were observed in both patients with PD (r = −0.45, P < .0001) and in controls (r = −0.42, P < .0001). In contrast, there was no significant correlation between the depth of OS and olfactory function in either cohort.
CONCLUSIONS: The results provide evidence that early olfactory dysfunction in patients with PD may be a primary consequence of damage to the OB. Neuroimaging of olfactory structures together with the assessment of olfactory function may be used to identify patients with PD.
Abbreviations
- DWI
- diffusion-weighted imaging
- IPD
- idiopathic Parkinson disease
- OB
- olfactory bulb
- OS
- olfactory sulcus
- PD
- Parkinson disease
- SEM
- standard error of the mean
- SNpc
- substantia nigra pars compacta
- T&T
- Toyota and Takagi
Olfactory deficits are common in patients with IPD, occurring at about the same frequency as resting tremor.1–3 Between 70% and 90% of patients with PD have olfactory deficits independent of disease severity and duration.4,5 Olfactory dysfunction is thus the second most common feature of this disorder, following rigidity and akinesia.6 The high prevalence of olfactory dysfunction in patients with IPD suggests that IPD may actually be an olfactory disease.5,6 Recent neuropathologic advances suggest that the olfactory system is among the earliest brain regions involved in PD7 and olfactory deficits are associated with the presence of incidental Lewy bodies in the brains of decedents without parkinsonism or dementia during life.8 Results from postmortem studies revealed Lewy bodies in the OB9 but also in other brain regions related to olfaction, such as the anterior olfactory nucleus,10 the piriform cortex,11 the amygdaloid complex,12 the entorhinal cortex, and the hippocampal formation.12 A recent study demonstrated that olfactory dysfunction in PD is related to atrophy in olfactory-eloquent regions of the limbic and paralimbic cortices.13 These olfactory deficits have been linked to structural and/or functional changes at the level of the OB 9,12,14,15 and OS.16
There is evidence from numerous studies that MR imaging can be used to reliably evaluate the volume of the OB and the depth of OS.15–18 It has been suggested that analysis of OB volume might be helpful in differential and early diagnosis of PD.15,18 However, recent studies did not show significant differences in OB volume between patients with PD and healthy controls.15,18 These results are surprising in light of the significant decrease in dopaminergic neurons in the anterior olfactory nucleus, which is part of the OB.19 Moreover, the depths of the bilateral OS measured from the coronal view in MR imaging were not different between the patients with PD and control groups.16 Therefore, it was unclear whether OB structural changes are associated with olfactory dysfunction in PD.
This study, therefore, set out to assess the OB volumes and OS depths and their correlations with olfactory function in patients with PD and in healthy controls. Olfactory function was correlated with reductions in the volume of OB and the depth of OS in patients with PD. Therefore, neuroimaging of the olfactory structure together with the assessment of olfactory function may be relevant to PD diagnosis.
Materials and Methods
Subjects
A total of 30 patients with PD (15 men and 15 women; mean age, 61.7 years; range, 43–78 years) and 30 age- and sex-matched healthy controls (15 men and 15 women; mean age, 62.6 years, range, 42–81 years) were initially included in the study. The volume of the OB in the 19th patient with PD was more than the value of mean ± 3 SD, thus this sample and the matched control were excluded. Therefore, there were only 29 patients with PD and 29 healthy controls included for statistical analysis. All participants were recruited through the Department of Neurology at the University of Peking Union Medical College Hospital. Diagnoses were made according to the diagnostic criteria for PD.20 All of these patients were regularly evaluated in the outpatient department or during in-hospital stays. None of the healthy control subjects had a history of or signs of major neurologic or rhinologic disorders. Written informed consent was obtained from all participants. The study was approved by the Ethics Committee of the University of Peking Union Medical College Hospital and was performed according to the International Ethical Guidelines for Biomedical Research Involving Human Subjects.
Olfactory Threshold Test
The Japanese T&T olfactometer test kit (Takasago Industry, Tokyo, Japan) includes 5 odorants, including β-phenylethyl alcohol, cyclotene, isovaleric acid, γ-undecalactone, and scatole. Each odorant is evaluated at 8 levels (−2 to 5) with the exception of cyclotene, which is evaluated at 7 (−2 to 4). This test kit was used to determine detection and recognition thresholds for each of the odorants to evaluate bilateral olfactory ability and the degree of smell impairment as previously described.21 The detection threshold was defined as the lowest concentration detectable by the subject, whereas the recognition threshold was defined as the lowest concentration at which the odor can be identified. The testing process is a stepwise procedure, in which odorant concentrations are increased or decreased on the basis of the subject's responses. The detection and recognition thresholds for the 5 odorants were averaged for each subject, and the values were used to evaluate the olfactory acuities.
MR Imaging
MR imaging was performed by using a 3T system (Signa VH/i Excite II 3T; GE Healthcare, Milwaukee, Wisconsin) with a standard quadrature head coil to detect the OB anatomy as described previously.22,23 Coronal T1-weighted or T2-weighted spin-echo sequences were performed with the following parameters: 600/20 ms (TR/TE); section thickness, 3 mm; matrix, 256 × 256; FOV, 120 × 120 mm; and the in-plane pixel resolution, 0.47 × 0.47 mm. Sections were angulated perpendicular to the anterior base of skull or cribriform plate. The observed region started at the frontal paranasal sinus and ended dorsally behind the crura cerebri. Entire brains were imaged with a T1-weighted 3D magnetization-prepared rapid acquisition of gradient echo imaging sequence with the following parameters: 9.7/4 ms (TR/TE); flip angle, 12°; and isotropic voxels, 1.0 × 1.0 × 1.0 mm. Multiplanar reformation was conducted in 3 orthogonal planes. Saggital T2-weighted sequences were also performed.
Imaging Data Analyses
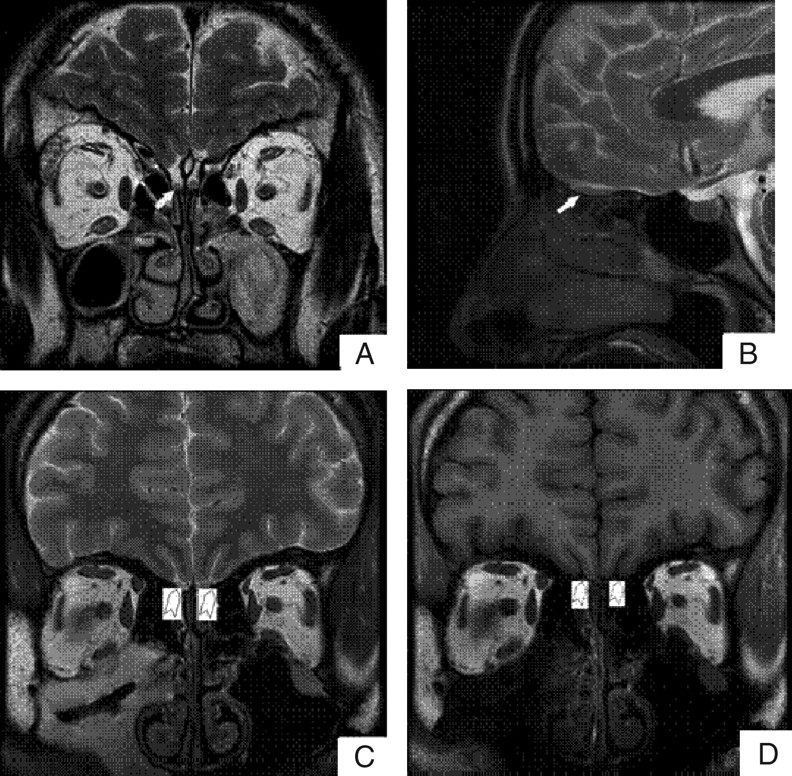
Acquired datasets were transferred to a workstation (GE Advantage Windows 4.2). Volume and depth measurements were performed by an experienced radiologist by manual segmentation of the coronal sections through the OBs. The OB and OS were manually measured by using routine coronal T1-weighted MR imaging sections (Fig 1). The boundaries of the OB were determined by using the surrounding CSF and the anterior cribriform plate as markers. The bilateral volume of the OB and the depth of the OS were measured in all study subjects. Because there may be differences between left- and right-sided OB volumes and OS depth,22–24 we used the maximum volume of the OB and depth of the OS in each individual for the analysis. The OB volume was expressed in cubic millimeters by calculating the in-plane area and the thickness of the OB. All the measurements were done by an individual who was blinded to diagnoses.

Visualization of the OB and the OS on representative MR images. Coronal (A) and sagittal (B) views of the brain show the OB (white arrows). Coronal T2-weighted (C) and T1-weighted (D) images show the OS (white arrowhead).
Statistical Analyses
Data were expressed as mean ± SEM. The various measures were assessed by using the Statistical Package for the Social Sciences, Version 11.5 (SPSS, Chicago, Illinois). Differences between patients with PD and healthy controls were analyzed by a paired-samples t test. Relationships among olfactory function, the volume of OB, and the depth of OS were examined by using Pearson correlation coefficients. Values of P < .05 were assumed to be statistically significant.
Results
Olfactory Function Decreased in Patients with PD Compared with Healthy Controls
Several tests have been used for olfactory assessment, including tests of odor identification, detection, discrimination, memory, suprathreshold odor intensity, and pleasantness perception. Previous studies have demonstrated that the test-retest reliability was equivalent for the T&T olfactometer and the University of Pennsylvania Smell Identification Test.25,26 In this study, we used the T&T olfactometer to evaluate the olfactory performance. As shown in Fig 2, the means of recognition thresholds were significantly higher in patients with PD than in control subjects (3.82 ± 1.25 and 0.45 ± 0.65 respectively; t = 14.59, P < .0001).

T&T olfactometer threshold tests in patients with PD and in healthy controls. The means of recognition thresholds are significantly higher in patients with PD than in control subjects. Data are expressed as means ± SEM.
OB Volume and OS Depth Lower in Patients with PD Compared with Controls
Numerous studies have demonstrated that OB volume assessed by MR imaging is correlated to olfactory function in healthy subjects and in patients with pathologic conditions.27 MR imaging was used to compare the structures of the OB and the OS in patients with PD and healthy controls. As shown in Fig 1, the OB and OS could be seen by using both T1-weighted and T2-weighted imaging sequences. Quantitative analyses showed that the volume of the OB varied from 26 to 90 mm3, with a mean of 44.87 ± 11.84 mm3, in the control group (Fig 3). In contrast, the patients with PD had mean OB volume of 37.30 ± 10.23 mm3, which was statistically different from that of the controls (t = 2.98, P < .01). The mean depth of the OS was statistically smaller in patients with PD than in control subjects (8.90 ± 1.42 mm and 9.67 ± 1.24 mm, respectively; t = 2.32, P < .05).

OB volume (A) and OS depth (B) in patients with PD and in healthy controls. The mean OB volumes and the mean OS depths are statistically smaller in patients with PD than in control subjects. Data are expressed as means ± SEM.
Correlations among Olfactory Function, OB Volume, and OS Depth
As shown in Fig 4, the volume of the OB correlated positively with odor recognition threshold scores as obtained by T&T olfactometry in both patients with PD and in controls, (r = −0.448 and P < .0001 for patients with PD; r = −0.420, P < .05 for controls). In contrast, there was not a significant correlation between the depth of the OS and olfactory performance in either cohort (r = −0.045, P = 0.81 for patients with PD; r = −0.09, P = .61 for controls).

Correlation of the volume of OB with olfactory performance in patients with PD (A) and in healthy controls (B). In patients with PD and in controls, the OB volumes correlate positively with odor recognition threshold scores.
Discussion
Although most patients with PD have olfactory deficits,1,2,13,18,19,28 the pathologic mechanism is unknown. The present study indicated that there was atrophy of the olfactory system in the patients with PD, as shown by lower OB volume and OS depth compared with healthy controls. Most important, the OB volume correlated positively with olfactory dysfunction in patients with PD. This will provide insight into the critical interplay of olfactory functional loss and structural abnormalities in PD.
Idiopathic PD is traditionally considered a movement disorder, with hallmark lesions located in the SNpc. However, recent histopathologic studies suggest the possibility that PD is a multisystem disorder that progresses in a predictable sequence as described in the staging criteria of Braak et al.12,29 The disease process starts in the dorsal motor nucleus of the vagus and anterior olfactory nucleus and bulb and spreads through the brain stem nuclei to ultimately reach the SNpc, progressing through stages 1, 2, and 3.30 Early diagnosis of PD in stages 1 and 2, when degenerative changes have not yet reached the SNpc, may allow progression of the disease to be halted or delayed. Braak et al29,31 and Hawkes et al32 found that the initial changes in stage 1 of the disease start simultaneously in the dorsal nucleus of the vagus nerve and in the olfactory nucleus and bulb where the olfactory neuroepithelium is in the entry zone. It is possible that initial changes in the olfactory nucleus and bulb may contribute to the early loss of olfactory function observed in patients with PD.
The early diagnostic procedures incorporating olfactory evaluation such as the University of Pennsylvania Smell Identification Test33 are already used. To further diagnose the nature of the olfactory deficit, MR imaging can be used.13,15–18 A recent DWI study confirmed disruption of the olfactory tract in patients with early stages of PD,34 and DWI would add an observer-independent and quantitative measure of symptoms in at-risk subjects. More recently, a morphometric analysis of MR imaging, called voxel-based morphometry, was used to investigate gray matter atrophy related to psychophysically measured scores of olfactory function in patients with early PD, patients with moderately advanced PD, and age-matched healthy controls.13 The results provided first evidence that olfactory dysfunction in PD is related to atrophy in olfactory-eloquent regions of the limbic and paralimbic cortex.
Recently, several studies have been set out to investigate the structural changes at the level of the OB and OS in patients with PD.15–18 The OB ends with the olfactory tract and is closely related to the OS of the frontal lobe. The OB collects the sensory afferents of the olfactory receptor cells located in the olfactory neuroepithelium. It has been shown that OB volume decreases with the duration of the olfactory loss.27 However, comparison of OB volumes did not yield significant differences between patients with PD (n = 11) with anosmia and healthy normosmic controls.15 Support for the results of a nonsignificant difference in OB volume between patients with PD and controls comes from reports by Mueller et al18 and Huisman et al,9 though there were only 11 and 10 patients with PD in these studies, respectively. In the present study, 29 patients with PD and 29 age- and sex-matched healthy controls were included, providing more statistical power. Because olfaction may be processed predominantly in the right hemisphere,23,35,36 both sides of each individual were measured, and the greater OB volume was used in our analysis, in which we observed significant differences in OB volume between patients with PD and controls. In addition, the OS depth was significantly smaller in patients with PD than in controls; this result differed from that of another study in which no difference in OS depth was found between patients with PD (n = 42) and controls.16 Therefore, further studies of more subjects are needed.
Our study using the T&T olfactometer threshold test confirmed that patients with PD experience olfactory loss, consistent with previous studies.2,19 The correlation of olfactory function with volume of the human OB has been established.24,37 In this study, a positive correlation between olfactory deficit and OB volume was found both in patients with PD and controls. It may be that olfactory dysfunction in PD is related to loss of olfactory neurons or disrupted input to the OB. We found no correlation of olfactory performance and OS depth, indicating that olfactory loss does not parallel the structural changes to the OS in patients with PD. Together, these data support the idea that olfactory loss in the earliest stages of PD (stage 1 according to Braak et al12) is not a consequence of damage to the OS but rather results from OB atrophy.
Conclusions
In summary, the present study was performed with a large sample size, well-validated test instruments, standardized neurologic examinations, and published diagnostic criteria. The results provide evidence that olfactory impairment is a valuable biomarker for PD. Olfactory testing together with neuroimaging of olfactory structures may provide a simple and relatively economic means of identifying individuals at high risk for development of PD.
Acknowledgments
We thank Medjaden Bioscience Limited for assisting in the preparation of this article.
Footnotes
-
Jian Wang and Hui You contributed equally to this work.


References
- Received May 11, 2010.
- Accepted after revision September 7, 2010.
- Copyright © American Society of Neuroradiology
In this issue


Jump to section
Related Articles
Cited By...
- SAHVER: Subarachnoid Hemorrhage Volumetric Expediting Resolution
- Usefulness of Olfactory Bulb Measurement in 3D-FIESTA in Differentiating Parkinson Disease from Atypical Parkinsonism
- Functional Activity, Functional Connectivity and Complex Network Biomarkers of Progressive Hyposmia Parkinsons Disease with No Cognitive Impairment: Evidences from Resting-state fMRI Study
- Effect of Physical Activity on Olfactory Acuity: A Systematic Review
- IMPAIRED OLFACTORY NETWORK FUNCTIONAL CONNECTIVITY IN PARKINSONS DISEASE: A NOVEL MARKER FOR DISEASE PROGRESSION
- Olfactory Bulb Signal Abnormality in Patients with COVID-19 Who Present with Neurologic Symptoms
- Diagnostic Accuracy of MRI-Based Morphometric Parameters for Detecting Olfactory Nerve Dysfunction
- MR Imaging-Based Evaluations of Olfactory Bulb Atrophy in Patients with Olfactory Dysfunction