
Abstract
BACKGROUND AND PURPOSE: LA is a condition caused by chronic cerebral ischemia and it represents an independent risk for stroke. The purpose of this work was to determine whether CAWT studied by using MDCTA is correlated with LA and its severity.
MATERIALS AND METHODS: Ninety-eight patients ≥60 years of age were retrospectively studied by using multidetector row CT. Supra-aortic vessel analysis and brain CT were performed in the same procedure. In each patient, CAWT was measured with an internal digital caliper, and the presence and severity of LA were assessed. Correlation coefficients by using Spearman statistics and ROC curves were calculated. A P value < .05 was considered statistically significant.
RESULTS: Measurements of the distal common CAWT ranged from 0.5 to 1.53 mm. A correlation between LA and increased CAWT was observed (Pearson correlation, 0.33; P < .001). On the basis of a threshold of 0.9 mm, an important statistical association between increased CAWT and LA (P < .0001) was found. With the same threshold, ROC curve analysis indicated a sensitivity of 55% and a specificity of 75% for LA.
CONCLUSIONS: The results of this study show a statistically significant correlation between increased CAWT and LA (and its severity).
Abbreviations
- CAD
- coronary artery disease
- CAWT
- carotid artery wall thickness
- CD-US
- color Doppler ultra-sonography
- CI
- confidence interval
- CTA
- CT angiography
- ICA
- internal carotid artery
- IMT
- intima-media thickness
- LA
- leukoaraiosis
- LR
- likelihood ratio
- MDCTA
- multidetector-row CT angiography
- OR
- odds ratio
- ROC
- receiver operating characteristic analysis
- SE
- standard error
- TIA
- transient ischemic attack
- US
- ultra-sonography
The term “LA,” first used by Hachinski et al,1 indicates the presence of patchy areas of low attenuation in the periventricular white matter. This condition is a common feature of the aging brain and is frequently seen in patients with hypertension, gait abnormalities, depression, and dementia.2–6 Moreover, LA represents an independent risk factor that can be used to predict future stroke.7–9 This condition is probably caused by chronic cerebral ischemia, but its pathogenesis and clinical significance are incompletely understood.10 Several articles suggested an association between carotid atherosclerosis and LA.11–13
Sonography is a widely used noninvasive technique for imaging the carotid arteries and investigating the atherosclerotic processes that may affect the carotid arteries.14–16 One of the most commonly used parameters for evaluating carotid atherosclerosis by using US is the IMT, which represents the quantification of the intima-media layers of the carotid artery.17 IMT is correlated with systemic atherosclerosis and predicts the risk of recurrent strokes.18–20
Recently published articles21,22 suggested that MDCTA can evaluate the thickness of the carotid artery wall, referred to by Saba et al21 as CAWT, and presented results indicating significant agreement between MDCTA and CD-US in the measurement of CAWT and IMT.22
The purpose of this work was to investigate whether CAWT studied by using MDCTA is correlated with LA and its severity.
Materials and Methods
Patient Population
We created a data base from retrospective case material from our institution and then searched the data base prospectively as a hypothesis-driven scientific study. Inclusion criteria were ≥60 years of age and previous MDCT imaging of the brain and carotid arteries performed at the same sitting, whereas exclusion criteria were other possible causes of white matter hypoattenuation, such as multiple sclerosis, vasculitis, acute disseminated encephalomyelitis, or connective tissue diseases.23
From August 2009 to March 2010, 98 patients (65 men, 33 women; mean age, 72 years; age range, 60–82 years) met the above-mentioned criteria in our university hospital and were selected for the study.
Each patient underwent MDCTA for suspected carotid artery pathology. The inclusion criteria for performing MDCTA in our institution have previously been published11,14,21,22 and are as follows: the presence of an US examination that showed a pathologic stenosis and/or a plaque alteration, or US being unable to provide sufficient information about the degree of stenosis and plaque type—for example, in the presence of large calcified plaques with acoustic shadowing, high carotid bifurcation, or a thick neck (edema, patients with obesity). With US, plaque alteration was considered as the presence of a heterogeneous plaque, an irregular surface, intraplaque hemorrhage, and/or ulceration in the plaque. Exclusion criteria for the MDCTA examination were a known allergy to iodinated contrast material or elevated renal function tests.
Demographic details, including age, sex, and risk factors (hypertension, diabetes, coronary artery disease, dyslipidemia, and tobacco use) were recorded.
This retrospective review evaluated existing clinical data and records. No additional procedures were performed. The review was conducted in accordance with the guidelines of the research committee of our institution.
Classification of Cerebrovascular Symptoms
Patients were classified as symptomatic or asymptomatic according to the neurologic assessment documented in the clinical chart review. A patient with a TIA or stroke was considered as “symptomatic.” TIA was regarded as an episode of neurologic dysfunction, such as hemiparesis, hemiparesthesia, dysarthria, dysphasia, or monocular blindness for <24 hours. If the episode of neurologic dysfunction exceeded 24 hours, it was classified as a stroke. The time window for inclusion in the symptomatic group was 6 months; when a patient underwent an MDCTA examination >6 months after the TIA/stroke event, he or she was excluded from the symptomatic group and included in the asymptomatic group. A patient who had no current history of symptoms or who had a remote (>6-month) history of symptoms at the time of examination was considered “asymptomatic.” In our institution, the carotid arteries of asymptomatic patients are studied if the patient has diabetes and is >50 years of age and if the patient has undergone a cardiac intervention for coronary artery disease, an aortic intervention, or lower leg artery surgery.
Cardiovascular Risk Factors
Cardiovascular risk factors and coexisting comorbidities and treatment known before stroke or TIA are systematically recorded in our institution as described previously.11,14,21,22 In this study, we considered the following parameters: CAD, high blood pressure, dyslipidemia, diabetes, and cigarette smoking status. Diabetes was indicated by an abnormal fasting plasma glucose level (>7.9 mmol/L) or the current use of insulin or an oral hypoglycemic agent. Cigarette smoking status was categorized as never or current (if the patient had stopped in the last 24 months, he or she was considered a current smoker). “Dyslipidemia” was defined as abnormal fasting plasma cholesterol (low-attenuation lipoprotein cholesterol) levels (fasting cholesterol >5.0 mmol/L) or the current use of lipid-lowering agents. CAD was diagnosed in the presence of the following: 1) visible luminal narrowing of coronary arteries documented by coronary angiography or MDCTA, 2) a previous history of myocardial infarction, or 3) previous coronary interventional/surgical procedures. “Essential hypertension” was defined as a systolic blood pressure of >140 mm Hg and/or a diastolic blood pressure of >90 mm Hg or the current use of blood pressure−lowering drugs.
MDCTA Technique
All patients underwent MDCTA of the supra-aortic vessels by using a 16-detector multidetector-row CT system (Brilliance; Philips Healthcare, Best, the Netherlands). A basal scan was obtained and was followed by the angiographic phase in which 80 mL of contrast medium (iomeprol, Iomeron 400; Bracco, Milan, Italy) was injected into a cubital vein, by using a power injector at a flow rate of 5 mL/s and an 18-ga intravenous catheter. A bolus-tracking technique was used to calculate the correct timing of the scan. Dynamic monitoring scanning began 6 seconds after the beginning of the intravenous injection of contrast material. The trigger threshold inside the region of interest was set at +80 HU above the baseline. The delay between the acquisition of each monitoring scan was 1 second. When the threshold was reached, the patient was instructed not to breathe, and after an interval of 4 seconds, the scan was started in the caudocranial direction. CT technical parameters included the following: matrix 512 × 512; FOV, 14–19 cm; mAs, 180–200; kV, 120–140; section thickness, 1 mm; increment, 0.5 mm. The window level was preset according to Saba and Mallarini.24,25 Angiographic acquisition included the carotid siphon. None of the patients included in the study had a medical history of cardiac output failure or any contraindications to iodinated contrast media.
MDCTA of the Brain
CT brain studies were performed with the same scanner used for carotid analyses (Philips Brilliance). Acquisitions were performed before and after injection of contrast material from the base of the skull to the vertex. CT technical parameters included the following: matrix, 512 × 512; FOV, 25 cm; mAs, 320–340; 120–140 kV; section thickness, 2 mm; increment, 1 mm.
Analysis of Carotid Artery and CAWT
The degree of stenosis of each carotid artery was measured by using the North American Symptomatic Carotid Endarterectomy Trial criteria.26–28 The degree of stenosis was calculated by selecting a reformat plane perpendicular to the lumen centerline. Particular attention was paid to avoid the key calculation pitfalls of percentage stenosis: The first step was to recognize near-occlusion (in this case, attempts to calculate a percentage may be fallacious), which was identified by 2 criteria: 1) evidence of narrowed poststenotic ICA, and 2) a poststenotic ICA that was similar to or smaller than the ipsilateral external carotid artery. Second, we measured the diameter of the normal ICA wall beyond the bulb where the walls were parallel,26–28 4–6 cm distal to the plaque. Each carotid stenosis received the following grades: I, normal; II (1%–39%), mildly stenosed; III (40%–69%), moderately stenosed; IV (70%–99%), severely stenosed; and V, occluded.
CAWT, as indicated by Saba et al,22 and Fanning et al23 was measured at its thickest point on the distal (far) wall of the common carotid artery, where there was no evidence of plaque,29 2 cm proximal to the bulb. This distance was necessary because if the wall is measured close to a plaque, it should be thicker. Three measurements were performed at the 6, 9, and 12 o'clock positions for each carotid artery (Fig 1). We measured CAWT between the leading edge of the opacified lumen vessel and the external visible limit of the artery wall, where it was surrounded by adjacent adipose tissue. The individual subject's mean common carotid CAWT values were then obtained by averaging the values obtained for each carotid artery.

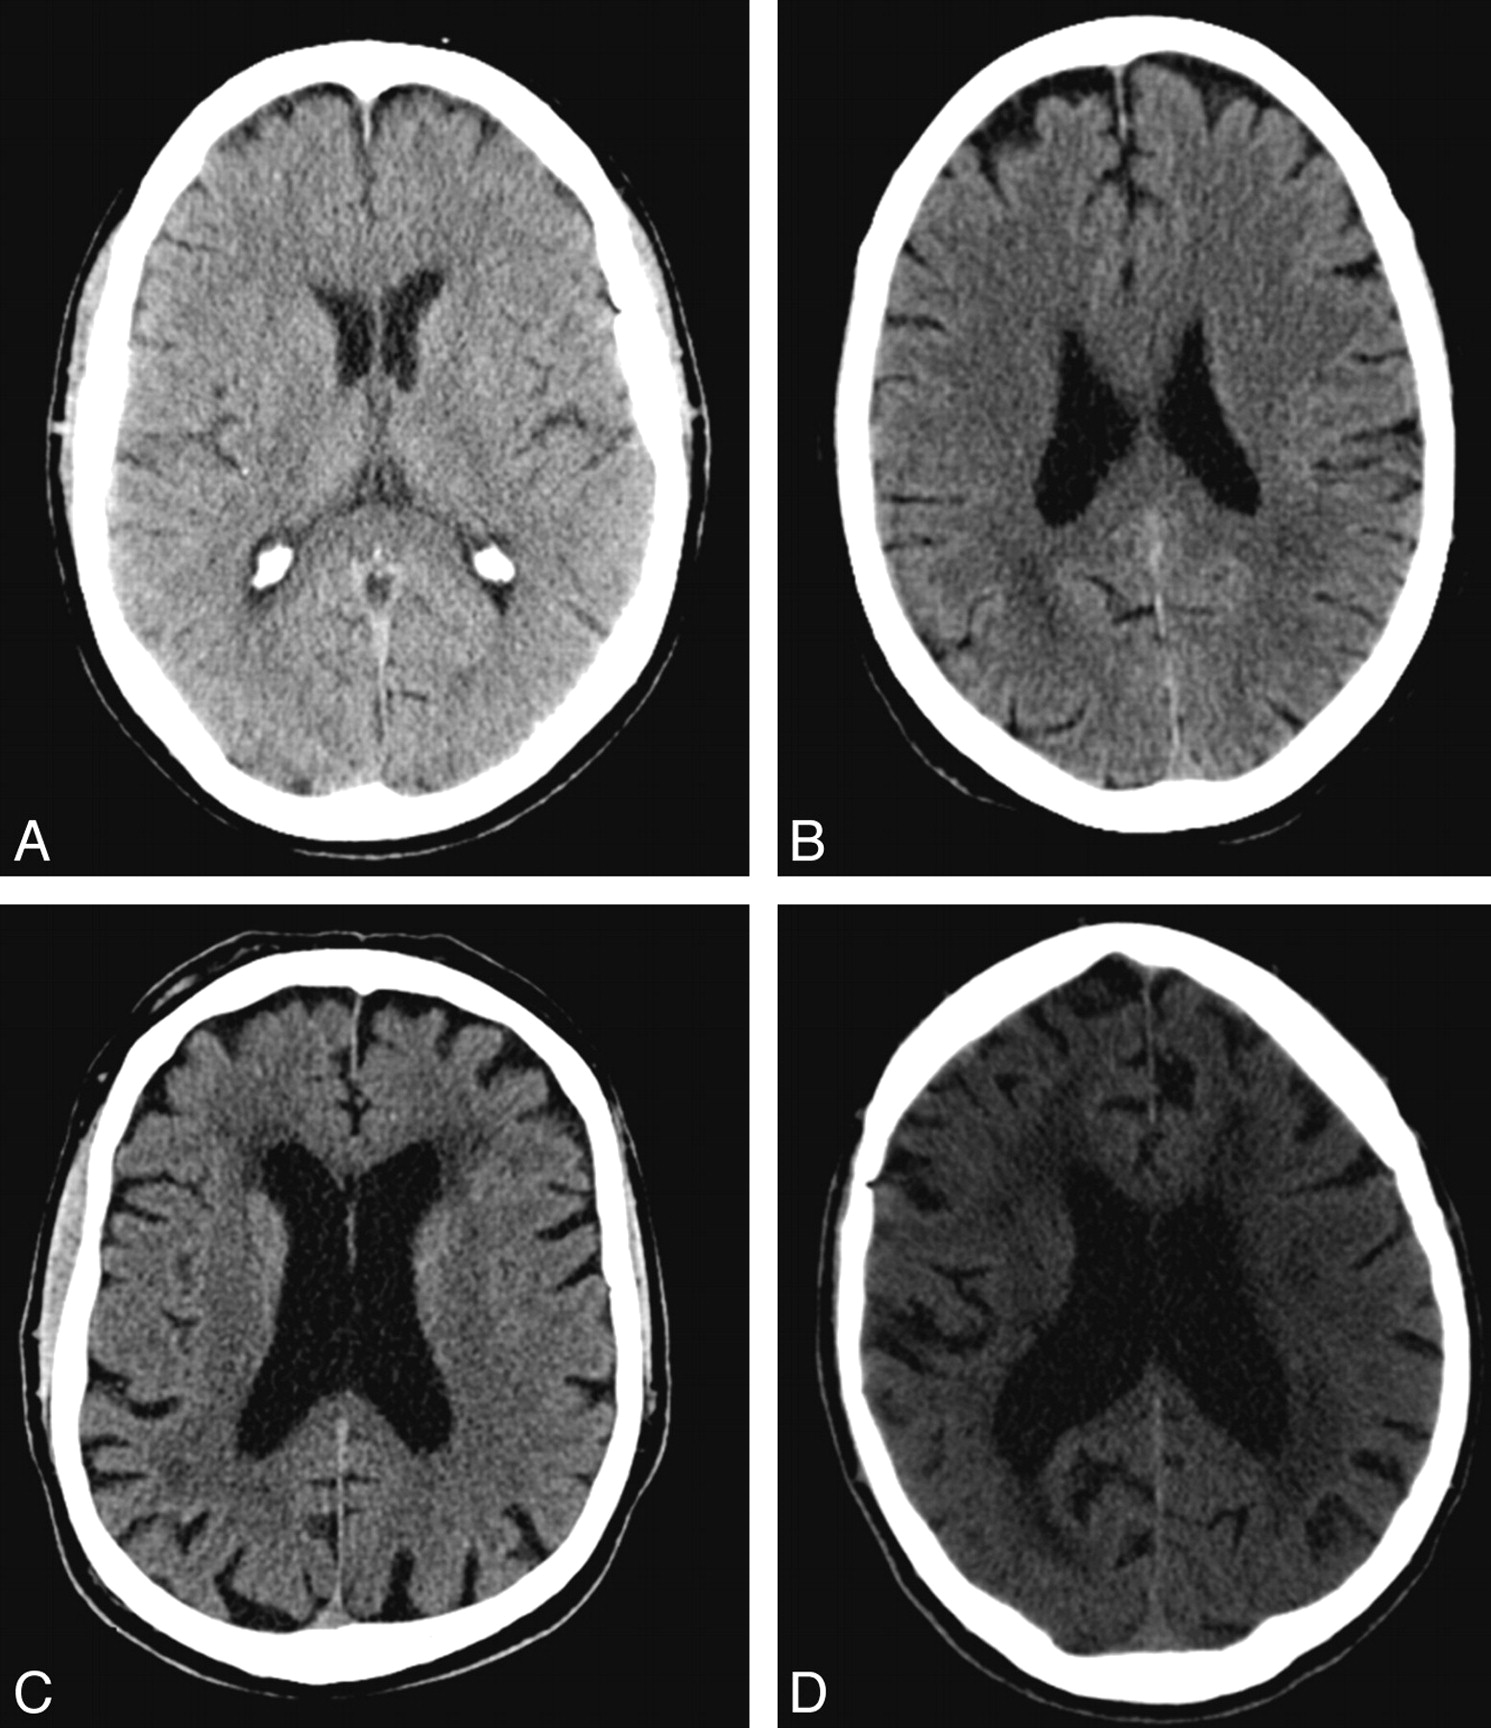
Examples of LA. A, Grade 0. B, Grade 1. C, Grade 2. D, Grade 4.
To perform logistic regression analyses, we also analyzed the type of plaque. For the measurement of Hounsfield unit attenuation, a circular or elliptic region-of-interest cursor was used in the predominant plaque area; those areas showing contamination by contrast material or beam hardening were carefully avoided. We used the classification proposed by de Weert et al30–32: “fatty” (soft) plaque was a plaque with an attenuation <60 HU; “mixed (intermediate) plaque” was a plaque with an attenuation between 60 and 129 HU; and “calcified plaque” was a plaque with a attenuation of >130 HU.
Analysis of Brain MDCT
MDCT images of the brain were analyzed by reviewers who were blinded to the patient's demographic details, and 2 experienced radiologists quantified the white matter scores and resolved any differences by consensus. In this study, the hemispheric white matter score and corresponding ipsilateral carotid characteristics—degree of stenosis and type of plaque—were considered as a single unit of analysis.11,23 Therefore 196 carotid-hemisphere units were analyzed.
For white matter assessment, we used a visual scale for the severity of white matter change based on the European Task Force on Age-Related White Matter Changes.33 We used a 4-point grading scale as follows: 0, no lesions; 1, focal lesions >5 mm; 2, early confluent lesions; and 3, diffuse involvement of an entire brain region. For all patients, the highest score for each hemisphere was used in the analysis (Fig 2).

MDCTA axial image of a 79-year-old man. A, The white arrow indicates the right common carotid artery. B, A 200% magnification is shown, and the 3 measurements at 6, 9, and 12 o‘ clock positions are visible.
Statistical Analysis
Continuous data were described as the mean value ± SD. The normality of data distribution was assessed by using the Kolmogorov-Smirnov test. Age was boxplotted against LA severity and CAWT. The correlation coefficient between CAWT and LA severity was calculated by using a Spearman correlation (ρ). Logistic regression analysis was also performed to examine the relationship between the dichotomous variable LA and independent variables such as CAWT, age, class of carotid artery stenosis, sex, tobacco use, hypertension, dyslipidemia, and diabetes mellitus. The Cohen κ test34 was applied to assess the interobserver agreement for white matter scores. A value of <0.20 implied poor agreement; 0.21–0.40, fair agreement; 0.41–0.60, moderate agreement; 0.61–0.80, substantial agreement; and 0.81–1.0, almost perfect agreement. The Bland-Altman analysis was performed to analyze the interobserver agreement in the CAWT quantification. R software (www.r-project.org) was used for these analyses. A P value < .05 was considered to indicate statistical significance.
Results
General Results
The clinical features of the study group are shown in Table 1. In our cohort, we detected 54 patients with ischemic symptoms (17 strokes, 28 transitory ischemic attacks, 9 cases of amaurosis fugax) and 44 without ischemic symptoms. Measurements of the CAWT ranged from 0.5 to 1.53 mm. The normality of CAWT distribution, assessed by using the Kolmogorov-Smirnov test, was rejected with a P value of .046; therefore, the mean and median cannot be considered. Given the lack of normality, we used the Spearman statistic to evaluate the correlation between parameters. A statistically significant correlation was observed between CAWT values and LA (Spearman correlation, 0.33; 95% CI, 0.19–0.45; P < .0001) and between CAWT values and LA severity (Spearman correlation, 0.21; 95% CI, 0.08–0.34; P < .0035). Moreover, a statistically significant correlation between increased age and LA (Spearman correlation, 0.23; 95% CI, 0.09–0.36; P value < .0012) and between increased age and LA severity (Spearman correlation, 0.42; 95% CI, 0.29–0.53; P < .0001) was also recorded. Figure 3A, -B shows, respectively, the boxplot of LA severity against CAWT and age.
Clinical characteristics of the study populationa

A, Box-and-whisker plot representing CAWT values according LA severity. B, Box-and-whisker plot representing age value according to LA severity.
Logistic Regression Analysis
Logistic regression was performed to explore the relationship between CAWT, degree of carotid stenosis, type of plaque, age of patients, and other risk factors such as sex, tobacco use, hypertension, dyslipidemia, and diabetes mellitus. The results are shown in Table 2. Data from our study showed a statistically significant association between LA and CAWT, between LA and patient age, and between LA and fatty plaques (P = .0087, .0103, and 0.0276, respectively).
Logistic regression analysis
ROC Curve Analysis
We also analyzed the relationship between LA and CAWT by using ROC statistics. The ROC curve analysis is shown in Fig 4. Area under the ROC curve was 0.729 ± 0.039 (95% CI, 0.661–0.790; P = .0001). From this ROC, we obtained the sensitivity, specificity, and positive and negative predictive values of each measure; a summary of these values is given in Table 3. On the basis of a threshold of 0.9 mm, ROC curve analysis indicated a sensitivity of 63% and a specificity of 72% for LA.

ROC curve analysis.
ROC curve analysis for specific measurements of CAWT versus LA
Reproducibility Analysis
Interobserver agreement in measuring LA showed optimal results with κ and weighted κ values of 0.856 and 0.893, respectively. Good results were also obtained in the analysis of interobserver reproducibility for LA severity, with a κ value of 0.734 and a weighted κ value of 0.771. Interobserver agreement in the CAWT analysis, calculated by using Bland-Altman plots, was also good (Fig 5).
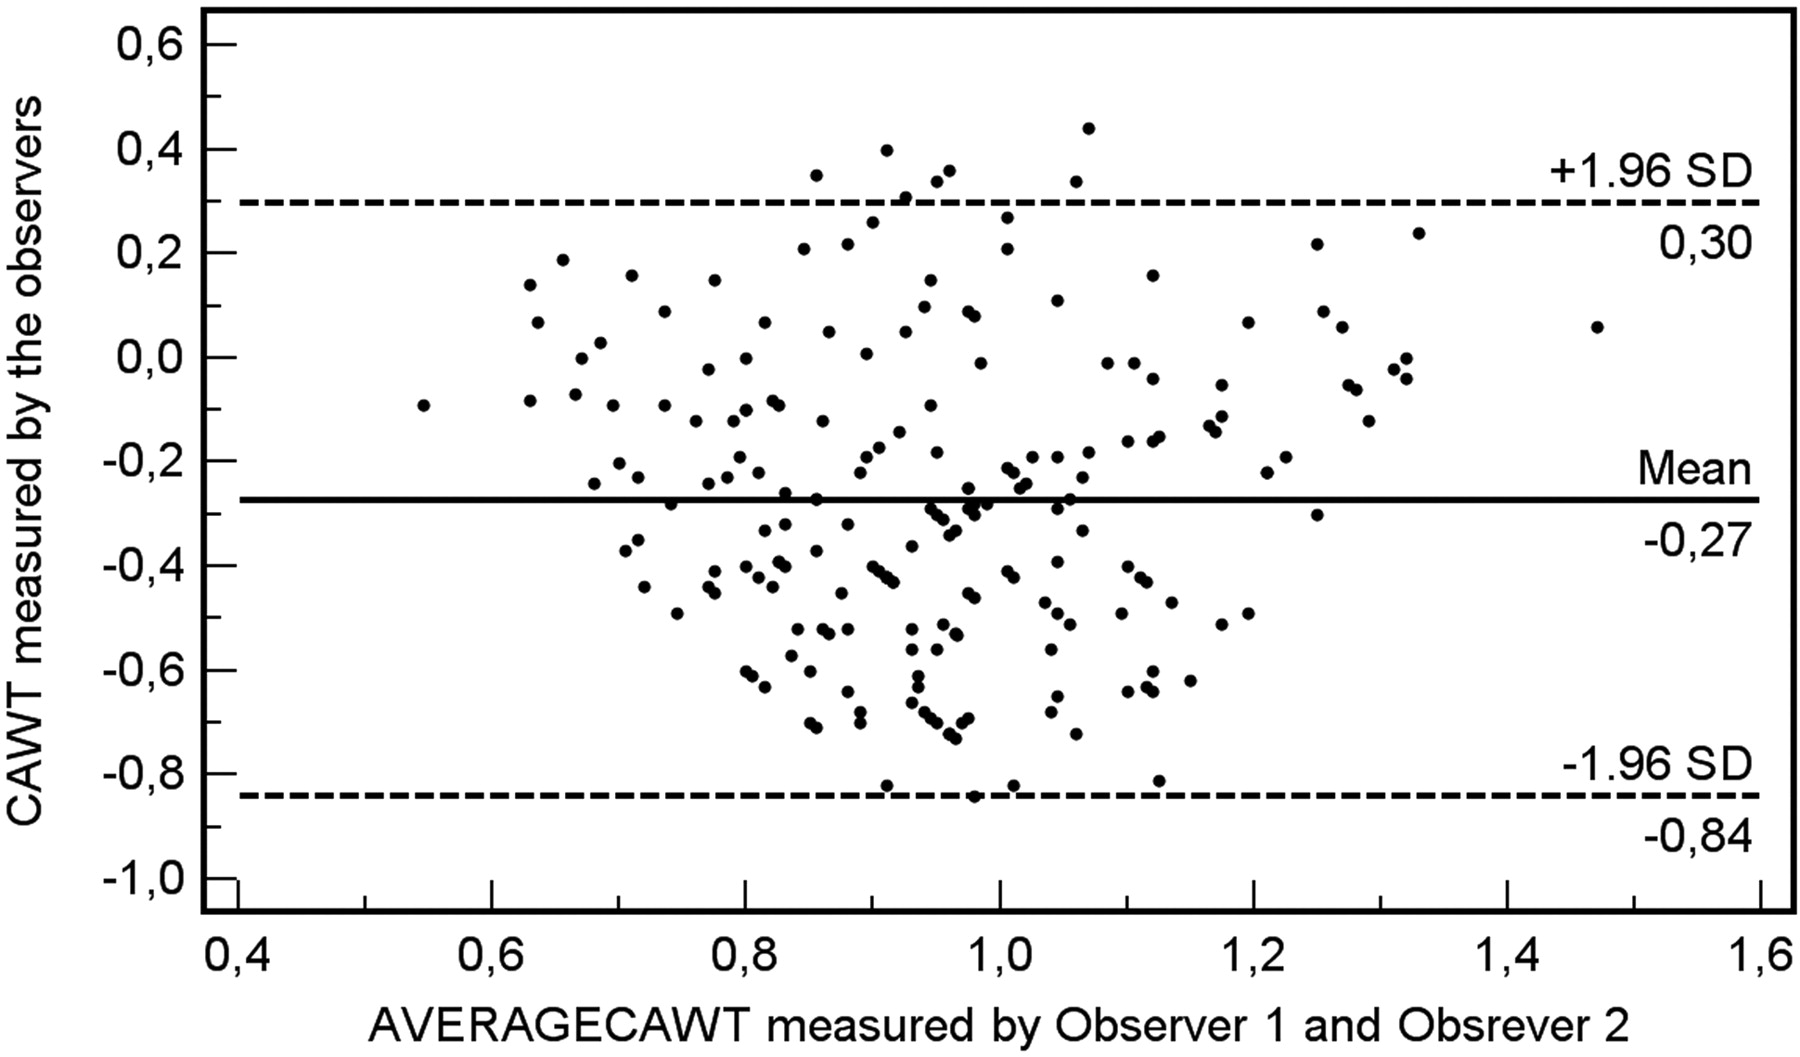
Bland-Altman plot analysis for the CAWT reproducibility between observers.
Discussion
Evidence indicates that LA may predispose individuals to stroke,35 but conflicting conclusions have been reported that may be due to the heterogeneous presence of risk factors for LA formation among patients.36 LA formation probably involves multiple etiologies, and ischemic causalities could be significant for some and insignificant for others. Currently, it is possible to find 2 main hypotheses in the literature regarding LA etiology: ischemic and nonischemic. According to the first theory, LA is caused by insufficient blood supply to the cerebral white matter due to the vascular pathology,11,37–39 and recent articles40,41 demonstrated that vessel attenuation in the deep white matter was significantly lower in patients with LA compared with healthy subjects (P = .018). According to the nonischemic hypothesis, LA may be due to the dilation of the perivascular spaces that surround normal arterioles or to atrophic changes that include gliosis or the loss of the myelinated axons seen in the normal-aging brain.4,42–45
Increased IMT reflects the severity of arterial damage brought about by classic vascular risk factors and has been suggested as a measure of atherosclerosis, while prospective studies have shown that an increased IMT is an important predictor of cerebrovascular and coronary complications.44,46 Recently Saba et al21,22 demonstrated that MDCTA can be used to measure the thickness of the CAWT, and the results obtained indicated significant agreement between MDCTA and CD-US in the measurement of CAWT and IMT (correlation coefficient, r = 0.9855; 95% CI, 0.9808–0.989; the Mann Whitney U test indicated a P value of .377).
The purpose of this work was to investigate whether CAWT measured by using MDCTA is associated with LA and its severity. In our highly selected group, we observed a statistically significant correlation between CAWT values and LA (Spearman correlation, 0.33) and between CAWT values and LA severity (Spearman correlation, 0.21). The logistic regression analysis confirmed the correlation by indicating that CAWT was an independent variable associated with LA. These data are concordant with the observation of Manolio et al,47 who reported a correlation between LA and IMT measured by US; they demonstrated a strong and consistent relationship between LA and increasing carotid IMT. These results were recently confirmed by Tanaka et al.48
The association between LA and increasing age is well documented,4,11,49–51 and for this reason, we decided to include only those patients ≥60 years of age to reduce the effect of age; however, the inclusion of subjects only ≥60 years of age represents a bias in this study and may limit the degree to which our results can be generalized to the entire population. Our results confirmed a significant statistical association between increasing age, LA, and LA severity (P = .0012 and <. 0001, respectively). We studied patients whose clinical examinations, carotid CTA/brain CT, and blood sampling were performed according to the same protocols. We believe that our cohort is relatively uniform for a hospital-based series, though the size of the cohort was relatively small. On the basis of a comparison between our patients' characteristics and other studies, we observed a higher incidence of patients with LA (77.5% in our study versus 51.2% in Fanning et al23). This result can easily be explained by the higher mean age of the patients belonging to our study group (72 years).
On the basis of the logistic regression analysis, we found no association between classic cerebrovascular risk factors and LA risk. Previous studies described an association between LA and associated risk factors for cerebrovascular disease,52–55 such as diabetes, dyslipidemia, hypertension, and tobacco use. However, the association between LA and cerebrovascular risk factors is still being debated; Murray et al56 found a significant Pearson correlation between LA and diabetes, hypertension, low-attenuation lipoprotein, and cholesterol, but these associations were not confirmed by other authors.57
An interesting result observed in our study was the association between the presence of the fatty plaque type and LA (P = 0.0276). It is well known that the composition of the atherosclerotic plaque may play a significant role in the origin of cerebrovascular events.58 Our results support a previous study by Saba et al,11 which found a trend in the association of the presence of fatty plaques and LA (P = .08). Moreover, these results are concordant with the study by Altaf et al,59 which demonstrated that LA is associated with features that indicate plaque instability, showing that plaque activity may contribute to the development of LA.
Interobserver agreement in measuring LA showed optimal results with κ and weighted κ values of .856 and .893, respectively. Good results were also obtained in the analysis of interobserver reproducibility for LA severity, with a κ value of 0.734 and a weighted κ value of 0.771. These results are similar to those of previous studies.11 Interobserver agreement in the CAWT analysis, calculated by using a Bland-Altman plot (Fig 5) was also good.
There were several limitations to this study. First, this was a retrospective study; in fact, our patients were chosen from a retrospectively created data base, and this process may have led to bias in the composition of the cohort. A prospective study would probably provide even more accurate results. Second, in our institution, carotid CTA is performed when there is evidence of pathology confirmed by US; therefore, a large number of patients with no evidence of pathology were excluded from the study. Third, we studied only a subset of the patient population who were older than 60 years of age, to reduce the age effect in the LA analysis, but this is a very different demographic group compared with the general population, which thus limits the generalization of our results.
Conclusions
The results of this study showed, in this highly selected patient group, a statistically significant correlation between increased CAWT and LA (and its severity), whereas the degree of stenosis and the classic cardiovascular risk factors had no effect. The data presented are preliminary, and the generalization of our results is significantly limited by the potential selection bias associated with the methodology of our study.
References
- Received June 27, 2010.
- Accepted after revision September 21, 2010.
- Copyright © American Society of Neuroradiology


