
Abstract
BACKGROUND AND PURPOSE: Spinal cord atrophy is a common feature of MS. However, it is unknown which cord levels are most susceptible to atrophy. We performed whole cord imaging to identify the levels most susceptible to atrophy in patients with MS versus controls and also tested for differences among MS clinical phenotypes.
MATERIALS AND METHODS: Thirty-five patients with MS (2 with CIS, 27 with RRMS, 2 with SPMS, and 4 with PPMS phenotypes) and 27 healthy controls underwent whole cord 3T MR imaging. The spinal cord contour was segmented and assigned to bins representing each C1 to T12 vertebral level. Volumes were normalized, and group comparisons were age-adjusted.
RESULTS: There was a trend toward decreased spinal cord volume at the upper cervical levels in PPMS/SPMS versus controls. A trend toward increased spinal cord volume throughout the cervical and thoracic cord in RRMS/CIS versus controls reached statistical significance at the T10 vertebral level. A statistically significant decrease was found in spinal cord volume at the upper cervical levels in PPMS/SPMS versus RRMS/CIS.
CONCLUSIONS: Opposing pathologic factors impact spinal cord volume measures in MS. Patients with PPMS demonstrated a trend toward upper cervical cord atrophy. However patients with RRMS showed a trend toward increased volume at the cervical and thoracic levels, which most likely reflects inflammation or edema-related cord expansion. With the disease causing both expansion and contraction of the cord, the specificity of spinal cord volume measures for neuroprotective therapeutic effect may be limited.
Abbreviations
- CIS
- clinically isolated syndrome
- EDSS
- Expanded Disability Status Scale
- ICV
- intracranial volume
- MDEFT
- modified driven equilibrium Fourier transform
- MS
- multiple sclerosis
- PPMS
- primary-progressive multiple sclerosis
- RRMS
- relapsing-remitting multiple sclerosis
- SPMS
- secondary-progressive multiple sclerosis
- WC
- whole cord
MS is a chronic progressive disease characterized by inflammation and demyelination of the brain and spinal cord and atrophy of these structures.1,2 Atrophy occurs in all subtypes of MS, including PPMS, SPMS, and RRMS forms.3 Progressive forms of MS are defined clinically as showing continual accumulation of neurologic deficits that are independent of acute relapses. In RRMS, patients experience acute relapses followed by variable recovery with stable disability between relapse periods. Spinal cord atrophy in MS has been demonstrated in both pathologic and neuroimaging investigations. Pathologic studies of postmortem tissue have suggested that most spinal cord atrophy is due to interneuronal axonal degeneration within white matter.4–6 This degeneration may be triggered by both local and remote demyelinating lesions. Although neuronal loss can be extensive within sites of local demyelination, its role in overall cord atrophy is thought to be limited.4,5,7
The degree of MR imaging-defined spinal cord atrophy is a proposed marker of disease severity, extent of neurodegeneration, and neuroprotective therapeutic effects. This is apparent from several observations showing the following: 1) increased cord atrophy in PPMS versus RRMS phenotypes,6,8–10 2) the link between cord atrophy and physical disability,2,8–14 and 3) the ability to detect progressive cord atrophy annually in longitudinal studies.9,15 While spinal cord atrophy in the progressive subtypes of MS is evident, the detection of atrophy in RRMS has been more elusive. Multiple investigations have shown no significant difference between cervical spinal cord atrophy measures in patients with RRMS versus controls.10,12,15,16 A longitudinal study of early RRMS was able to detect the development of upper cervical spinal cord atrophy when individual patients were serially imaged.15
Most prior studies have focused on detecting atrophy of the upper cervical spinal cord and not the lower cervical or thoracic spinal cord. This focus is likely due to several factors: 1) MS lesions in the spinal cord affect the cervical more commonly than thoracic areas,4,17 2) the cervical cord is easier to assess by MR imaging due to its larger size and decreased mobility compared with the thoracic cord,18 and 3) the notion that clinical disability in MS is more dependent on cervical than thoracic cord disease.19
Few studies have rigorously examined the topography of cord atrophy to determine which sites across the whole cord are most susceptible. Evangelou et al4 and Gilmore et al17 found significant atrophy in postmortem tissue in SPMS compared with control patients within the upper and lower cervical and upper thoracic spinal cord, but not the lower thoracic and lumbar spinal cord. Because of the limited correlation between cervical cord atrophy and disability and the limited sensitivity of cervical atrophy for tissue damage in the early stages of MS,2,9 there is an impetus to further explore the effect of tissue destruction in other areas of the cord.
The purpose of this study was to investigate the topography of spinal cord atrophy at each vertebral level by using the whole spinal cord 3T MR imaging in patients with MS. We tested for the presence of atrophy in patients compared with healthy controls. In addition, we explored the differences in cord volume among the major MS clinical phenotype groups.
Materials and Methods
Subjects
This study was approved by an institutional review board. Participants were recruited by using an institutional review board-approved advertisement and gave informed consent. The participant's medical record was examined, followed by a telephone interview to determine suitability to enter the study. We excluded any potential participants with a history of major medical, neurologic, or neuropsychiatric disorders; current or prior history of substance abuse; or any condition that precluded MR imaging. Subjects were also excluded if they had congenital or acquired spinal canal narrowing on MR imaging to avoid any confounding myelopathic effects on cord volume. All patients with MS had not experienced relapse or corticosteroid use within the 4 weeks before study entry and had not initiated any disease-modifying therapy within the 6 months before study entry, to avoid any confounding “pseudoatrophy” effects on central nervous system volume.1 Total enrollment was 62 subjects: 27 with RRMS, 2 with CIS, 4 with PPMS, 2 with SPMS, and 27 healthy controls. MS clinical phenotypes were defined as previously detailed.3 Recruitment age was from 18 to 55 years. Subjects were well-matched for age and sex. Subject demographics and clinical characteristics are shown in On-line Table 1. Neurologic disability was assessed by using the EDSS.20 Different aspects of these patients are being reported separately.21
MR Imaging Acquisition
All subjects underwent whole spinal cord and brain imaging on the same 3T MR imaging scanner (whole body scanner, GE Healthcare, Milwaukee, Wisconsin) by using an identical scanning protocol throughout the study. Spine MR imaging was performed with an in-house developed spinal phased array coil by using 8 channels at 20-mT/m maximal gradient strength. Axial T2 fast spin-echo images had the following parameters: FOV, 24 × 19 cm; matrix size, 256 × 256; section thickness, 3 mm with no gap; TR, 6116.66 ms; TE, 110.24 ms; echo-train length, 12; number of signal-intensity averages, 2; flip angle, 90°; pixel size, 0.937 × 0.937 mm; and total acquisition time, 22.5–32.0 minutes. Images with this spinal MR imaging protocol have been previously published.18
One hundred fifty to 200 axial sections were acquired on each subject to cover the whole spinal cord. The whole spinal cord was defined by using bony landmarks (foramen magnum rostrally to the T12 vertebral body caudally). We stopped at the T12 level due to variability in cord anatomy below this level. In a previous optimization experiment, T1- and T2-weighted images showed similar reliability and validity for assessing cord atrophy19; thus for efficiency's sake, we chose T2-weighted images going forward on the basis of the ability to measure lesions and atrophy from the same pulse sequence. Brain imaging for the purpose of calculating ICV was acquired with an inversion-prepared spoiled gradient-echo sequence modified with additional pulses to implement the MDEFT sequence.22,23 ICV measurements were used for spinal cord volume normalization.
MR Imaging Analysis
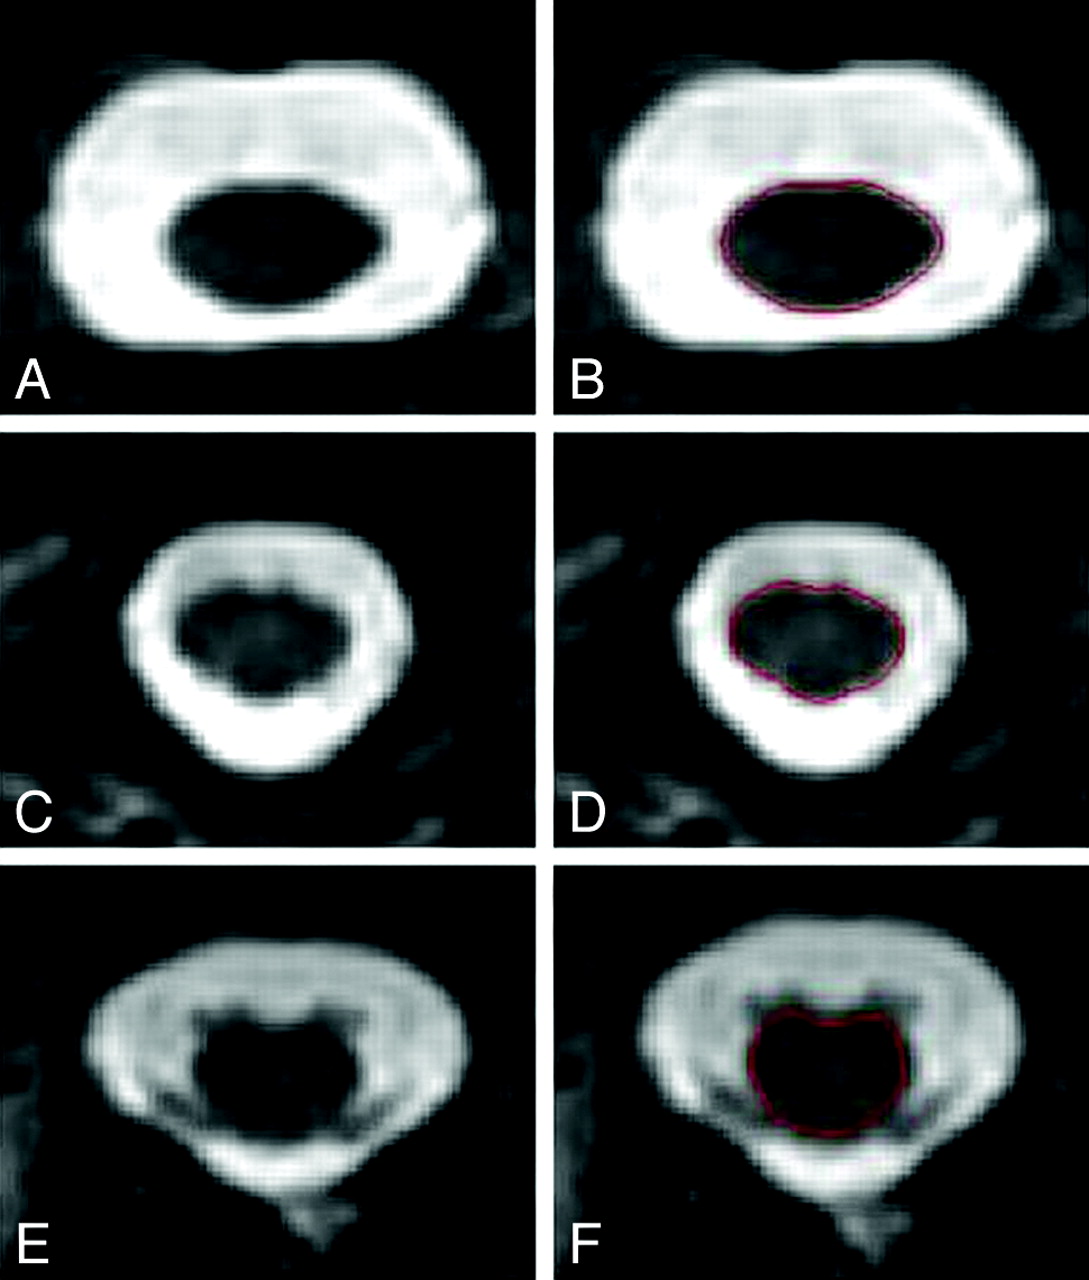
MR imaging data were transferred to our laboratory where analysis was performed by using the Jim software package (Version 5.0, Xinapse Systems, Northants, United Kingdom; www.xinapse.com). Scans were anonymized and randomized, and analysis was performed by an experienced observer (J.P.K.), who was unaware of clinical information. All axial sections were assigned to bins representing the cervical and thoracic vertebral levels. The bin assignments were based on the approach that, for example, the C3 level would include sections extending from the superiormost aspect of the C3 vertebral body to the inferiormost margin of the C3-C4 intervertebral disk. Spinal cord measurements at the C1 and C2 vertebral levels were combined into 1 bin because the C1-C2 boundary was often indistinct. Sagittal reconstructed images were cross-referenced to the axial images to allow precise bin assignment based on vertebral levels. The full contour/area of the spinal cord in the axial plane was defined by using an edge-finding tool based on local thresholding. Manual adjustments were applied where necessary. Representative cord images with cord contours outlined are shown in Fig 1 . The volume of each section was determined by the Jim software package by multiplying the area by the section thickness. Consistency and accuracy of measurements were confirmed by independent and blinded review of the regions of interest by a second experienced observer (A.A.). The relationship between MR imaging findings and disability in these patients is being reported as part of a separate study.21 3D MDEFT images of the head were deskulled by using a semiautomated tool in the Jim software package to calculate ICV. Spinal cord measurements were normalized to values of ICV and number of sections as per Arora et al.24

Representative spinal MR imaging scans and segmentation. T2-weighted fast spin-echo axial images obtained at 3T of the upper cervical (A), lower cervical (C), and thoracic (E) spinal cord are shown. High contrast between the spinal cord (hypointense) and the surrounding CSF (hyperintense) is noted. Semiautomated spinal cord contour maps are shown for the identical sections in B, D, and F. The patient is a 29-year-old woman with RRMS of 7 years' disease duration on treatment with interferon β-1a at the time of imaging, with no physical disability (EDSS score of 0).
Statistical Analysis
All spinal cord volume measurements were divided by the number of sections and the ICV to normalize the volume measurement across patients. This approach was designed to eliminate differences based on vertebral body height and craniospinal size among subjects. We obtained similar results in the present study when the raw volumes were compared (data not shown) instead of normalized volumes. Only the normalized data are presented. Group differences in normalized values were assessed by using linear regression to control for age. The primary analysis was all patients with MS compared with healthy controls, but exploratory additional analyses comparing patients with RRMS, PPMS, and healthy controls were also completed. Due to the limited number of patients in each MS phenotype group, CIS and RRMS patient data were combined as the RRMS group, and PPMS and SPMS patient data were combined as the PPMS group. Both unadjusted P values and P values adjusted for multiple comparisons across the vertebral levels by using the Holm sequential procedure25 are reported. All statistical analysis was completed in the statistical package R (R: A Language and Environment for Statistical Computing, R Foundation for Statistical Computing, Vienna, Austria; http://www.R-project.org).
Results
All Patients with MS versus Controls
When we considered the MS group collectively, spinal cord volumes were significantly increased versus controls at the T9, T10, and T11 vertebral levels (Table 2 and Fig 2 ), but these results failed to remain statistically significant after correcting for multiple comparisons. There were no significant differences at the remaining thoracic levels, at any of the cervical levels, or in the whole cord (all, P > .05) (On-line Table 2 and Figs 2 and 3 ).

Spinal cord volume (plotted as volume/section/ICV) segmented by vertebral level. Group comparison P values with and without correction for multiple statistical tests are presented in On-line Tables 2 and 3. Bar heights represent means; error bars represent SDs.
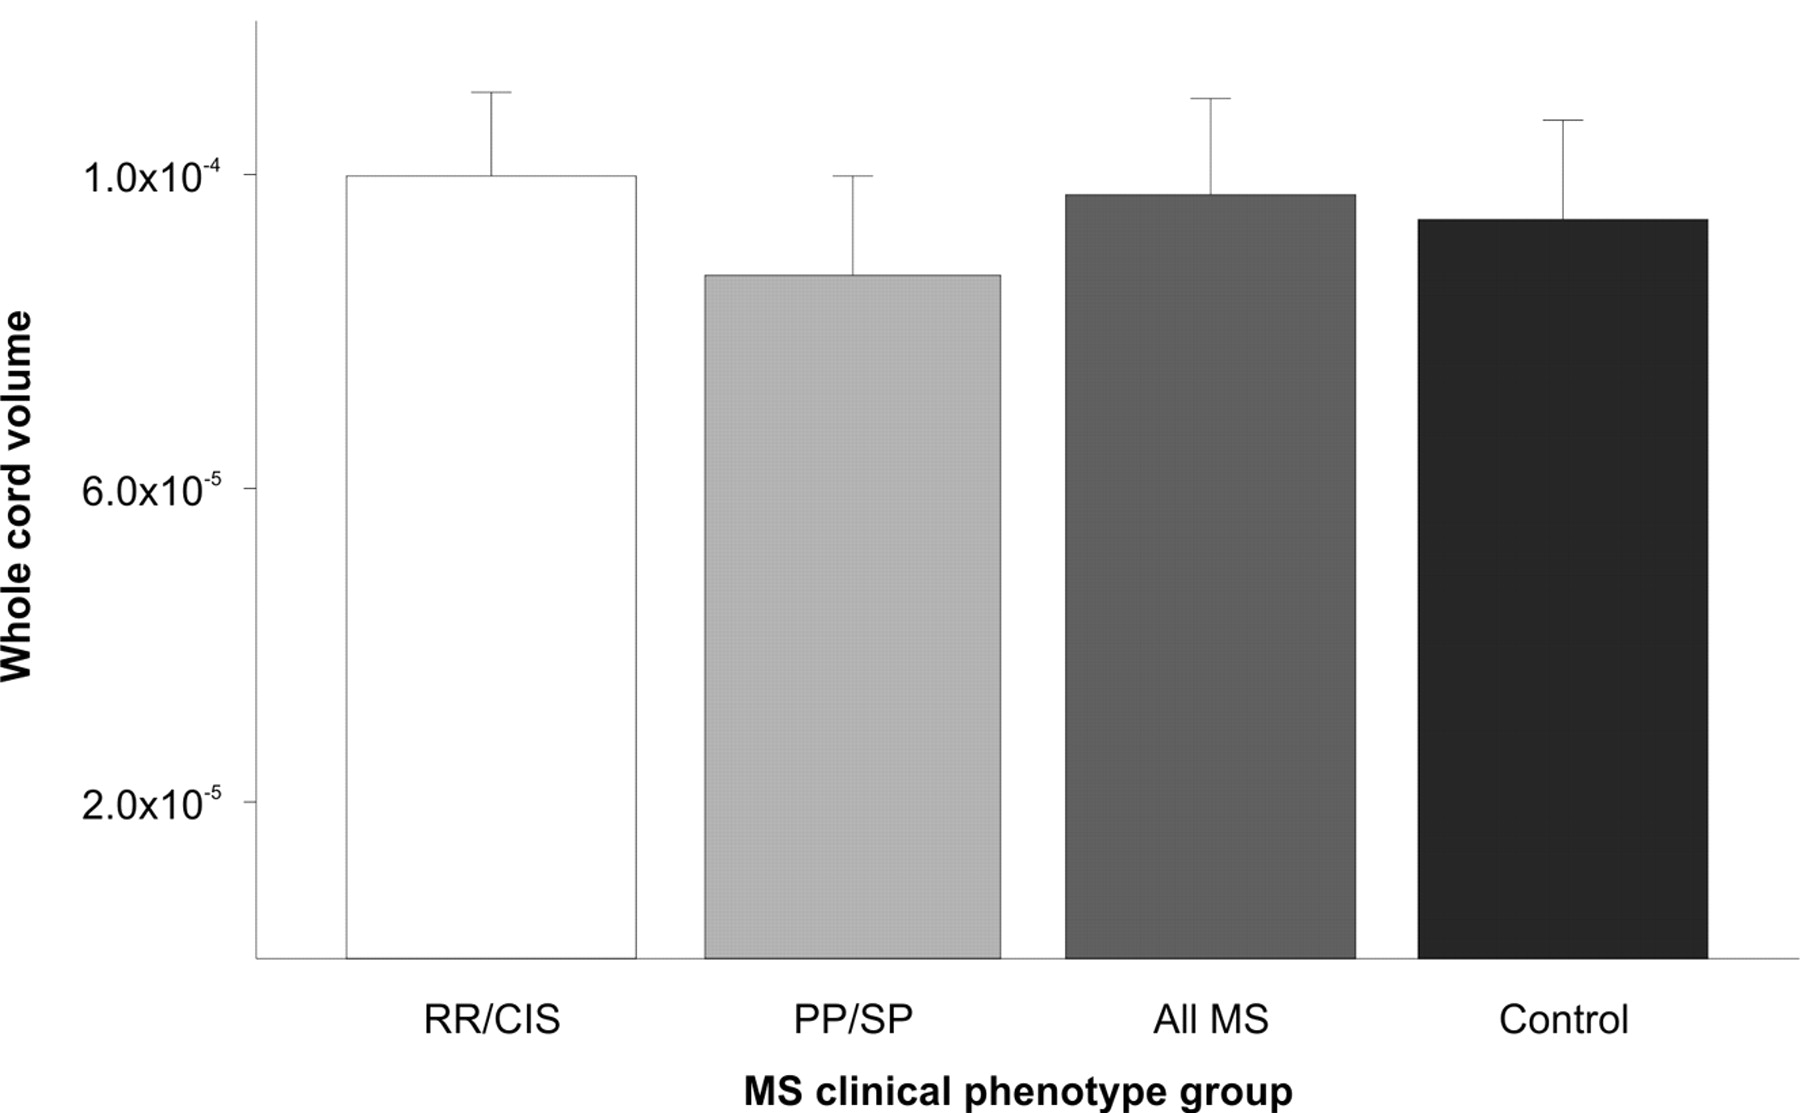
Whole spinal cord volume (plotted as volume/section/ICV). Whole spinal cord volume is 12.6% smaller in PPMS/SPMS compared with RRMS/CIS. No significant difference in whole spinal cord volume is detected between RRMS/CIS and controls, PPMS/SPMS and controls, or all MS and controls. Group comparison P values with and without correction for multiple statistical tests are presented in On-line Tables 2 and 3. Bar heights represent means; error bars represent SDs.
Patients with PPMS versus Controls
Spinal cord volumes were significantly decreased in patients with PPMS/SPMS versus controls at the C1-C2 and C3 vertebral levels (On-line Table 3 and Fig 2), but these results failed to remain statistically significant after correcting for multiple comparisons. There were no significant differences at the remaining cervical levels, at any of the thoracic levels, or in the whole cord (all P > .05) (On-line Table 3 and Figs 2 and 3).
Patients with RRMS versus Controls
Spinal cord volumes were significantly increased in patients with RRMS/CIS versus controls at the C5, T7, T8, T9, T10, and T11 vertebral levels (On-line Table 3 and Fig 2); the difference at the T10 level remained statistically significant after correcting for multiple comparisons. Of note, every other vertebral level showed a trend toward increased spinal cord volume in RRMS/CIS compared with controls after correction for multiple comparisons (On-line Table 3 and Fig 2). There was a trend but no significant increase in whole cord volume in patients with RRMS/CIS versus controls (On-line Table 3 and Fig 3).
Patients with PPMS versus RRMS
Spinal cord volumes were significantly decreased in patients with PPMS/SPMS versus those with RRMS/CIS at all cervical vertebral levels and the T1, T6, T7, T9, and T10 vertebral levels (On-line Table 3 and Fig 2); the differences at C1-C2 and C3 remained statistically significant after correcting for multiple comparisons. In addition, whole spinal cord volume was significantly decreased in the progressive group (On-line Table 3 and Fig 3).
Discussion
This study showed that there was statistically significant cord expansion at the T10 vertebral level in RRMS/CIS versus controls and statistically significant cord atrophy at the C1-C2 and C3 vertebral levels in PPMS/SPMS versus RRMS/CIS, after correction for multiple comparisons. There were non-statistically significant trends toward cord expansion at all other vertebral levels in RRMS/CIS versus controls and trends toward cord atrophy at all other vertebral levels in PPMS/SPMS versus RRMS/CIS. Together, these results suggest that spinal cord atrophy is more prominent in patients with PPMS than relapsing forms of MS. These findings are, in general, in agreement with prior studies showing that patients with progressive subtypes are more prone to developing spinal cord atrophy.2,8,10
There was another interesting and somewhat unexpected finding in our study. Patients with RRMS/CIS showed a trend toward increased spinal cord volume at all vertebral levels in comparison with healthy controls (Fig 2). Several prior studies have failed to find spinal cord atrophy in patients with RRMS versus healthy controls.12,13,16,26 A longitudinal study of early RRMS was able to detect the development of upper cervical spinal cord atrophy when individual patients were serially scanned; however, the rate of atrophy did not correlate with clinical disability.15 Mann et al16 found no significant difference in cervical spinal cord cross-sectional area in patients with RRMS compared with controls, and a trend toward increased cervical spinal cord cross-sectional areas in this study was interpreted as possibly related to inflammation and edema in the RRMS spinal cords.
The increase in cord volume in patients with RRMS/CIS versus healthy controls may represent cord inflammation and edema that would mask (offset) any destructive changes such as axonal loss, which would otherwise result in atrophy.16 Similar findings have been noted in cerebral white matter. In a longitudinal study of early RRMS, Dalton et al27 used MR imaging to segment cerebral gray and white matter and found a significant decrease in gray but not white matter volume in patients in the first 3 years after their first attack of demyelination. Significantly increased white matter volume in early RRMS was thought to be the result of inflammation/edema. Supporting this mechanism from the opposite perspective is the finding of cerebral “pseudoatrophy” in the first few months immediately following initiation of immune-modifying or immunosuppressive therapies such as interferon β and natalizumab in patients with RRMS.28 This most likely reflects a net loss of inflammatory cells and edema due to therapeutic effects rather than tissue destruction.1,29
While none of our patients were experiencing acute relapses in the 4 weeks before MR imaging, we did not perform postgadolinium imaging or an assessment of the relationship between T2 hyperintense lesions and cord volume at the same vertebral levels. Thus, the precise mechanisms leading to cord expansion in our patients with RRMS/CIS is unclear. Because opposing pathologic factors are likely influencing the degree of spinal cord expansion or contraction, the specificity of these measurements for neuroprotective therapeutic effect may be limited in the early stages of MS. However, we urge caution in generalizing our findings to larger RRMS cohorts because our patients with RRMS were mildly disabled and may not be fully representative.
The general and overall clinical consequences of MS are typically measured by comprehensive scales of disability, such as the EDSS score.20 In the present study, our interest was in level-specific spinal cord damage. Thus, we did not explore relationships between EDSS and local cord atrophy, with the thought that the EDSS receives contributions from a diverse anatomic distribution of damage. The integrity of spinal cord axons can be measured via somatosensory-evoked potentials and other similar neurophysiologic investigations. Due to the high attenuation of fiber tracts within the spinal cord, cord volume loss can produce greater disability compared with equivalent volume loss within the cerebral hemispheres.30,31 Future studies on spinal cord atrophy in MS should test correlations between the degree of atrophy at specific levels and measures of neurophysiologic function and clinical disability that are thought to be related to cord dysfunction at those specific levels.
Statistical analysis in this study showed that many of the observed group differences failed to remain statistically significant after correcting for multiple comparisons. However, many of these differences showed trends toward significance, which may have reached significance with a larger sample size. Thus the study may have been underpowered to detect the full biologic effects at all vertebral levels. In addition, the trends observed in the differences between the groups showed that various spinal regions had consistent trends. The trends observed in our study should serve as a basis for larger studies in the future to confirm and extend our findings.
In this study, image quality did not allow reliable parsing of gray and white matter within the spinal cord, so the relative contribution of volume changes of gray matter versus white matter remains in question. As the spatial resolution and contrast capabilities of MR imaging continue to advance, future studies may allow segmentation and quantification of gray and white matter atrophy within the spinal cord. Advanced MR imaging techniques such as spectroscopy, diffusion tensor imaging, or magnetization transfer imaging could be combined with structural MR imaging to determine the relative contributions of axonal damage, demyelination, and gliosis to atrophy.32 Together these investigations will allow a better understanding of similarities and differences in the pathophysiology of progressive and relapsing forms of MS.
Conclusions
3T MR imaging demonstrated a trend toward decreased spinal cord volume in progressive forms of MS and a trend toward increased spinal cord volume in relapsing forms of MS. With the disease causing both expansion and contraction of the spinal cord, the utility of cord volume measurement in monitoring destructive aspects of the disease in patients with early relapsing phenotypes may be limited. These results need to be confirmed in larger studies.
Footnotes
-
Our research was supported by the National Institutes of Health (R01NS055083–01) and National Multiple Sclerosis Society (RG3705A1 and RG3798A2).
-
Paper previously presented in preliminary form at: Annual Meeting of the American Academy of Neurology, April 10–17, 2010; Toronto, Ontario, Canada.
Indicates article with supplemental on-line tables.
-
Disclosures are made for the following authors: Brian C. Healy received support (including provision of equipment or materials) and research funding from Merck-Serono related to his work on the Comprehensive Longitudinal Investigation of Multiple Sclerosis study. James M. Stankiewicz is a consultant for Acorda, Teva, Biogen, and Bayer. Guy J. Buckle is a consultant for Accorda, Bayer, Biogen, EMD-Serono, Novartis, and Teva Pharmaceuticals and has received payments for consulting activities. Maria K. Houtchens received support (including provision of equipment or materials) from Biogen Idec (starting in October 2010) and is a consultant for Teva Neuroscience, Biogen Idec, Serono, and Acorda Therapeutics. Charles R.G. Guttmann received support (including provision of equipment or materials) from Teva Neuroscience and is a consultant for Johnson & Johnson. He has ownership interest in Roche and Novartis. David C. Alsop received support (including provision of equipment or materials) from GE Healthcare and is a consultant for Merck & Co. He was paid less than $10,000 for a topic unrelated to this article.
Indicates open access to non-subscribers at www.ajnr.org
References
- Received September 5, 2010.
- Accepted after revision October 20, 2010.
- Copyright © American Society of Neuroradiology
In this issue


Jump to section
Related Articles
Cited By...
- What are the gray and white matter volumes of the human spinal cord?
- Clinically relevant cranio-caudal patterns of cervical cord atrophy evolution in MS
- Cervical spinal cord atrophy: An early marker of progressive MS onset
- Multicenter Validation of Mean Upper Cervical Cord Area Measurements from Head 3D T1-Weighted MR Imaging in Patients with Multiple Sclerosis
- Voxel-wise mapping of cervical cord damage in multiple sclerosis patients with different clinical phenotypes