
Abstract
BACKGROUND AND PURPOSE: ALS leads to macrostructural (ie, cortical atrophy and hyperintensities along the corticospinal tract) and microstructural (ie, gray matter intrinsic damage) central nervous system abnormalities. We used a multimodal voxelwise imaging approach to assess microstructural changes independent of macrostructural volume loss in patients with ALS compared with HCs.
MATERIALS AND METHODS: Twenty-three patients with ALS and 14 HCs were studied. Conventional imaging and DTI were performed. Images were processed by using SPM5 to assess measures of gray and white matter atrophy as well as microstructural damage (ie, MD and FA). DTI alterations independent of volume loss were investigated.
RESULTS: When we accounted for both gray and white matter atrophy, patients with ALS showed increased MD values in several gray and white matter areas mainly located in the orbitofrontal and frontotemporal regions bilaterally, in the right genu of the corpus callosum, and in the right posterior limb of the internal capsule. When we accounted for white matter volume loss, patients with ALS showed decreased FA along the corticospinal tract bilaterally and in the left inferior frontal lobe relative to HCs. The MD of the orbitofrontal regions bilaterally was associated significantly with disease duration.
CONCLUSIONS: In patients with ALS, DTI detects microstructural changes independent of brain tissue loss. The affected regions included both motor and extramotor areas. The extent of ALS-related DTI abnormalities was greater than that disclosed by the volumetric analysis.
Abbreviations
- ALS
- amyotrophic lateral sclerosis
- ANCOVA
- analysis of covariance
- B0
- DTI with no diffusion weighting
- BA
- Brodmann area
- BPM
- biological parametric mapping
- DARTEL
- Diffeomorphic Anatomical Registration using Exponentiated Lie algebra registration method
- DTI
- diffusion tensor imaging
- FA
- fractional anisotropy
- FLAIR
- fluid-attenuated inversion recovery
- FWHM
- full width at half maximum
- GM
- gray matter
- HC
- healthy control
- LL- and UL-MRC
- lower limb- and upper limb-Medical Research Council
- MD
- mean diffusivity
- MNI
- Montreal Neurological Institute
- MRC
- Medical Research Council scale
- r-ALSFRS
- ALS Functional Rating Scale-Revised
- SOD1
- superoxide dismutase
- SPM
- statistical parametric mapping
- T1w
- T1-weighted
- T2w
- T2-weighted
- UMN
- upper motor neurons
- VBM
- voxel-based morphometry
- WM
- white matter
ALS is a progressive neurodegenerative disease, which is associated with heterogeneous pathologic features. The main pathologic abnormalities in patients with ALS include loss of motor neurons in the primary motor cortex, brain stem, and spinal anterior horn, as well as axonal degeneration, demyelination, and reactive gliosis of the corticospinal tract.1 Such changes can result in gross abnormalities such as atrophy of the motor/premotor cortex and macroscopic lesions along the corticospinal tract, which can be seen on conventional MR imaging of the brain.2 Although the etiology of ALS remains unknown, mutations in the gene encoding Cu/Zn-SOD1 have been implicated in a fraction of familial cases of the disease.3 Emerging research has demonstrated that mutations and pathology associated with the TAR DNA binding protein-43 gene and protein may be more common than SOD1 mutations in familial and sporadic ALS.3 Putative mechanisms of toxicity targeting motor neurons include oxidative damage, accumulation of intracellular aggregates, mitochondrial dysfunction, defects in axonal transport, growth factor deficiency, aberrant RNA metabolism, glial cell pathology, and glutamate excitotoxicity. Convergence of these pathways is likely to mediate disease onset and progression.3
DTI allows measuring the random diffusional motion of water molecules and, thus, provides quantitative indices of the structural and orientation features of central nervous system tissues.4 MD is a measure of the magnitude of diffusion, whereas FA is a measure of the directionality of water diffusion.4,5 Alterations in the brain microstructure associated with ALS have the potential to modify water diffusion characteristics, which can be reflected in changes of MD and FA. DTI studies in patients with ALS showed consistently decreased FA and increased MD values along the corticospinal tract.6 Decreased FA and increased MD have also been shown in the corpus callosum7–11 and in the gray and white matter of nonmotor frontal8,10–12 and temporal10–12 regions of patients with ALS compared with controls.
The meaning of MD and FA changes in ALS, however, must be interpreted cautiously because they can be influenced by gray and white matter volume loss.13 For instance, white matter diffusivity abnormalities are related to several aspects of the white matter microstructure, some of which are likely to also affect the volumetry of the damaged areas (eg, the degree of myelination and axonal degeneration).4,5 Using VBM or measurements of cortical thickness, previous studies in patients with ALS showed atrophy of the primary motor and premotor cortices as well as of several other frontal and temporal regions.7,12,14–18 White matter volume reductions too have been found in motor and nonmotor regions of patients with ALS.16,19,20 Recently, the ability of DTI to recognize brain microstructural alterations, regardless of the presence of volume loss, in healthy subjects21 and patients with Alzheimer disease has been shown.22 These observations suggest that microstructural tissue abnormalities may precede gray and white matter volume loss in target regions typically hit by normal aging or Alzheimer disease.21,22
Against this background, we wished to assess whole brain MD and FA alterations in patients with ALS compared with controls by using a voxelwise method, which takes into account volume differences on a voxel-per-voxel basis.23
Materials and Methods
The study was conducted with institutional review board approval. Written informed consent was obtained from each participant.
Subjects
Twenty-three patients with probable or definite ALS,24 and mild disability, defined as a score ≥20 on the r-ALSFRS,25 were included (Table 1). Three patients had bulbar-onset disease. None of the patients had clinical evidence of frontotemporal dementia. Experienced neurologists, unaware of the MR imaging results, administered the r-ALSFRS questionnaire within 48 hours of acquisition of the MR images. Muscle strength was scored by using the MRC scale from 0 to 5.26 UMN involvement was assessed by totaling the number of pathologic UMN signs on examination (maximum total score = 16).27 Fourteen sex- and age-matched healthy individuals, with no history of neurologic or psychiatric disorders, served as controls.
Sociodemographic and clinical features of HCs and patients with ALSa
MR Imaging Acquisition
Conventional and DTI scans were acquired by using a 1.5T system (Avanto; Siemens, Erlangen, Germany). The following pulse sequences were obtained: 1) dual-echo turbo spin-echo (TR = 2650 ms, first-echo TE = 28 ms, second-echo TE = 113 ms, echo-train length = 5, number of sections = 50, section thickness = 2.5 mm with no gap, matrix size = 512 × 512, FOV = 250 mm2); 2) FLAIR (TR = 10,000 ms, TE = 115 ms, TI = 2500 ms, flip angle = 150°, number of sections = 50, section thickness = 2.5 mm with no gap, matrix size = 256 × 224, FOV = 240 × 210 mm2); 3) sagittal 3D T1-weighted magnetization-prepared rapid acquisition of gradient echo (TR = 2,000 ms, TE = 3.93 ms, flip angle = 128°, FOV = 270 mm2, matrix size = 256 × 256, voxel size = 0.9 × 0.5 × 0.5 mm3, slab thickness = 187.2 mm); and 4) pulsed gradient spin-echo echo-planar (TR = 6500 ms, TE = 95 ms, number of sections = 40, section thickness = 2.5 mm with no gap, matrix size = 128 × 128, FOV = 240 mm2) with diffusion-encoding gradients applied in 12 noncollinear directions (b = 1000 s/mm2, number of averages = 8).
MR Imaging Analyses
All MR imaging analyses were performed by a single experienced observer blinded to clinical findings. Corticospinal tract hyperintensities were identified on dual-echo and FLAIR scans.
VBM.
VBM was performed by using SPM5 (Wellcome Department of Imaging Neuroscience, London, United Kingdom) and the DARTEL registration method,28 as previously described.22 Briefly, the process was as follows: 1) T1-weighted images were segmented by using VBM5.1 toolbox (available at: http://dbm.neuro.uni-jena.de/beta-version-of-vbm51-toolbox/)29 to produce tissue probability maps in the MNI space. 2) The images were imported in DARTEL, 3) rigidly aligned, and segmented into gray and white matter (by using the segmentation parameters from the first step) and resampled to 1.5-mm isotropic voxels. 4) The gray and white matter segments were coregistered simultaneously by using the fast diffeomorphic image registration algorithm and the flow fields were created.28 5) The flow fields were then applied to the rigidly aligned segments to warp them to the common DARTEL space and then were modulated by using the Jacobian determinants. 6) The modulated images from DARTEL were normalized to the MNI template by using an affine transformation estimated from the DARTEL gray matter template and the a priori gray matter probability map without resampling (http://brainmap.wisc.edu/pages/8-Normalizing-DARTEL-Templates-to-MNI-Space).30 Before the statistical computations, the images were smoothed with an 8-mm FWHM Gaussian filter (see Fig 1 as a flow chart of the procedure).

Flow chart of the image processing streams. The text provides a description of the image-processing stream with numbers referring to T1-weighted processing and letters to DTI processing.
DTI Analyses.
DTI analysis was performed by using in-house software. Diffusion-weighted images were first corrected for distortion induced by eddy currents31; then the diffusion tensor was estimated by linear regression5 and MD and FA maps were computed.4 To use gray and white matter volumes as covariates in the statistical analysis of the DTI data, we had to align the FA and MD maps with the T1-weighted images normalized by using DARTEL as previously reported.22 Briefly, the process was the following: a) The nondiffusion-weighted (B0) images were normalized to the MNI T2 template in SPM5. b) A custom FA template was created by normalizing the FA images by using the normalization parameters from step a; these images were then averaged and smoothed with an 8-mm FWHM Gaussian filter. c) The custom FA template was normalized to the custom T1-weighted template. d) Native space FA and MD images were normalized to the custom FA template (from step c). e) The normalization parameters from step d were multiplied by the inverse transformation parameters of the T1-weighted segmentation (VBM step 1) and applied to both the FA and MD images. f) FA and MD images were rigidly aligned by using the rigid-body component of the transformations produced in VBM step 1 and resampled to 1.5-mm isotropic voxels. g) They were warped by using flow fields from DARTEL (VBM step 4), but they were not modulated. h) DARTEL FA and MD images were normalized to the MNI space by using the affine transformation estimated from the DARTEL gray matter template and the a priori gray matter probability map in SPM5 (VBM step 5 without resampling; http://brainmap.wisc.edu/normalizeDARTELtoMontreal Neurologic Institute). FA and MD images were smoothed with an 8-mm full FWHM Gaussian filter (see Fig 1 as a flow chart of the procedure).
Statistical Analysis
Between-group differences in gray and white matter volumes and DTI measures, regardless of the effect of the other imaging technique, were performed by using SPM5. The same models were used to compare MR imaging changes between patients with and without hyperintense lesions along the corticospinal tracts. Next, microstructural (MD and FA) group differences were tested by using macrostructural variables (gray and white matter volumes) as voxelwise covariates by using the BPM toolbox implemented in SPM5.23 This approach tests for locations where DTI data explain unique variance not accounted for by gray or white matter volume. Reverse ANCOVA comparisons assessing macrostructural volume (gray and white matter volumes) differences between patients and HCs independent of microstructural alterations (FA and MD) were also performed. Finally, multiple regressions were performed in SPM5 to investigate the relationship between MD and FA alterations and clinical findings. All VBM results were obtained by using the general linear model, and the significance of each effect was determined with the theory of Gaussian fields.29 Between-group comparisons and correlation analyses were assessed by using an uncorrected statistical threshold of P < .001 or P < .005, in at least 20 contiguous voxels.
Gray and White Matter Volume Loss with and without Accounting for Microstructural Abnormalities.
Two ANCOVAs were computed to assess gray and white matter volume differences in patients with ALS versus HCs. Smoothed gray and white matter images entered 2 separate models as factors, and total intracranial volume was included as a covariate. Two ANCOVAs were also computed by using the BPM toolbox23 to assess gray and white matter differences, independent of microstructural alterations, between patients with ALS and HCs. Smoothed gray and white matter maps were entered as dependent variables in 2 separate models. Smoothed and modulated MD and FA images were included in the models as imaging covariates.
MD and FA Alterations with and without Accounting for Gray and White Matter Volume Loss.
Two ANCOVAs were computed to assess MD and FA differences in patients with ALS versus HCs. Smoothed MD and FA entered the models as factors. Two further ANCOVAs were computed by using the BPM toolbox23 to assess MD and FA differences between patients with ALS and HCs. Smoothed MD and FA images were entered as dependent variables in 2 separate models. Smoothed and modulated gray and white matter segmented maps were included in the models as imaging covariates.
The Relationship between MR Imaging and Clinical Variables.
Patients with and without hyperintense lesions along the corticospinal tracts were compared in terms of clinical variables by using an ANCOVA adjusted for the subject's age. We performed multiple regressions in which the independent variables were the clinical measures and the dependent variable were subject's MD and FA maps, as well as gray and white matter volume maps. Analyses were restricted to the significant clusters obtained from the ANCOVAs assessed by using BPM.
Results
On the dual-echo and FLAIR scans, hyperintensities of the corticospinal tract were detected bilaterally in 12 (52%) patients with ALS and in 5 (35%) HCs. The remaining 11 patients did not show any brain hyperintensity.
Gray and White Matter Volume Loss with and without Accounting for Microstructural Changes
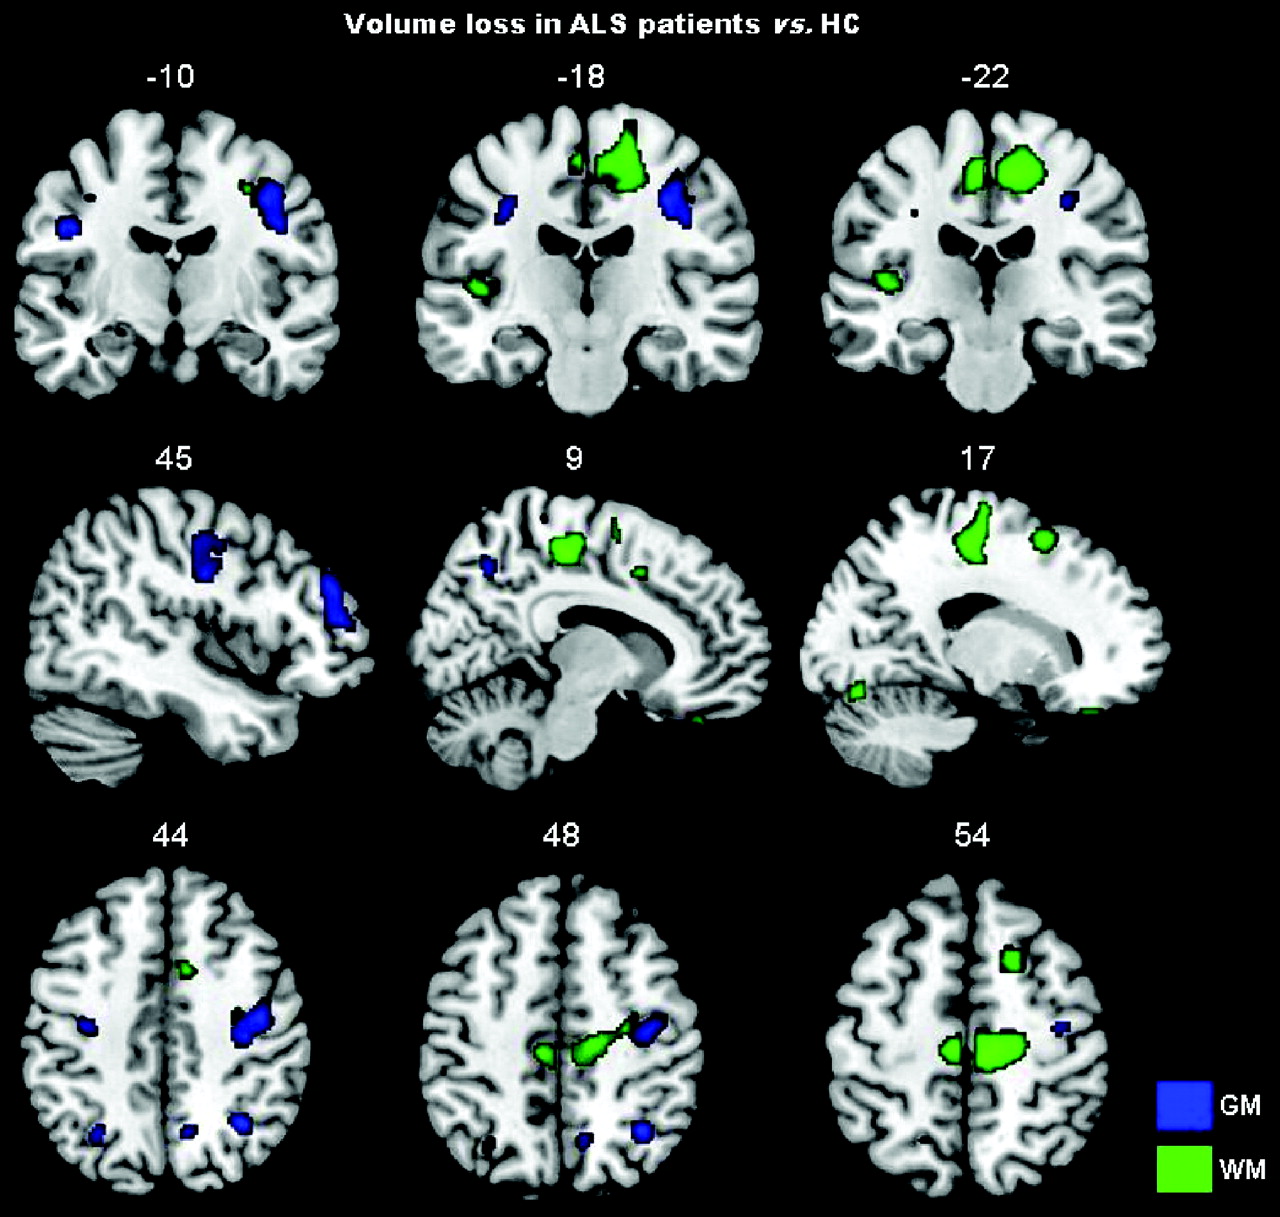
Compared with HCs, patients with ALS showed significant gray matter volume losses in the precentral gyrus bilaterally, right rolandic operculum and angular gyrus, and left middle frontal gyrus (P < .001 uncorrected; Table 2 and Fig 2). In patients with ALS, significant volume losses were also detected in the following white matter areas: left superior frontal region, the vicinities of the supplementary motor area bilaterally, right precentral region, and left inferior temporal region (P < .001 uncorrected; Table 2 and Fig 2). No volumetric difference was found between patients with and without hyperintense lesions along the corticospinal tracts. When we controlled for MD and FA values, patients with ALS relative to HCs showed a small region of gray matter loss in the right angular gyrus (cluster size = 28 voxels; MNI coordinates: x = 33, y = −57, z = 45; t value = 4.04). No regions of white matter loss were found in patients with ALS compared with HCs after accounting for microstructural abnormalities.
Regions of gray and white matter volume loss in patients with ALS compared with HCs

Gray and white matter volume loss in patients with ALS compared with HCs is displayed on the same MNI template. For illustrative purposes, the contrasts are shown at a threshold of P < .005 uncorrected in at least 20 contiguous voxels. Results are in neurologic convention (right is right).
MD and FA Alterations with and without Accounting for Gray and White Matter Volume Loss
After controlling for both gray and white matter volume loss, patients with ALS showed significant increased MD values in the precentral gyrus bilaterally, left inferior frontal gyrus, left insula, left middle temporal gyrus, right temporal pole, left postcentral gyrus, right putamen, right angular gyrus, left supramarginal gyrus, orbitofrontal white matter bilaterally, right posterior limb of the internal capsule, right genu of the corpus callosum, right middle occipital white matter, and the anterior lobe of the cerebellum bilaterally (P < .001 uncorrected; Table 3 and Fig 3). When we controlled for gray and white matter volume loss, patients with ALS relative to HCs showed significantly decreased FA values in the precentral and premotor white matter regions bilaterally and the left inferior frontal white matter (P < .001 uncorrected; Table 4 and Fig 3). Similar results were obtained without imaging covariates (On-line Figure).
Regions of increased MD in patients with ALS compared with HCs accounting for gray and white matter volume loss
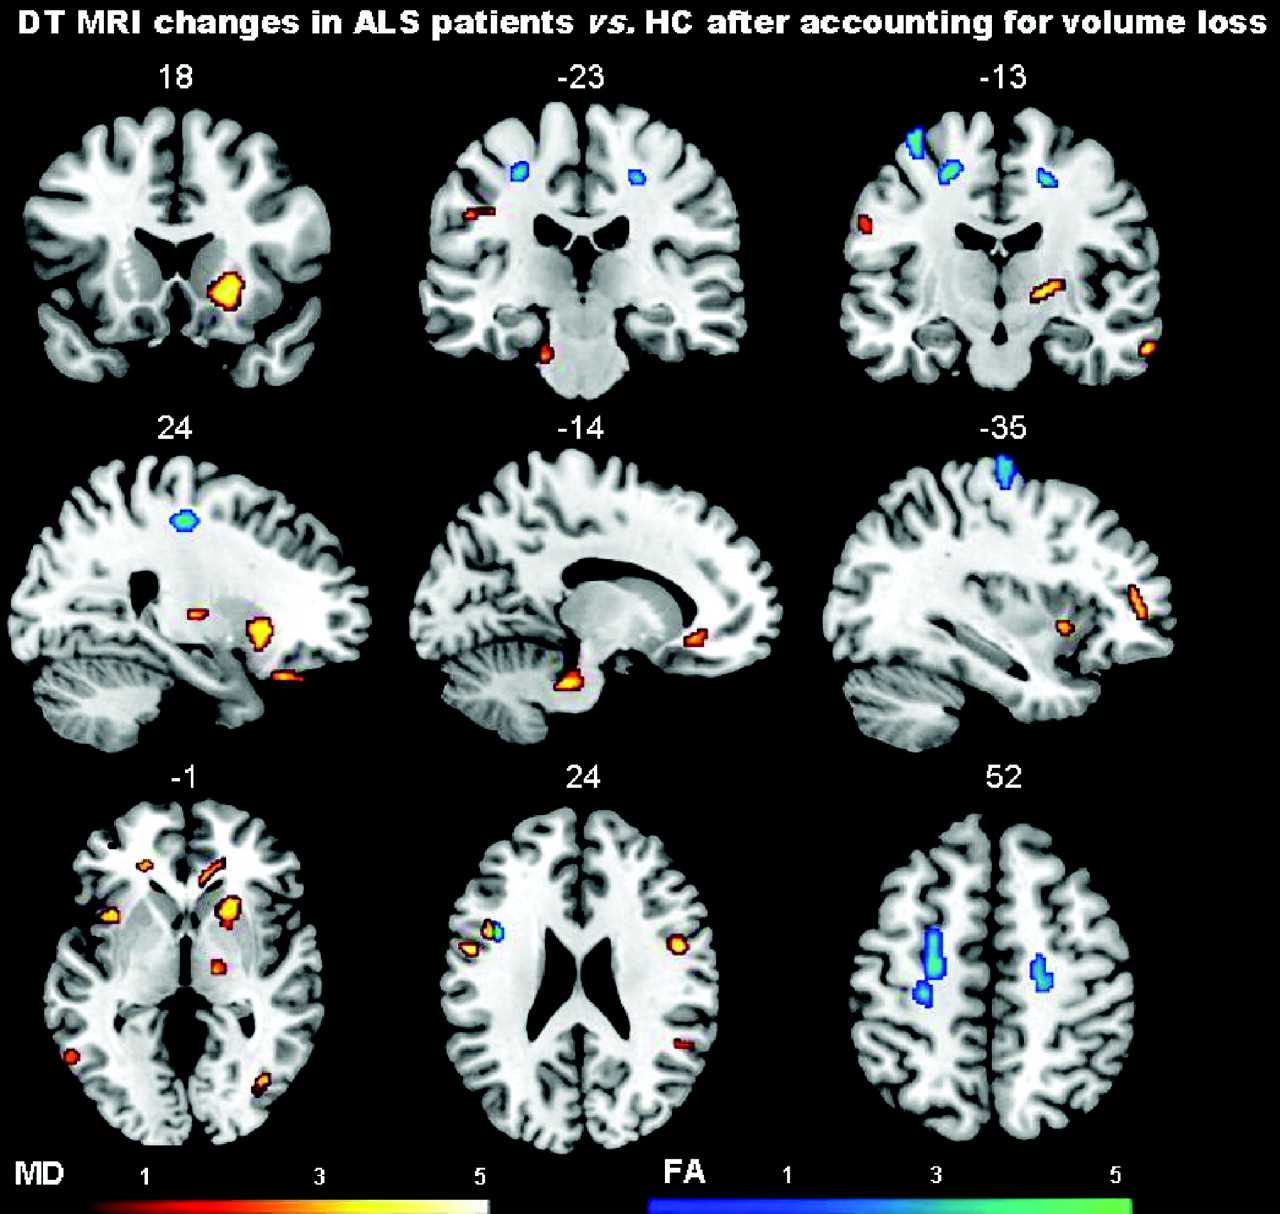
Regions of increased MD and decreased FA, after accounting for gray and white matter volume loss, in patients with ALS compared with HCs are shown on the same MNI template. Contrasts are shown at P < .001 uncorrected in at least 20 contiguous voxels. Color bars denote t values. Results are in neurologic convention (right is right).
Regions of decreased FA in patients with ALS compared with HCs accounting for gray and white matter volume loss
Relationship between MR Imaging and Clinical Variables
No clinical difference was found between patients with and without hyperintense lesions along the corticospinal tracts. In patients with ALS, MD of the orbitofrontal region bilaterally was significantly related to disease duration (MNI coordinates: x = 14, y = 45, z = −13; r = 0.75, P < .001 uncorrected; MNI coordinates: x = −18, y = 43, z = −12; r = 0.60, P < .005 uncorrected). No correlation was found between DTI measures and other clinical variables. Gray and white matter volume losses did not correlate with clinical measures.
Discussion
In this study, we used a multimodal voxelwise imaging approach23 to assess microstructural damage independent of gross gray and white matter volume loss in patients with ALS with mild disability. We found that DTI can detect microstructural brain abnormalities in ALS, even after correcting for atrophic changes. The affected regions included both motor and extramotor areas. Furthermore, the extent of ALS-related DTI abnormalities was greater than that disclosed by the VBM analysis. As a consequence, our findings suggest that DTI abnormalities are more sensitive than volumetry to alterations of brain tissue integrity associated with ALS. There are at least 2 possible explanations, which are not mutually exclusive, for such a finding. First, diffusivity metrics may be sensitive to pathologic changes that are too subtle to have an impact on volume measurements. Second, diffusivity abnormalities may precede atrophy, which appears only after a significant amount of intrinsic tissue damage has occurred. All of this calls for longitudinal studies to clarify the multifaceted relationship between gray and white matter volume and microstructural changes in ALS and suggests that DTI should be viewed as a promising approach to improve our understanding of this condition.
In agreement with previous pathologic1 and neuroimaging studies,7,12,14–18 gray matter loss in the precentral regions bilaterally and in the right middle frontal gyrus was found in patients with ALS. The pattern of white matter loss, which included precentral/premotor regions, the tissue in the vicinity of the supplementary motor area, as well as the frontal and temporal lobes, was also previously observed.16,19,20 Although pathologic studies reported the presence of inflammatory infiltrates in the ALS brain,32 this is not associated with macroscopic alterations such as lesions or edema. As a consequence, we do not believe that inflammation affected our volumetric results at a great deal. The comparison of MD and FA values between patients and HCs without gray and white matter volume maps as imaging covariates showed a much more widespread pattern of gray and white matter microstructural changes, which resemble closely those reported in previous DTI studies of ALS.6,7,11,12 Patients had an increased MD not only in the precentral gyri and along the corticospinal tract bilaterally but also in the corpus callosum; several bilateral frontal, temporal, and parietal regions; and the right putamen and anterior lobe of the cerebellum bilaterally. Patients with ALS also showed decreased FA values in white matter regions located in the vicinities of motor and premotor cortices, which again fit with previous findings.7,8,10–12 No difference in volumetric and DTI features, as well as in clinical variables, was found between patients with ALS with and without corticospinal hyperintensities on conventional MR images. These findings are in line with previous MR imaging studies in ALS showing a low sensitivity and specificity of such abnormalities.6,33–37
When DTI findings were controlled for gray and white matter volumes, MD and FA differences between patients and HCs were very similar to those obtained without correction, thus suggesting that DTI detects ALS-related microstructural changes independent of brain tissue loss. Compared with the analysis in which MD values were controlled for volume loss, the analyses without correction showed only an additional cluster located in the left internal capsule. This finding suggests that most microstructural alterations that we and others observed in patients relative to HCs are reflecting intrinsic tissue damage and not volumetric differences of the regions studied. Several pathologic substrates are likely to contribute to the observed abnormalities of diffusion parameters in the gray and white matter of patients with ALS.4,38 The increased content of unhindered isotropically diffusing water in the extracellular spaces (due to axonal and neuronal loss) can lead to an increased average MD.4,38 Intracellular abnormalities of the surviving axons along with the presence of cell debris, inflammatory infiltrates, and gliosis, which are not associated with the same anisotropic organization of the normal tissue, can result in a reduced average FA.4,38 Most interesting, the reverse analyses, in which gray and white matter volume differences were assessed while accounting for microstructural abnormalities, did not show significant regions of atrophy in patients with ALS compared with HCs, except for a small gray matter area in the right angular gyrus. This finding supports further the hypothesis that DTI indices have a higher sensitivity to ALS-related damage than volumetric measures. In addition, our findings did not change when we ran the analyses also accounting for CSF to minimize the partial volume effect (data not shown).
MD values of the orbitofrontal regions were significantly correlated with disease duration. This result is consistent with previous observations.39,40 Our failure to identify a correlation between MD and FA alterations and clinical disability is in keeping with previous data obtained from patients with ALS.41–44 In addition, in our study, patients had a relatively small spread of ALSFRS scores, and this might have worked against the ability to detect a correlation between structural changes and disability. We also observed MD changes in extramotor brain regions. This finding fits with the notion that ALS pathology does not spare extramotor cerebral areas and that, to a variable extent, it overlaps with the clinicopathologic features of frontotemporal lobar degeneration.45 Most remarkable, MD abnormalities were seen in structures that are typically hit by frontotemporal lobar degeneration,46 such as the insula, inferior frontal, orbitofrontal, and temporal regions.
This study is not without limitations. First, it is cross-sectional, and we can only speculate that the observed microstructural alterations independent of volume loss may precede development of tissue atrophy. Second, as in other studies,12,33,39,44 we failed to find significant relationships between DTI abnormalities and clinical severity or progression rate. This is likely due to the relatively small size and the clinical homogeneity of the sample studied. Third, the small number of patients with bulbar onset did not allow us to assess the pattern of brain damage in these patients separately.
Finally, some methodologic issues related to MR imaging analysis should be addressed. The 2 scan modalities that we used differed in image resolution, and this difference may have affected the results. Nevertheless, because images were resampled to the same voxel size, smoothed equally, and rigidly aligned, we believe that such an impact was small, if any. The significance threshold for regional analysis was set at P < .001 or < .005, uncorrected for multiple comparisons, and such sensitive thresholds might have led to false-positive results. Although larger studies are needed to replicate our findings, we observed MR imaging changes only in brain areas that are known to be the preferential sites of ALS damage from neuropathologic studies. Finally, the relationship between volumes and MD/FA is complex, may be nonlinear, depends on the brain region studied, and may be affected by different pathophysiologic mechanisms. Therefore, by using a linear model, such as ANCOVA, we may not have captured the overall effect of volumetric changes on DTI differences and vice versa.
Conclusions
We showed that microstructural changes affect various brain regions of patients with ALS and that they are independent of volume loss. It is, therefore, tempting to speculate that DTI alterations reflect loss of brain tissue integrity, which can lead to atrophy. Future longitudinal studies are needed to confirm this hypothesis and clarify whether DTI can be useful in making an earlier diagnosis in patients suspected of having ALS.
Footnotes
-
Indicates article with supplemental on-line figure.
Disclosures: Federica Agosta belongs to the Speaker Bureau for Bayer Schering. Giancarlo Comi is a consultant for Bayer Schering and Merck Serono and has financial relationships with TEVA Pharmaceutical Industries Ltd, Novartis, Merck Serono, the Serono Symposia International Foundation, Bayer Schering, and Biogen Dompé. He received an honorarium for speaking activities. Massimo Filippi received research support (including provision of equipment and materials) from Bayer Shering, Biogen Dompé, Genmab A/S, Merck Serono, TEVA Pharmaceutical Industries Ltd, Fondazione Italiana Sclerosi Multipla, and Fondazione Mariani. He belongs to the Speaker Bureau for Bayer Shering Pharma, Biogen-Dompé, Genmab A/S, Merck Serono, and TEVA Pharmaceutical Industries Ltd. He is a consultant for Bayer Shering Pharma, Biogen-Dompé, Genmab A/S, Merck Serono, and TEVA Pharmaceutical Industries Ltd.
References
- Received August 19, 2010.
- Accepted after revision October 30, 2010.
- Copyright © American Society of Neuroradiology


