
Abstract
BACKGROUND AND PURPOSE: A common task in radiology interpretation is visual comparison of images. The purpose of this study was to compare traditional side-by-side and in-place (flicker) image presentation modes with advanced methods for detecting primary brain tumors on MR imaging.
MATERIALS AND METHODS: We identified 66 patients with gliomas and 3 consecutive brain MR imaging examinations (a “triplet”). A display application that presented images in side-by-side mode with or without flicker display as well as display of image subtraction or automated change detection information (also with and without flicker display) was used by 3 board-certified neuroradiologists. They identified regions of brain tumor progression by using this display application. Each case was reviewed using all modes (side-by-side presentation with and without flicker, subtraction with and without flicker, and change detection with and without flicker), with results compared via a panel rating.
RESULTS: Automated change detection with or without flicker (P < .0027) as well as subtraction with or without flicker (P < .0027) were more sensitive to tumor progression than side-by-side presentation in cases where all 3 raters agreed. Change detection afforded the highest interrater agreement, followed by subtraction. Clinically determined time to progression was longer for cases rated as nonprogressing by using subtraction images and change-detection images both with and without flicker display mode compared with side-by-side presentation.
CONCLUSIONS: Automated change detection and image subtraction, with and without flicker display mode, are superior to side-by-side image comparison.
Abbreviations
- AA
- anaplastic astrocytoma
- AUC
- area under the receiver operating characteristic curve
- Bx
- biopsy only
- C
- change detection images presented side-by-side only
- C+F
- change detection with flicker
- CF
- change detection images also allowing flicker display mode
- FLAIR
- fluid-attenuated inversion recovery
- FN
- false-negative
- FP
- false-positive
- GBM
- glioblastoma multiforme
- GTR
- gross total resection
- LCL
- lower confidence interval
- LGG
- low-grade glioma
- N
- normal side-by-side display only
- N+F
- side-by-side plus flicker
- NF
- normal side-by-side mode with flicker
- RECIST
- response evaluation criteria in solid tumors
- S
- subtraction images with side-by-side display
- SF
- subtraction images with flicker display mode
- STR
- subtotal resection
- TN
- true-negative
- TP
- true-positive
- TTP
- time to progression
- UCL
- upper confidence interval
A common task in radiology interpretation is visual comparison of images from 2 or more time points to assess for changes in the status of a patient's disease. This type of comparison task began when images were collected on film, and it continues in the era of PACS. However, computer technologies are available that allow for other modes of image display, but image comparison continues to be performed by using side-by-side display mode.1 Image registration is a technique where 3D images (including 2D multisection images with sufficiently thin sections) are aligned with each other, correcting for differences in section angulations and position. Computers also can use information from multiple image types as well as time points in ways that objectively characterize unique properties, such as types of change. Although the value of image registration has been described, image comparison continues to be performed by using side-by-side display mode alone, or with subtraction versus side-by-side mode. One alternative is “flicker” display mode, in which a pair of images is alternately displayed at the same location on the screen. Perceptual scientists have demonstrated that flicker display allows for detection of very subtle changes,2 and indeed, it is used for detection of changes due to irreversible image compression. Other methods for detecting subtle changes include image subtraction and change detection. Most radiologists are familiar with subtraction from methods such as digital subtraction angiography. Change detection involves computation that uses more than 1 image type and applies scientifically based consistent thresholds for change, rather than relying on human decision about the degree of change. In this study, we compared side-by-side display mode without and with flicker display mode, subtraction of registered images without and with flicker display mode, and change detection images with and without flicker display mode, for their value in detecting changes in brain tumors.
Materials and Methods
Examination Selection
After institutional review board review and approval, we found 66 subjects with MR imaging brain examinations and surgically confirmed brain gliomas that met the following criteria: 1) they must have had 3 MR imaging examinations performed at our institution, by using our standard brain tumor protocol, over a course of no more than 8 months (8 months was used to effectively exclude patients who had intervening scans at other institutions, or other unusual tumors or circumstances); 2) the original radiologist interpretation of the second examination must have indicated either no change or slight/possible progression (specific terms were selected and must have been in the text of the report); and 3) the 3 examinations had to be free from significant artifact (eg, patient motion). The MR imaging examination included pre- and post-contrast T1-weighted images (TR, 400–600 ms; TE, <20 ms), T2-weighted FLAIR images (TR, 11 000 ms; TE, 144 ms), and T2-weighted images (TR, 2000–2200 ms; TE, 80–100 ms), all with FOV 22–26 cm and 1 NEX. The sequences were acquired in the oblique-axial plane aligned with the anterior/posterior commissure line with 4-mm section thickness, 0-mm intersection spacing, and approximately 1-mm in-plane resolution. Please note that we refer to these images as “3D,” because they have a regular X, Y, and Z spacing, though they were all 2D spin-echo acquisitions.
Image Processing
We selected the Pre, Post, FLAIR, and T2 sequences from each of the 3 examinations in the triplet. All sequences were registered to match the postgadolinium sequence of the second examination. We used a modified version of the normalized mutual information method from the Insight Toolkit(http://www.itk.org). After registration, each series from examination 1 was subtracted from the corresponding registered images in examination 2. Examination 3 was only used for the panel for cases where the comparison between examination 1 and examination 2 (first pair of examinations) was equivocal. Hence, this was not done for most cases.
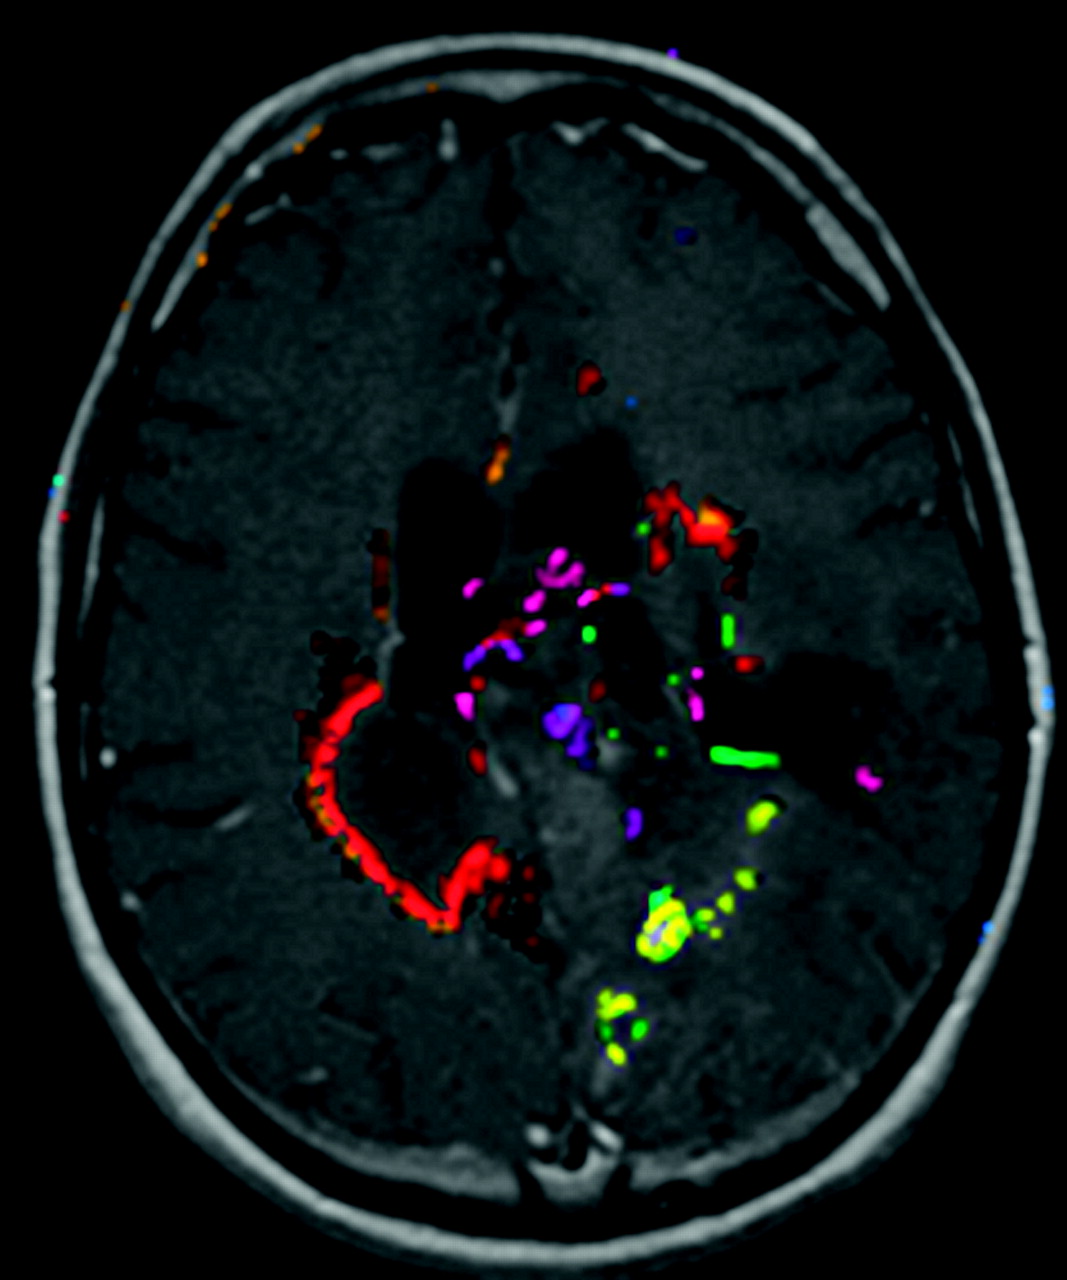
We also applied an automated change detection algorithm3,4 to the first pair of examinations. This algorithm uses information from both examinations, as well as knowledge about biology and MR imaging artifacts to produce change maps (Fig 1 ).

Example output of the automated change detection algorithm. Compared with simple image subtraction, change detection combines information from all multiple MR pulse sequences and uses knowledge about how progression or regression appears on the sequences, as well as standardized ways to set thresholds for true changes. Different colors represent different types of change, eg, red means new enhancement and T2 signal intensity abnormality, yellow means new nonenhancing T2 signal intensity abnormality, green means reduced T2 signal intensity abnormality, and purple means less enhancement and less T2 signal intensity abnormality.
Examination Presentation
A display application allowed raters to see all 4 pulse sequences from the first 2 examinations; they were not allowed to see the third examination. Because the examinations were registered, the application always “linked” the images, ie, changing the section changed all sequences for both examinations (Fig 2).

A, Display application showing old (B = baseline) and new (F = follow-up) examinations in an above/below format. Note that this case allows the user to view the automated change detection overlay (the “Show CD Overlay” checkbox is enabled) but not image subtraction (“Subtract Images” is disabled). This also allows flicker mode, because the “Base Examination on Top” checkbox is enabled. Checking or unchecking that box changes whether the top row shows the baseline or follow-up examination. B, Display application with subtraction image, showing slight enlargement of the tumor nodule in the right frontal region (white arrow). C, Display application showing color change detection overlay on the images, as well as radiologist marking indicating progression, with confidence level of 3 (third image, top row).
In addition to the 4 acquired series from the 2 examinations, there were 2 additional computed image sets: subtraction and change detection images. During a reading session, some examinations were viewed with subtraction images, change detection images, or only the original images; and among these 3 methods, these may or may not have had flicker display. So, each session presented 10 unique examinations in 6 presentation methods. If neither subtraction nor change detection images were available, we referred to that as normal or N display mode; S meant subtraction images could be viewed; and C meant change detection images could be viewed. For each of these modes, the rater might also “flicker” (F) between images, creating a total of 6 presentation modes (N, NF, S, SF, C, and CF). When subtraction or change detection images were available, the flicker could also alternate between the subtraction or change detection image and the original image, to allow the reader to see the actual image data that resulted in the subtraction or change detection image appearance. The display application allowed the user to mark areas of tumor progression, along with their certainty level on a 1–3 scale as well as record the amount of time spent reviewing the case.
Data Collection
Three board-certified neuroradiologists reviewed each of the 66 cases in all of the display modes. Over the course of the 6 rating sessions, all 66 examinations were presented with all possible display modes. The rating sessions were conducted over a period of 4 months.
The radiologists were requested to mark each noncontiguous area of tumor progression, along with a certainty rating (1 = possible, 2 = probable, 3 = certain). Because this study focused on progression of the examination, if there was 1 area marked with a certainty of 1 and another marked as 3, the examination was rated as 3.
Establishment of Criterion Standard
There were 2 criterion standards for this study. The first criterion standard was a binary decision as to whether there was progression present on the second examination. This standard was used for sensitivity and specificity calculations. Each of the 66 cases was reviewed by all 3 neuroradiologists in a panel format, where the panel was asked to determine whether progression was present, and if so, the location(s) of progression. Sixty-three of the 66 cases had unanimous panel ratings of progressive or nonprogressive disease on the basis of the images. For the 3 cases lacking unanimity, the clinical history was reviewed, and a final determination was made via a panel review of examination 1 and examination 2 (first pair of examinations) in conjunction with examination 3.
The second criterion standard was the TTP, which was used fordetermining which method could best predict the time to progression, by using RECIST criteria. Independently and blinded to other findings, one author (B.J.E.) also reviewed the subsequent clinical history and imaging by using RECIST5 to assign the progression date. The TTP was defined as the time from the second examination date to the time of this progression date.
Statistical Methods
This study uses a “case certainty” rating by taking the maximum value of all lesion ratings for a given examination. The case rating was then converted to a binary “progression” (maximum rating of 2 or 3) versus “no progression” rating (maximum rating of 0 or 1) for purposes of computing the descriptive statistics (see On-line Table 2; first criterion standard). Sensitivity and specificity for each of the 6 presentation modes were calculated separately for each of the 3 reviewers as well as for when all 3 reviewers agreed. Comparisons of sensitivities and specificities among the presentation modes were done in a pair-wise manner by using the McNemar test. The area under the receiver operator characteristic curve was calculated for each reader for each method, along with 95% confidence intervals.
Agreement among the reviewers within each presentation mode was assessed by using κ statistic. All of the statistical tests were 2-sided, and P values < .05 were considered statistically significant. No adjustment was made for multiple comparisons.
Survival curves for time to progression based on all 3 rater agreement also were produced. All analyses were performed by using SAS software, version 9.1 (SAS Institute, Cary, North Carolina).
Results
Subject Demographics
The demographics and brain tumor types are shown in On-line Table 1. These data reflect the demographics of the patients at the time that the first examination was performed.
Display Method Comparison
We found that automated change detection with or without flicker as well as subtraction with or without flicker was significantly better than traditional side-by-side mode if we required all 3 raters to agree, as well as for most readers for sensitivity (On-line Tables 2 and 3). There was not a significant difference between change detection with or without flicker and subtraction with or without flicker. There was no difference in specificity between any of the methods.
In those cases where all 3 readers agreed, sensitivity and specificity were higher for all methods. This subgroup also showed significantly better sensitivity for change detection with or without flicker and subtraction without flicker over side-by-side mode.
The receiver operator characteristic curves show a trend for side-by-side display to perform inferior to change detection and subtraction, but there is overlap (On-Line Table 4).
Rater Agreement Measurements
On-line Table 5 shows the κ agreement statistic between raters. Automated change detection without flicker had the highest mean agreement score, followed by change detection with flicker. Image subtraction with and without flicker was in the middle, and the traditional side-by-side method with or without flicker fared the worst. One can see that nearly all κ ratings were in the excellent range for change detection (with or without flicker), whereas 5 of the 6 ratings were in the good range for side-by-side mode (N and NF) based on Cohen.6 According to Cohen if κ is <0.4, agreement is considered poor; if κ is 0.4–0.75, agreement is considered good; and if κ is >0.75, agreement is considered excellent. Subtraction had 4 ratings in the upper end of good and 2 in the excellent range.
Rater Review Time Measurements
We noted a clear trend for more markings of tumor progression to be created on images presented with image subtraction and automated change detection. Because it takes time to create a marking, display methods that encouraged more markings would take longer to review. Therefore, we compared the “negative” cases—essentially comparing how rapidly users came to a conclusion when a case was negative. On-line Table 6 shows the review times, number of marks, and average time per mark for cases rated as not progressing, for each rater. Two of the raters were most efficient with subtraction. Normal side-by-side mode tended to be slowest, though for 1 rater, it was the fastest review method. Flicker mode was slower than its nonflicker companion mode for 8 of the 9 rater-mode comparisons.
TTP
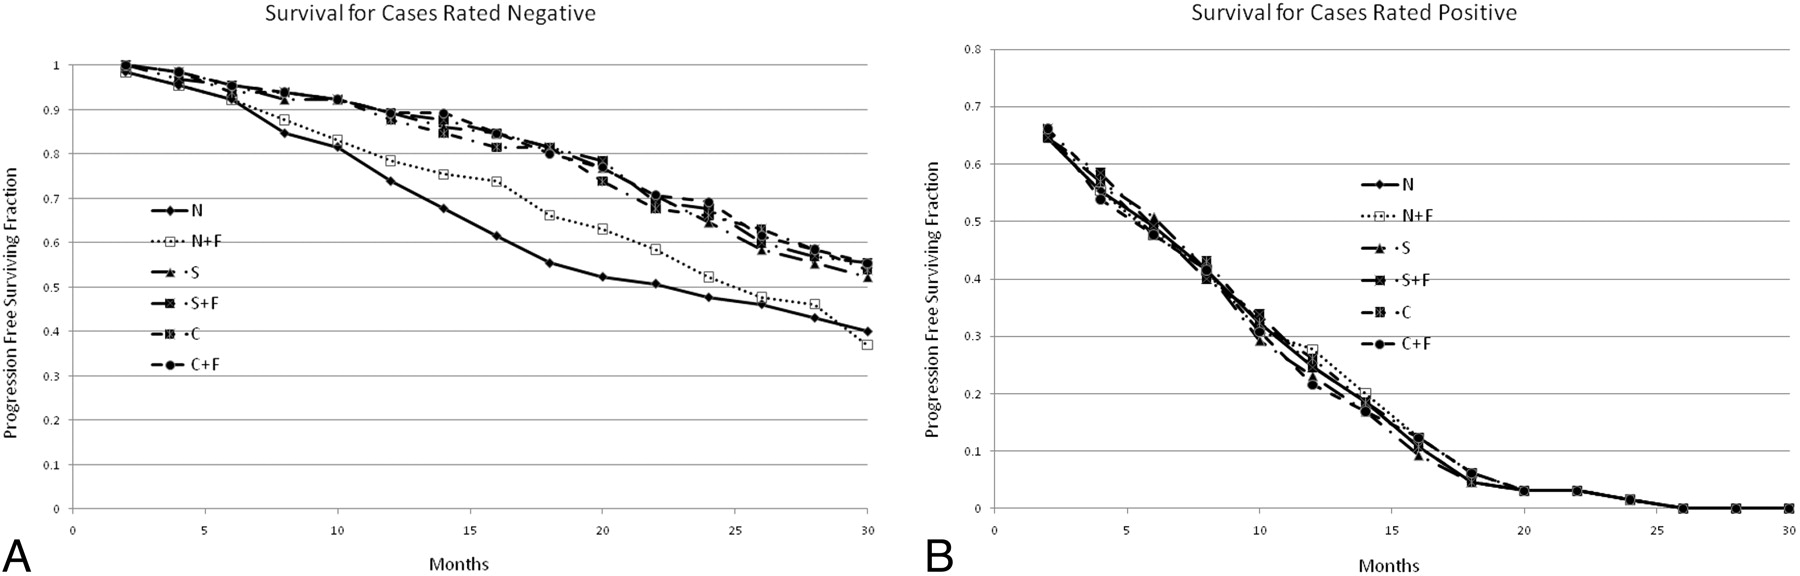
Figure 3 shows the survival curves for cases where all 3 raters agreed there was no progression and where there was progression. The TTP for cases rated “no progression” was delayed for both automated change detection and image subtraction, with or without flicker, compared with the traditional side-by-side method. For cases rated as progressing in this study, there was no statistically significant difference in the TTP, though there was a trend for the side-by-side display method to perform worse.

A, Survival curves for each display method, when all of the raters determined there was no progression. This graph demonstrates that methods by using flicker display help to correctly identify the cases that are negative (that will have long times until progression). The N method was significantly different from the others at the P < .05 level, but there was no difference between the other methods. B, Survival curves for each display method, when all raters determined that there was tumor progression. This graph suggests that the “normal” display mode (with or with flicker) identified some cases as progressers that actually will not progress in the near term. The differences were not statistically significant.
Discussion
We found an improvement in rater performance when using advanced tools for display. Automated change detection and subtraction significantly increased the ability to detect subtle progression of primary brain tumors, relative to the traditional side-by-side image comparison method. They also had value in determining that a given case was truly negative: if a case was considered nonprogressive after using these tools, there was a greater TTP than if these tools were not used. Although change detection and subtraction showed similar performance, it is important to note that they are fundamentally different, in that subtraction highlights changes, but the observer must always determine whether this change is “real.” Change detection includes a step where that decision threshold is set and probably accounts for the trend for greater agreement between observers.
We had expected that the automated change detector might have an efficiency advantage (more rapid time to rate a case) because it integrates information from several images into a single image to determine possible areas of progression, but this was not demonstrated here. It may be that the change detector was overly sensitive and labeled areas as progression that, after careful study, were not progression. This may be worth a separate investigation.
It was expected that flicker would show a significant advantage in determining tumor progression, particularly because flicker mode was the method preferred by the panel to decide difficult cases. We did not see an advantage for flicker, perhaps because this display method was new to 2 of the 3 raters, and they may not have used the technique optimally. NF should have taken longer than N, because when using flicker as a first-line strategy (rather than a confirmatory strategy) on images with changing acquisition parameters, the rater should have stared at various regions of the flicker image for every section, for several seconds per region. That an increased time was not observed suggests that the raters did not benefit from flicker because they failed to use it optimally. We do note that the rater that had more experience with flicker (from other research projects using flicker display mode) showed a greater advantage for flicker; so, it may be that if there had been a greater training period, there might have been an advantage detected. Because flicker has shown an advantage for other perception tasks, we believe that further investigation of this negative result is warranted.
Radiologists have long compared examinations from different time points in chronic diseases such as cancer. Historically, hardcopy images have been compared side-by-side as a natural extension of the method of image acquisition. With digital acquisition, the requirement for side-by-side comparison was removed, but the convention has continued, even though human perception is less effective at detecting differences in images when a saccade is required.2
Studies of the efficiency of interpreting imaging examinations on computer displays versus film have been performed. In most such studies, the raters were relatively new to computer-based interpretation, there was little effort to implement alternative display modes for computers, and therefore these largely emulated the film comparison format.7 Reports on the benefits of electronic interpretation times generally show a benefit, ranging from dramatic to moderate8 to none.9 However, those studies generally did not evaluate the mode of display, but simply the speed. Additional studies have documented an advantage in understanding complex, spatial relationships for “stack-mode” display versus “tile-mode (film mode)”10 as well as substantially faster interpretation times for cross-sectional studies.8,11
Image registration is more challenging to implement in clinical practice, limiting its use in clinical practice. This study used only rigid body registration, which is faster and more reliable than image warping. Rigid registration works well for certain anatomies where the body parts remain fairly fixed, including the brain and skull. Schellingerhout et al.12 demonstrated the clinical utility of image registration applied to head CT, for both agreement of radiologic interpretation and a reduction in time to report an examination. For other body parts such as the abdomen, rigid registration does not work well, and either subregions must be selected or warping must be applied.
Once registration is complete, other processing and display options are available, the most obvious being image subtraction. Image subtraction has been used in some cases where the images were acquired in the same spatial setting (eg, subtraction angiography), though algorithms have been proposed for adjusting for different patient positions in projection radiographs.1 Postacquisition computed registration opens up many new possible applications. The value of subtraction has been demonstrated in several MR applications, including multiple sclerosis13,14 and brain tumors.15 In the Tan et al14 study, they used a custom application that always showed old and new examinations in a combined registered and subtracted image; but the value of each display mode was not evaluated.
The report by Alpert et al16 describes the use of image registration and subtraction of CT scans without and with contrast material for improving diagnosis of vascular lesions. They also made the argument that the technology was mature and should be routinely applied in clinical practice. However, their report was focused on the accuracy of registration with few clinical examples and did not document the clinical value in terms of sensitivity, specificity, or efficiency. Takao et al17 describe the application of a nonrigid registration method to chest CT and describe good visual results. They also presented subtraction images as a good way to allow improved perception of changes over time. Unfortunately, they did not take the next step of formally testing it versus other display methods with multiple radiologists. Other applications described13 include detection of posttraumatic changes, as well as changes due to inhalation of 100% oxygen. We note, however, that this report did not document any comparison to other display modes, nor evaluate its possible clinical value.
We did not study the value of detecting small changes in brain tumors. The difference in TTP in this study suggests that there may at least be prognostic value and that may be important in deciding how aggressively to manage patients, especially with continuing advancements in therapy. The value for low-grade tumors may be greater, though we did not separately study low- versus high-grade tumors. It is not uncommon practice to observe tumors until they dedifferentiate or “go bad.” Having the ability to detect subtle changes may allow us to detect the change earlier and possibly allow intervention before the tumor grows so large that it cannot be completely resected or aggressively treated.
These display modes also may be of value in clinical trials and may lead to new treatment algorithms. The cost of conducting a clinical trial is directly proportional to the duration of a study and the number of subjects. These are both directly affected by the tumor measurement method. A technique that could reliably detect small progressions might allow clinical trials to be conducted on smaller cohorts (because of less variability) with a shorter duration (because of higher sensitivity).
There are some important limitations to this study. We recognize that 1 of the standards used here was based on the opinion of the panel and not on biopsy proof. Biopsy proof is hard to obtain in change analysis method studies, because getting tissue to measure the state at the baseline time point will disturb the follow-up images. It is possible that all 3 radiologists will incorrectly assign an examination pair to 1 category. In that case, the method that most agrees with the 3 raters will look good but will be equally wrong. We also note that we did not power this study to account for multiple comparison adjustments.
We did compare the results with TTP, which is broadly used in clinical trials, but it is partially based on imaging measures and therefore is somewhat circular. Because RECIST is based on large imaging changes (ie, >20% increase in the maximum dimension of the tumor versus the baseline examination), it is rather insensitive, and because it is based on 1 unidimensional measure, it also has a large amount of noise due to variations in positioning of the measurement line. In our case, we did show that having a negative examination (“no progression” based on this study's definition) by using the registered change detection or subtraction images with or without flicker display did predict stability for a longer period than without these tools. There was not a difference for cases where there was progression. We suspect that this may be due to the fact that detecting small changes early when presently there is no effective treatment may not have an impact on outcome. In addition, this information about early progression was not available to the treating physician, so there was no opportunity to alter treatment. We should also note that the ability to detect early progression might allow for new treatment algorithms or yet to be developed therapies that could result in some improved outcome, though this is speculation.
The display application was not incorporated into our clinical PACS. Translating this research application into a clinical software application will be challenging unless vendors provide support for these tools and display modes. We believe this represents an opportunity for vendors to develop innovative solutions that could potentially improve patient care and might give them a competitive advantage.
Another limitation is that these results cannot be generally applied to all body parts. The brain is a relatively fixed structure and is amenable to rigid registration. Other studies of rigid registration have demonstrated little advantage or even disadvantages for structures that move, such as those in the abdomen.18 Therefore, the applicability of this study is limited to the rigid structures such as the head or spine, until a suitable registration method has been found.
Conclusions
This study has demonstrated that image registration with subtraction or automated change detection improves sensitivity, specificity, interrater agreement, and efficiency for assessment of changes in brain tumors on MR imaging. We did not see an advantage for flicker display by itself versus traditional side-by-side display mode, though there was a trend. We believe that the resulting improvement in rater accuracy and speed warrants broader adoption of image registration with subtraction or change detection in clinical practice. Flicker display also may be valuable and is simple to implement once registration has been performed.
Footnotes
-
This study was supported by National Cancer Institute grant R21CA121539.
Indicates open access to non-subscribers at www.ajnr.org
References
- Received November 15, 2010.
- Accepted after revision January 18, 2011.
- © 2011 by American Journal of Neuroradiology
In this issue


Jump to section
Related Articles
Cited By...
- No citing articles found.