
Abstract
BACKGROUND AND PURPOSE: Cerebral perfusion and O2 metabolism are affected by physiologic age-related changes. High-resolution motion-corrected quantitative T2′-imaging and PASL were used to evaluate differences in deoxygenated hemoglobin and CBF of the gray matter between young and elderly healthy subjects. Further combined T2′-imaging and PASL were investigated breathing room air and 100% O2 to evaluate age-related changes in cerebral autoregulation.
MATERIALS AND METHODS: Twenty-two healthy volunteers 60–88 years of age were studied. Two scans of high-resolution motion-corrected T2′-imaging and PASL-MR imaging were obtained while subjects were either breathing room air or breathing 100% O2. Manual and automated regions of interest were placed in the cerebral GM to extract values from the corresponding maps. Results were compared with those of a group of young healthy subjects previously scanned with the identical protocol as that used in the present study.
RESULTS: There was a significant decrease of cortical CBF (P < .001) and cortical T2′ values (P < .001) between young and elderly healthy subjects. In both groups, T2′ remained unchanged under hyperoxia compared with normoxia. Only in the younger but not in the elderly group could a significant (P = .02) hyperoxic-induced decrease of the CBF be shown.
CONCLUSIONS: T2′-mapping and PASL in the cerebral cortex of healthy subjects revealed a significant decrease of deoxygenated hemoglobin and of CBF with age. The constant deoxyHb level breathing 100% O2 compared with normoxia in young and elderly GM suggests an age-appropriate cerebral autoregulation. At the younger age, hyperoxic-induced CBF decrease may protect the brain from hyperoxemia.
ABBREVIATIONS:
- BOLD
- blood oxygen level–dependent
- deoxyHb
- deoxyhemoglobin
- GM
- gray matter
- GM frontoparietal
- frontoparietal cortex (automatic ROI)
- MPRAGE
- magnetization-prepared rapid acquisition of gradient echo
- OEF
- oxygen extraction fraction
- PASL
- pulsed arterial spin-labeling
- rCBF
- regional CBF
Brain tissue depends almost exclusively on oxidative phosphorylation; hence, its functional and structural integrity relies on a constant oxygen supply provided by brain perfusion. A close functional coupling between cerebral O2 metabolism and CBF by cerebral autoregulation satisfies the O2 demand, even during neuronal activation, and protects the brain from high partial pressures of oxygen.1 Pathologic change in 1 or both of these parameters or the cerebrovascular autoregulatory mechanism may result in cerebral dysfunction. Chronic arterial hypertension is one of the most important factors affecting cerebrovascular autoregulation.2 Furthermore, alterations in CBF or in cerebrovascular autoregulation are discussed in neurodegeneration.3,4 An acute breakthrough of autoregulation may play an important role in acute hypertensive encephalopathy, eclampsia, and in acute brain injury.5,6
CBF of the cerebral gray matter decreases with increasing age,7⇓⇓⇓⇓⇓⇓⇓–15 and the decrease of CBF might be explained by impaired cerebral autoregulation due to changes in endothelial function16 or, alternatively, by a decrease in cerebral O2 demand. Degenerative microvascular changes associated with normal aging17 may also reduce the level of CBF in aging brains.
In the past, O2 metabolism and CBF were studied with methods having disadvantages such invasiveness (eg, contrast agents, blood samples), radiation exposure, and/or limited spatial resolution (eg, PET).11,18⇓–20 Noninvasive quantitative MRI can also be used to measure O2 metabolism and CBF21⇓⇓⇓⇓⇓⇓⇓–29 and to differentiate physiologic age-related changes from pathologic changes.28⇓⇓⇓⇓⇓⇓⇓⇓⇓⇓–39
The BOLD effect40 describes the dependence of transverse relaxation time of blood water on blood oxygenation. Because the field gradients around erythrocytes increase in the presence of the paramagnetic deoxyHb and result in accelerated spin dephasing, increasing deoxyHb will cause reduced values of the effective transverse relaxation time T2* and thus reduced signal in T2*-weighted images.37,38 Because T2* is also affected by the transverse relaxation time T2, which is known to increase with age and in almost all cerebral pathologies, the relaxation time T2′ can be calculated from 1 / T2* − 1 / T2 = 1 / T2′. T2′ provides mainly information about local concentrations of DeoxyHb.31,41 In a retrospective study on a 1.5 T scanner, T2, T2′, and T2* values of the white matter, the thalami, and the basal ganglia have already been quantified31 on the basis of this technique.
Perfusion mapping based on PASL is useful to quantify rCBF.42
In this prospective study, we performed high-resolution motion-corrected quantitative T2′-imaging and PASL-MR imaging in elderly healthy volunteers. A preceding study investigating this methodic approach in the gray matter of healthy young subjects suggested that it is accurate to evaluate cerebrovascular autoregulation under hyperoxic conditions (Wagner M, Magerkurth J, Volz S, et al; unpublished data, 2011). The present study investigated the degree to which the CBF of cerebral gray matter decreases with age, whether there is a similar decrease of the oxygen content of the gray matter with age, and whether there are age-related changes of the cerebral autoregulation tested under hyperoxia (inhalation of 100% O2).
Materials and Methods
Subjects
Twenty-two healthy elderly volunteers (60–88 years of age; median, 66 years) were studied. The protocol was approved by the institutional review board, and informed consent was obtained from each subject. Standardized questionnaires were used to exclude neurologic or psychiatric diseases, diabetes, or untreated hypertension. Following data analysis, 2 subjects had to be excluded due to pronounced motion artifacts.
MR Imaging Examination
Studies were performed on a 3T MR imaging scanner (Magnetom Trio; Siemens, Erlangen, Germany) by using an 8-channel phased-array head coil for signal reception and a body coil for radio-frequency transmission. MR imaging was performed using ear protection; but to avoid artificially low brain metabolism, no further sensory deprivation was used.11,20 Two scans were obtained, either while subjects were breathing room air or while subjects had been ventilated with 100% O2 (flow rate 10 l/min) via a close-fitting mask covering the mouth and nose. Because oxygen saturation is known to reach its maximum after approximately 70 seconds,43 the volunteers were continuously ventilated with 100% oxygen during the entire second series of MR imaging scans, and T2′ and PASL measurements were performed after running an anatomic scan (T1-weighted MPRAGE; duration, 7 minutes, 23 seconds) to ensure an equilibration of the maximum oxygen saturation.
For quantitative T2*-mapping, a multiple gradient-echo sequence with 8 echoes per excitation acquired exclusively under positive readout gradient polarity44 was used with the following imaging parameters: TE ranging from 10 to 52 ms with a constant increment of 6 ms, TR = 3000 ms, 50 axial sections with 2-mm section thickness, no intersection gap, bandwidth = 300 Hz/pixel, matrix size = 160 × 128 (readout × phase encoding), FOV = 200 × 160 mm2, isotropic spatial in-plane resolution = 1.25 × 1.25 mm2, measurement time = 6 minutes 24 seconds. To avoid erroneous T2* values due to distortions of the static magnetic field B0,45⇓–47 a compensation method was applied48 on the basis of obtaining B0 distortion maps directly from the complex image data and correcting for TE-dependent image intensity reductions induced by through-plane spin dephasing. The acquisition was repeated with 50% spatial resolution in the phase-encoding direction (duration, 3 minutes 30 seconds), and a special combination of data in k-space was used, which was optimized for the suppression of motion-induced artifacts.41
Quantitative T2 mapping was based on a series of T2-weighted images with different values of TE (17, 86, 103, 120, 188 ms) by using a TSE sequence. TR had a constant value of 10 seconds, and all geometric parameters (spatial resolution and spatial coverage) were identical to those in the T2*-mapping experiment. Before T2 fitting, the TSE images were coregisterd to the first T2*-weighted image by using the linear registration algorithm implemented in FSL (http://www.fmrib.ox.ac.uk/fsl/fsl/list.html)49 known as FLIRT.50
Data fitting was performed with custom-built programs written in Matlab (MathWorks, Natick, Massachusetts), by using exponential fitting for obtaining maps of T2* and T2. Maps of T2′ were calculated as 1 / T2′ = 1 / T2* − 1 / T2.
Anatomic imaging was based on a T1-weighted MPRAGE sequence51 with the following parameters: TR/TE/TI = 2250/2.6/900 ms, whole-brain coverage, isotropic spatial resolution = 1 mm3, bandwidth = 200 Hz/pixel, duration = 7 minutes, 23 seconds. This dataset was used for segmentation of gray and white matter and automatic definition of ROI. The fitted maps (T2, T2*, and T2′) were linearly coregistered to the T1-weighted anatomical data set using FLIRT.50
For quantitative measurement of brain perfusion, 100 pairs of control and tag images were acquired with a PASL technique. The labeling method used was quantitative imaging of perfusion by using a single-subtraction second version with interleaved thin-section TI periodic saturation as described by Luh et al,52 applying the proximal inversion with a control for an off-resonance-effects labeling scheme, in which arterial spins are labeled by a thick inversion slab proximal to the imaging sections. The scanning parameters were the following: FOV = 22.4 × 22.4 cm, matrix size = 64 × 64, isotropic in-plane resolution = 3.5 × 3.5 mm2, 5 axial sections of 6 mm each, TR = 2500 ms, TE = 21 ms, TI1/TI1stop/TI2 = 700/13,750/1400 ms. The gap between the tag inversion slab and the first of the imaging sections was 10 mm. The duration was 8 minutes, 20 seconds.
It is known that breathing 100% O2 reduces the T1 relaxation time in the lung approximately 5%–15% compared with room air inhalation.53⇓–55 Uematsu et al56 reported an 11% T1 decrease in the cerebral cortex when subjects were exposed to 100% O2 in a mouse model studied at a field strength of 9.4T. Considering that hyperoxic-induced T1 relaxation time change in the lung represents an upper limit of T1 change, we used an estimated factor of 10% to correct T1 values before computation of the PASL-based CBF maps under hyperoxic inhalation.
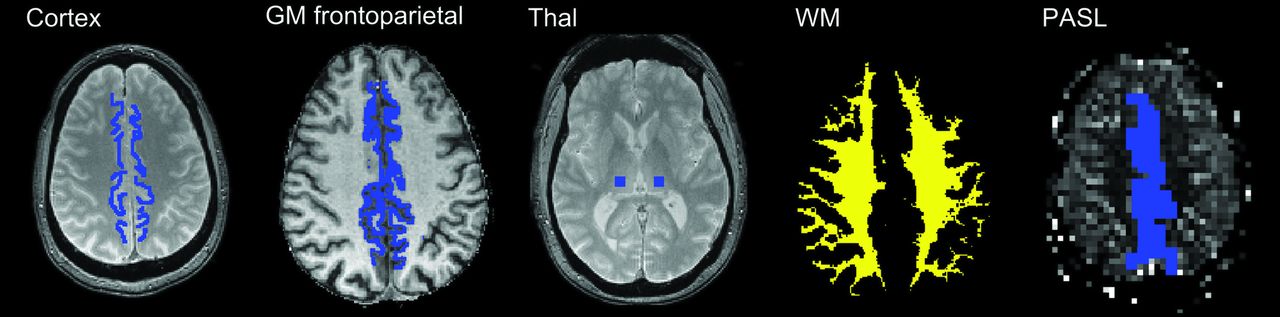
ROIs were manually placed in frontoparietal paramedian cortical structures and in the thalami (Fig 1) GM frontoparietal and whole WM ROIs were also defined following automatic segmentation with SPM8 (http://www.fil.ion.ucl.ac.uk/spm) of the T1-weighted dataset by thresholding the tissue probability maps at 0.95. Due to a low number of sections, only the manually drawn region of interest in the frontoparietal paramedian cortex was defined for the PASL images.

Manually placed ROIs on the first T2*-weighted image (TE = 10 ms) in the frontoparietal paramedian and thalamus. Automatically defined GM frontoparietal and WM ROIs from automatic segmentation. Due to a low number of sections, only the manually drawn region of interest in the frontoparietal paramedian cortex was defined for the PASL images.
Both manual and automatic ROIs were used as masks to extract T2, T2*, and T2′ values from the corresponding maps. For each region of interest, mean normoxic T2′ and CBF values were extracted by using fslstats, as part of FSL.49 The results were compared with those of the same parameters assessed under hyperoxic ventilation by using the Wilcoxon signed rank test. Statistical comparison was performed by means of the software R Statistics (http://www.R-project.org).57 Results were compared with those of the young healthy volunteers previously described, a study also approved by the local ethics committee.
Results
Significant differences between elderly and younger (Table 1) healthy volunteers were found in both cortical CBF (P < .001) and T2′ values of cortical GM (manual and automatic region-of-interest modalities, both P < .001) and WM (P < .001) under normoxic conditions. We found a significant CBF decrease (P < .001) of 30% from younger to elderly volunteers (Fig 2). While cortical T2* values changed as a trend (manual region of interest, P = .074) or significantly (automated region of interest, P = .037) and T2* values of the white matter remained unchanged, T2′ of both the cortex and white matter decreased highly significantly (P < .001 each) due to the increase of cortical (as a trend, P = .063) and white matter (highly significantly, P < .001) T2 values with age (1 / T2′ = 1 / T2* − 1 / T2), though this effect was less pronounced than the CBF reduction.
Parameter values (millisecond, mean ± SD) for room air-breathing (normoxia) and O2 ventilation (hyperoxia) for both the young and the elderly groupsa
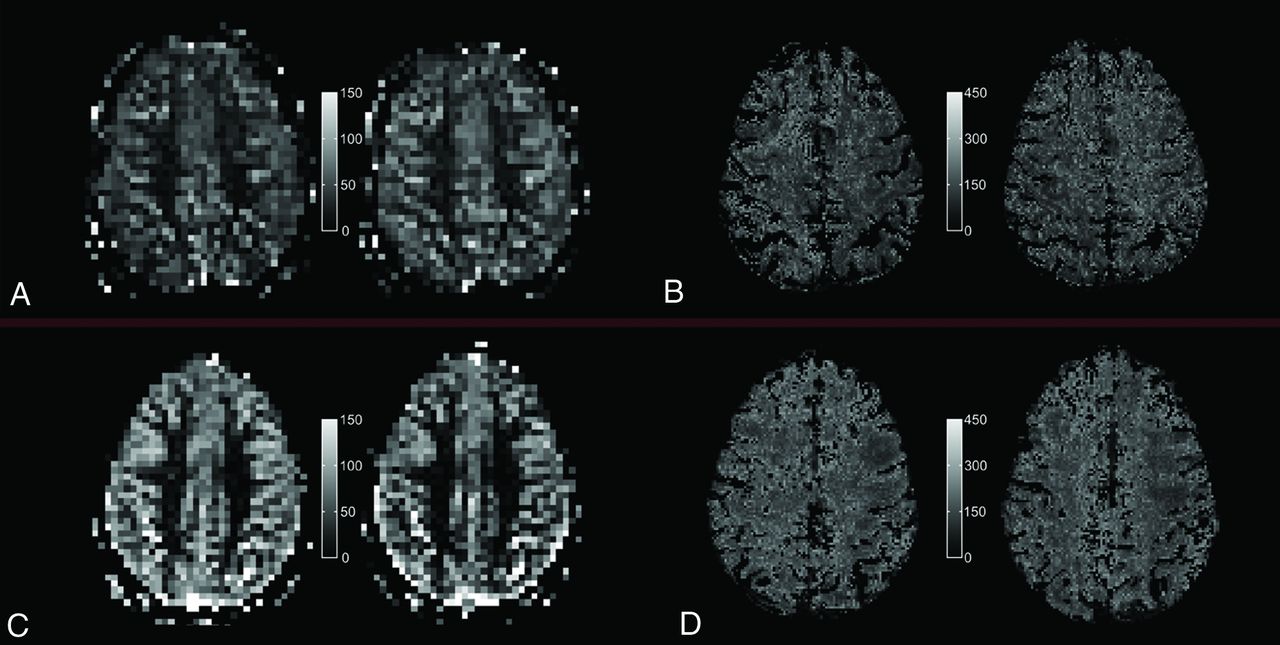
Quantitative PASL-based CBF map (A and C) and T2′ map (B and D) under room-air breathing (left) and under hyperoxic ventilation (right) for a single section and 1 representative elderly subject (top, A and B) and a representative young subject (bottom, C and D), respectively.
In the thalami, only T2 increased significantly (P = .001) with age, while T2* and T2′ remained unchanged.
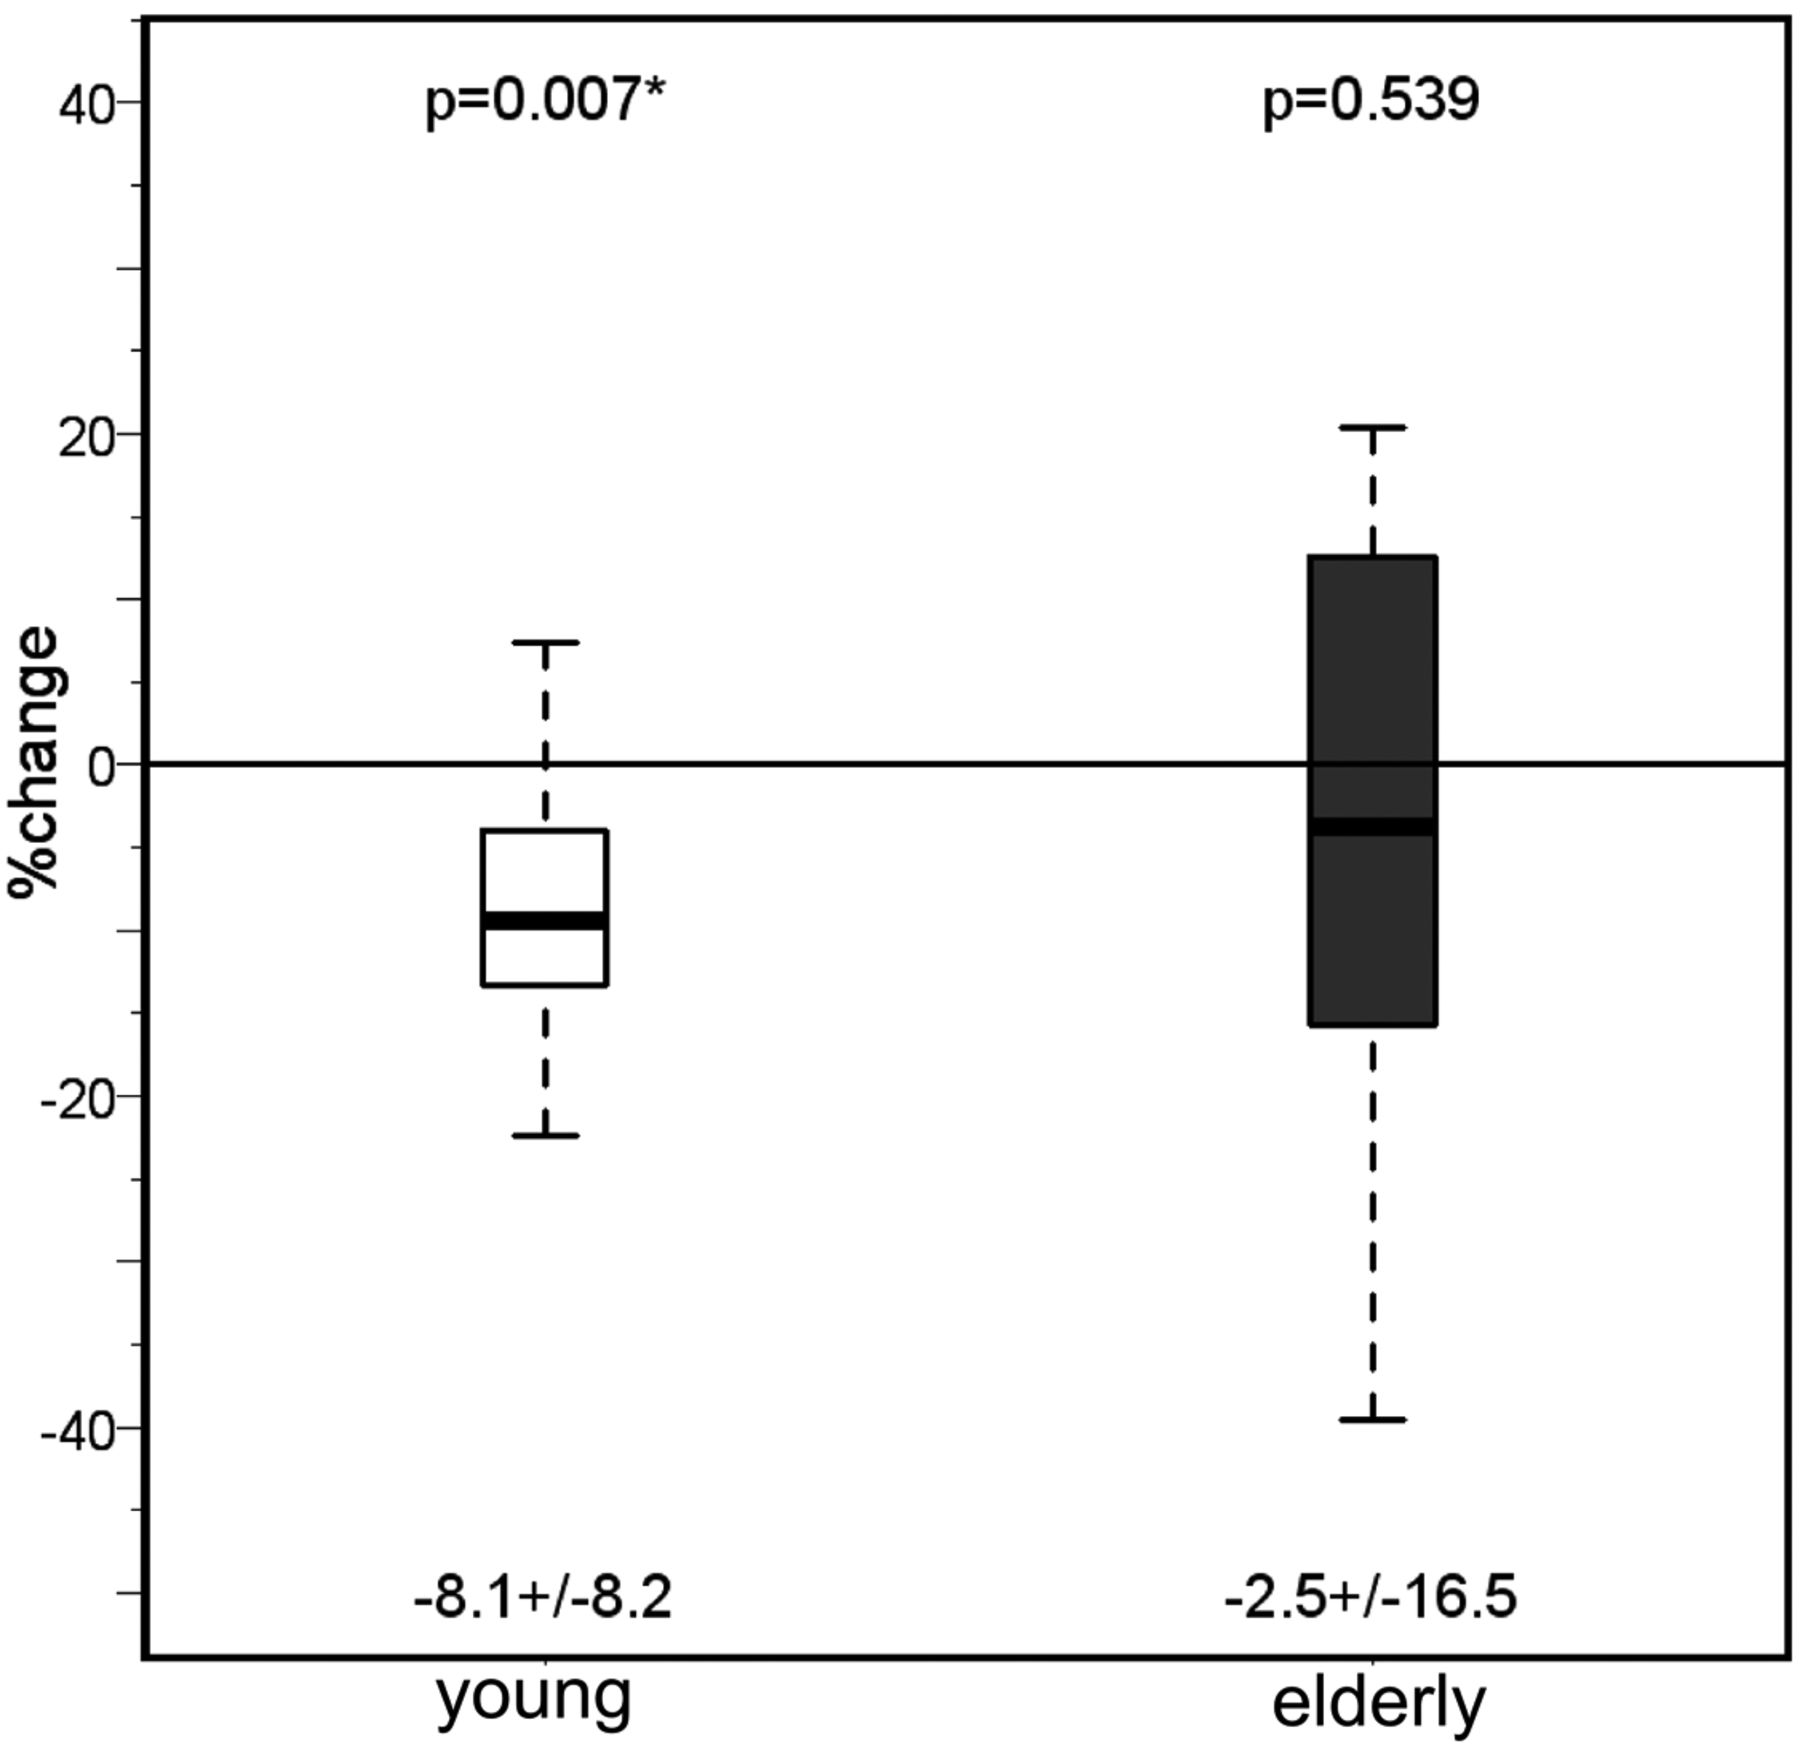
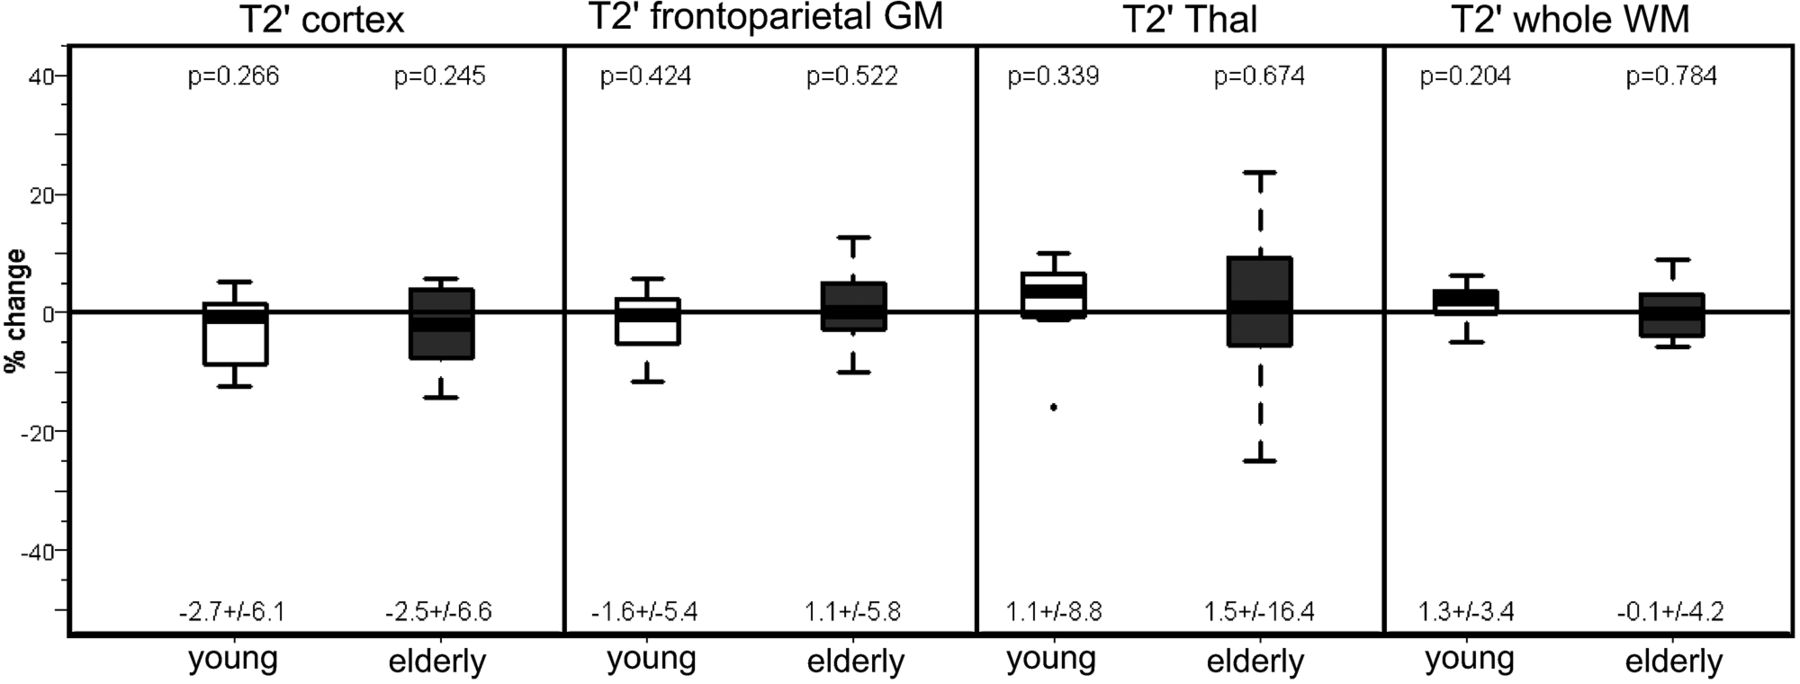
In both the younger and older subjects, T2′ (Fig 3) and T2* remained unchanged under hyperoxia compared with room-air breathing, while only in the older group did T2 increase significantly in the cortex (P = .033 and P = .005) and white matter (P = .04) under hyperoxia (Tables 1 and 2) While in the younger group the CBF had decreased significantly (P = .02) under hyperoxia, in the older group, the CBF showed only a nonsignificant decrease compared with room-air breathing (Fig 4).

Percentage change of T2′ relaxation times on O2 administration in the 2 subject groups (young and elderly) in all the investigated regions. For each group, mean ± SD are given under each boxplot, and P values of the difference from zero are provided above the boxplot.
Percentage parameter change (mean ± SD) on administration of O2 for the young and elderly groups
Values of the cerebral blood flow measured with PASL under normoxia and hyperoxia in both the young and the elderly groups. Mean ± SD are given under each boxplot, and P values of the difference between the groups are provided above the boxplots.
Discussion
We have used PASL for measuring CBF and T2′ imaging for determining the deoxyHb content of the cerebral cortex in 2 groups of healthy subjects with different ages. Compared with the mean cortical CBF values of young healthy (20–34 years) individuals, we found a CBF decrease of approximately 30% (from 61 to 43 mL/100 g/min) in the elderly (61–89 years). The CBF decrease in the elderly is most likely the result of physiologic age-related changes leading to neuronal shrinkage and/or degenerative change of the microvasculature.7⇓–9,11⇓⇓⇓–15 The CBI decrease is accompanied by a significant decrease of the cortical T2′ values (124.5 versus 142.5 ms for the younger group), which indicates increasing cortical deoxyHb content with age. The deoxyHb content depends on the CBV and the deoxyHb fraction in the blood. Increase in deoxyHb content can be attributed to reduced flow at constant oxygen consumption, leading to an increased oxygen extraction fraction. While Pantano et al14 found an increasing trend of the OEF of 7% in elderly healthy men compared with younger subjects, Leenders et al11 did not find any changes of the OEF with age by using PET. The difference in our results might be due to reduced partial volume effects of white matter and CSF for the quantitative MRI method.
Under hyperoxia, the CBF in young subjects decreased significantly (P = .02). In contrast to the young adults, the elderly group revealed only a trend toward decreased CBF on hyperoxia. However, cerebral autoregulation was still sufficient because the deoxyHb content remained constant. The relationship between a decreased CBF and an increased OEF of the aging brain11,12,14,18,58 might hint at a latent CBF/O2 undersupply. In this case, the oxygen surplus after inhalation of 100% O2 can be compensated by increased oxygen consumption. The rather luxurious perfusion of younger brains might explain the significant cortical CBF decrease under hyperoxia. Additional O2 supply, which cannot be compensated by increased consumption, leads to reactive vasoconstriction to prevent pathologic O2 concentrations in the brain.
A recent review16 showed a significant decrease of the vasoreactivity in healthy elderly volunteers. It can be speculated that the age-dependent decrease in CBF shifts the autoregulation under hyperoxia from vasoconstriction to increasing oxygen consumption.
The mean rCBF values of 43 ± 12 mL/100 g/min measured by PASL in the paramedian frontoparietal cortex of elderly healthy subjects are in line with the results of previous studies by using the same method.59 Our results are also consistent with those of several other previous studies showing an age-dependent CBF decrease between 0.5% and 0.7% per year,7⇓⇓⇓⇓⇓⇓⇓–15 with a high range of interindividual variation.11,12,14,58,59 Due to cortical atrophy in the elderly, the limited spatial resolution of PASL (3.5 × 3.5 × 6 mm3) might lead to increased partial volume effects regarding white matter and CSF and cause a higher SD of CBF values compared with those in the younger group (Fig 2).11,12,28,34,58⇓⇓⇓–62 Furthermore, spin-labeling methods presume an orthogonal caudocranial blood flow. In older patients, however, the increasing transit time of the perforating and end arterioles may occur on the basis of arteriosclerotic changes resulting in an overestimation of hypoperfusion.12,59 Furthermore, cerebrovascular sequelae of age-related increase in blood pressure or of asymptomatic ICA stenoses may decrease CBF in elderly subjects, but patients with known and symptomatic neurologic and cardiovascular diseases were excluded from the study. A potential influence of unknown vascular changes on age-related CBF decrease should not be overestimated because asymptomatic severe ICA stenosis is very rare in the healthy population63 and elderly individuals frequently undergo checkups of blood pressure.
T2′ values are influenced not only by the deoxyHb content but also by paramagnetic iron deposits in the tissue. The iron content of the cortex and of the thalamus is continuously increasing in young adolescents. Beyond the age of approximately 35 years, there is no more increase of cortical and thalamic iron deposits, but in contrast, they may even decrease. Consequently, the differences of the age-dependent T2′ values are not attributed to a difference of iron content but to the higher deoxyHb content in elderly subjects.21,29,62,64
This study stresses the requirement to calculate T2-corrected T2* values (T2′). We found an age-dependent increase of the T2 relaxation times in both gray and white matter structures, with a significant increase in the thalami and white matter. The age-dependent changes of the T2 time of the cerebral white matter are widely investigated.9,15,17,26,32,34,61,64,65⇓⇓⇓⇓–70 Beyond adolescence, there is a re-increase of the T2 time in the cerebral white matter with age due to white matter degeneration and an increased water content.9,15,17,26,34,61,66⇓⇓⇓–70 However, there are only a few data concerning age-dependent T2 changes of the gray matter. Similar to our results, Siemonsen et al31 could also quantify an age-dependent increase of T2 in the thalamus, and Autti et al71,72 qualitatively revealed at least a plateau of the T2 signal in the thalamus visually after a continuous signal decrease until middle adolescence.
The T2 increase of the paramedian frontoparietal cortex may also result from the age-dependent increase of the cortical water content as a consequence of the neuronal shrinkage.25 An increase of the water content and a decreasing attenuation of macromolecules with age were also determined from diffusion-weighted techniques and magnetization-transfer contrast imaging.28,34,73 While we could reveal a T2 effect of oxygen in the cerebral cortex and white matter of elderly subjects, this could not be shown in young subjects.
Conclusions
Quantitative MR imaging with high-resolution T2′ mapping and PASL-based CBF mapping demonstrated an age-dependent increase of deoxyHb in the cerebral cortex, while the cortical CBF decreased with age. In both young and elderly healthy subjects, the content of deoxyHb remained constant under hyperoxic inhalation compared with normoxia, but only the younger group showed a significant CBF decrease under hyperoxia. These results suggest an age-appropriate cerebral autoregulation in young and elderly brains, whereas at a younger age, hyperoxic-induced vasoconstriction protects the brain against hyperoxemia.
Acknowledgements
We thank Dr Ulrich Pilatus for editing the manuscript.
Footnotes
-
Disclosures: Disclosures: Steffen Volz—RELATED: Grant: support to Brain Imaging Center, Frankfurt: Bundesministerium für Bildung und Forschung (Germany): DLR 01GO0203; Deutsche Forschungsgemeinschaft (Germany): ZA 233/1–1;* UNRELATED: Grants/Grants Pending: public funding: Land of Hesse, Germany: LOEWE Research grant “Neuronale Koordination Forschungsschwerpunkt Frankfurt,” since 2011.* Ralf Deichmann—RELATED: Grant: support to Brain Imaging Center, Frankfurt: Bundesministerium für Bildung und Forschung (Germany): DLR 01GO0203; Deutsche Forschungsgemeinschaft (Germany): ZA 233/1–1,* UNRELATED: Grants/Grants Pending: public funding: Land of Hesse, Germany: LOEWE Research grant “Neuronale Koordination Forschungsschwerpunkt Frankfurt,” since 2011;* Royalties: published book chapters: 1) Deichmann R: “Principles of MRI and Functional MRI. ” In: Filippi M, ed. fMRI Techniques and Protocols. Heidelberg: Humana Press, Springer, 2009; 2) Deichmann R, Noeth U, Weiskopf N. “The Basics of Functional Magnetic Resonance Imaging.” In: Mulert C, Lemieux L, eds. EEG-fMRI. Heidelberg: Springer, 2010; (so far no royalties paid); Travel/Accommodations/Meeting Expenses Unrelated to Activities Listed: travel expenses for invited lectures given at the following nonprofit organizations: 2010: Max-Delbrück-Center, Berlin/Buch, Germany; 2010: Wellcome Trust Centre for Neuroimaging, Institute of Neurology, UCL, London, UK; 2010: University of Tübingen, Germany; 2011: Research Center Jülich, Germany; 2011: University of Liege, Belgium. *Money paid to the institution.
Indicates open access to non-subscribers at www.ajnr.org
References
- 1.↵
- 2.↵
- 3.↵
- 4.↵
- 5.↵
- 6.↵
- 7.↵
- 8.↵
- 9.↵
- 10.↵
- 11.↵
- 12.↵
- 13.↵
- 14.↵
- 15.↵
- 16.↵
- 17.↵
- 18.↵
- 19.↵
- 20.↵
- 21.↵
- 22.↵
- 23.↵
- 24.↵
- 25.↵
- 26.↵
- 27.↵
- 28.↵
- 29.↵
- 30.↵
- 31.↵
- 32.↵
- 33.↵
- 34.↵
- 35.↵
- 36.↵
- 37.↵
- 38.↵
- 39.↵
- 40.↵
- 41.↵
- 42.↵
- 43.↵
- 44.↵
- 45.↵
- 46.↵
- 47.↵
- 48.↵
- 49.↵
- 50.↵
- 51.↵
- 52.↵
- 53.↵
- 54.↵
- 55.↵
- 56.↵
- 57.↵
- 58.↵
- 59.↵
- 60.↵
- 61.↵
- 62.↵
- 63.↵
- 64.↵
- 65.↵
- 66.↵
- 67.↵
- 68.↵
- 69.↵
- 70.↵
- 71.↵
- 72.↵
- 73.↵
- Received December 23, 2011.
- Accepted after revision February 29, 2012.
- © 2012 by American Journal of Neuroradiology
In this issue


Jump to section
Related Articles
Cited By...
- Arterial Spin-Labeling Parameters and Their Associations with Risk Factors, Cerebral Small-Vessel Disease, and Etiologic Subtypes of Cognitive Impairment and Dementia
- Detection of Normal Aging Effects on Human Brain Metabolite Concentrations and Microstructure with Whole-Brain MR Spectroscopic Imaging and Quantitative MR Imaging