
Abstract
BACKGROUND AND PURPOSE: Previous studies have shown the feasibility of assessing qualitative CBV measurements in the angiography suite by using FPD-CBCT systems. We have investigated the correlation of FPD-CBCT CBV lesion volumes to the infarct volume.
MATERIALS AND METHODS: Unilateral strokes were created in 7 adult dogs. MR imaging and FPD-CBCT data were obtained after MCA occlusion. FPD-CBCT CBV and ADC maps were generated for all subjects. The animals were sacrificed immediately following the last imaging study to measure infarct volume on histology. The reliability of FPD-CBCT-based lesion volume measurements was compared with those measured histologically by using regression and Bland-Altman analysis.
RESULTS: The best correlation (R2 = 0.72) between lesion volumes assessed with FPD-CBCT and histology was established with a threshold of mean healthy CBV − 2.5 × SD. These results were inferior to the correlation of lesion volumes measured with ADC and histology (R2 = 0.99). Bland-Altman analysis showed that the agreement of ADC-derived lesion volumes with histology was superior to the agreement of FPD-CBCT-derived lesion volumes with histology.
CONCLUSIONS: We correlated FPD-CBCT measurements of CBV and MR ADC lesion volumes with histologically assessed infarct volume. As expected, ADC is a very accurate and precise method for determining the extent of infarction. FPD-CBCT CBV lesion volumes are correlated to the size of the infarct. Improvement of FPD-CBCT image quality provides an opportunity to establish quantitative CBV measurement in the angiography suite.
ABBREVIATIONS:
- CTP
- CT perfusion
- FPD-CBCT
- flat panel detector conebeam CT
- HU
- Hounsfield units
- NSA
- number of signal-intensity averages
- R2
- coefficient of determination
- RMSE
- root-mean-square error
- σ
- SD, standard deviation
- tlesion
- lesion threshold
- TOF
- time-of-flight
- TTC
- 2,3,5-triphenyltetrazolium chloride
- Vlesion
- lesion volume
Stroke is the third leading cause of death and the leading cause of long-term disability in the United States.1 Timely detection of stroke with rapid treatment can limit the amount of viable tissue destined for infarction.2 For distinguishing salvageable and nonsalvageable tissue, imaging protocols have been developed that measure hemodynamic changes in the brain.3,4 Common perfusion parameters used to quantify hemodynamic changes are MTT, CBF, and CBV, which can either be assessed with CTP or perfusion MR imaging. CT and MR imaging modalities have shown adequate sensitivity and specificity for identifying the ischemic core and penumbra.5 CTP has gained considerable applicability in acute ischemic stroke because of its relatively short imaging time and availability.
Often, endovascular therapy, such as intra-arterial tissue plasminogen activator or mechanical thrombectomy, is commenced well after perfusion-diffusion mismatch on MR imaging or MTT-CBV mismatch on CTP is assessed.6–8 The time from presentation and penumbral imaging to groin puncture for intra-arterial intervention can exceed 2 hours,6 during which changes in the amount of viable brain tissue are expected. Because brain perfusion parameters play a crucial role in patient selection for intra-arterial therapy, it is important that patient data are up-to-date at therapy onset. The ability to re-assess brain infarct evolution immediately before beginning intra-arterial therapy could potentially alter the treatment course. Therefore, the accessibility of physiologic imaging metrics in the angiography suite will be of great value.
Today, angiography suites are often equipped with x-ray C-arm systems that not only provide 2D x-ray guidance during interventions but also serve as an in situ 3D imaging technique conventionally used for 3D angiography. The improved image quality due to the introduction of FPD-CBCT provides sufficient soft-tissue contrast, enabling differentiation between gray and white matter9 and detection of ventricles and intracerebral hemorrhages.10
Recently, researchers have made tremendous advances in investigating the feasibility of assessing CBV with FPD-CBCT in healthy dogs,11 in canine models of ischemic stroke,12 and in patients with acute symptoms of cerebral ischemia.13 These studies showed that CBV maps assessed with FPD-CBCT correlated well with conventional CT protocols. Most important, observers were able to successfully detect reduced CBV in >80% of the cases in FPD-CBCT CBV in a qualitative fashion.
To enable discrimination between healthy tissue and ischemic core quantitatively, a threshold for infarction should be established. Previously reported studies in humans showed that ischemic core could be identified by absolute CBV or using a relative CBV threshold.14
We have investigated the feasibility of determining a CBV lesion threshold and calculating lesion volumes on the basis of CBV assessed with a FPD-CBCT system in a canine model of acute ischemic stroke. A CBV lesion threshold was identified by optimization of a linear regression model with respect to criterion standard lesion volume measurements obtained with histology. Volume measurements that showed the best agreement with histology were evaluated by using a Bland-Altman analysis. In addition, lesion volumes were determined from ADC maps derived from DWI.
Materials and Methods
Stroke Preparation
Experiments were approved by the Institutional Animal Care and Use Committee of the University of Massachusetts. Stroke was induced in 7 purpose-bred canines (beagles, mean weight of 10.0 kg) by injection of an autologous blood clot into the left or right, randomly selected, ICA under fluoroscopic guidance by using a 5F catheter, as previously described.15 Thrombin-induced autologous clot (4 National Institutes of Health unit/mL blood) was prepared in silicone tubing 1 day before the experiment. Mean diameter and length of clot for injection were 2.33 and 10.0 mm, respectively. To facilitate visualization of the clot under x-ray, we added barium sulfate into the blood/thrombin mixture at a concentration of 1.0 g per 10.0 mL of blood. During the procedure, animals were anesthetized by intramuscular injection of acepromazine (0.06 mg/kg), glycopyrrolate (0.01 mg/kg), and thiopental (15.0 mg/kg). Anesthesia was maintained during the entire procedure by mechanical ventilation of 2%–3% isoflurane in a 1:1 oxygen and air mixture. Physiologic monitoring, including heart rate, blood pressure, arterial oxygen saturation, temperature, end-tidal CO2, blood glucose, and blood gases, was performed and recorded every 15 minutes during the procedure.
After injection, clot location was confirmed with conventional angiography and the animal was transferred to the MR imaging scanner for sequential perfusion imaging and DWI. At 4 hours following stroke onset, the animals were returned to the angiography suite for FPD-CBCT imaging. Animals were euthanized after completion of all data acquisitions with an overdose of sodium pentobarbital. Histology was performed on coronal brain sections by TTC staining.16,17 Infarct volumes were determined by a section-by-section manual segmentation of the infarct areas and multiplication with section thickness. Infarction was also confirmed qualitatively by analyzing sections stained with Fluoro-Jade C.
Image Acquisition
MR imaging data were obtained before stroke induction and 240 minutes after clot injection. FPD-CBCT data were acquired within 10 minutes of the last DWI.
MR imaging was performed on a 3T whole-body MR imaging scanner (Achieva; Philips Healthcare, Best, the Netherlands) by using an 8-channel knee coil. We used multisection Dual-SE sequence (TR/TE1/TE2 = 2630/15/80 ms, flip angle α = 90°, NSA = 2, FOV = 110.0 × 140.0 mm2, acquired pixel size = 0.4 × 0.4 mm2, 54 sections with thickness = 2.0 mm, no section gap), a spin-echo EPI DWI sequence (TR/TE = 2580.7/76 ms, flip angle α = 90°, NSA = 6, turbo = 29, FOV = 130.0 × 130.0 mm2, acquired pixel size = 0.9 × 0.9 mm2, 75 sections with thickness = 3.0 mm, no section gap), a 3D TOF sequence (TR/TE = 19.9/3.6 ms, flip angle α = 20°, NSA = 1, FOV = 130.0 × 130.0 mm2, acquired pixel size = 0.2 × 0.2 mm2, 100 sections with thickness = 1.0 mm, section gap = −0.5 mm), and a fast-field echo EPI perfusion sequence (TR/TE = 1500.0/20.1 ms, flip angle α = 40°, NSA = 1, FOV = 110.0 × 110.0 mm2, acquired pixel size = 0.3 × 0.3 mm2, 12 sections with thickness = 3.0 mm, section gap = 1.0 mm).
FPD-CBCT data were obtained on an x-ray angiography C-arm system (Allura Xper FD20; Philips Healthcare) with a cerebral soft-tissue protocol. Before all acquisitions, a system-specific air calibration of the C-arm system was performed. FPD-CBCT data (FOV = 251.5 × 194.5 × 251.5 mm3, voxel size = 0.98 mm3) were reconstructed from 600 x-ray images generated during a 20-second rotational motion of the x-ray source over approximately 200°. The first dataset was obtained without contrast. The second dataset was acquired with administration of contrast (iopamidol 51%, Iopamiron; Bracco, Milan, Italy) intravenously with a power injector (Mark V ProVis; Medrad, Indianola, Pennsylvania) at an infusion rate of 2.0 mL/s for a total of 80.0 mL. Acquisitions were started after a delay of 25 seconds in order for the contrast agent to reach a steady state in the parenchyma.12
Image Processing and Data Analysis
ADC maps were generated with software available on the MR imaging console and analyzed by using Matlab (MathWorks; Natick, Massachusetts). Voxels with ADC values below 0.53 × 10⁻³ mm2/s were identified as lesion voxels and were automatically segmented.18 Subsequently, total lesion volumes were calculated.
In 3 cases, registration of the baseline run FPD-CBCT data to the contrast run was necessary because of subject motion between scans. In the remaining cases, baseline data were aligned with contrast-enhanced data without additional registration. 3D rigid registration was performed with elastix (http://elastix.isi.uu.nl)19 by using a stochastic gradient descent optimization routine and a mutual information similarity measure. Results of the registrations were all successful on visual inspection.
For all datasets, brain volumes were semiautomatically segmented from the T2-weighted Dual-SE data by an experienced observer (M.M.) using a region-growing algorithm. Subsequently, the ventricles, sinuses, and large veins were segmented by using the same technique from the proton-density-weighted Dual-SE data. Brain masks without these structures were generated by subtracting them from brain segmentations, and these masks were registered to the FPD-CBCT data. CBV expressed in milliliters per 100 g, defined as4

was calculated for all voxels within the brain mask with in-house–developed software by using the Insight Segmentation and Registration Toolkit (http://www.itk.org/).20 ΔHUbrain and ΔHUblood represent the difference in Hounsfield units at baseline and at steady-state contrast injection of brain tissue and blood, respectively. ΔHUbrain was calculated by voxelwise subtraction of the baseline from the contrast run. ΔHUblood was determined in manually selected bilateral regions of interest located in the extracranial ICAs.11 Vvoxel represents the volume per voxel in milliliters, and N, the number of voxels in 100 g of brain tissue. To determine N, a tissue density of 1.05 g/mL was assumed.4 ΔHUbrain values were corrected for differences in large- and small-vessel hematocrit levels by

where H is the hematocrit value of the blood and r = 0.8 the ratio of small-to-large vessel hematocrit values. CBV maps (ie, voxelwise representations of the CBV values) were created. To reduce noise, a Perona-Malik anisotropic diffusion filter (conductance = 1, time step = 0.625, and 5 iterations) was applied to baseline and contrast reconstructed data before subtraction.21 For all subjects, mean CBV values (C̅B̅V̅) and σ were determined in a VOI of 5 × 5 × 5 voxels (0.12 mL) in healthy (C̅B̅V̅h) and ischemic tissue (C̅B̅V̅i), by using ADC, perfusion, and histology data to localize and position VOIs.
Healthy and ischemic regions were localized by using histology data. Lesion volumes (Vlesion) in milliliters were determined by applying various lesion thresholds (tlesion) to the masked CBV data. Lesion thresholds were based on healthy CBV values measured in the normal hemisphere of the brain. Because the CBV values are subject to image noise and values may differ for different brain tissue types, CBV values measured in a VOI will result in a distribution of values. We, therefore, propose using mean CBV in a healthy VOI offset by a multiple of the σ in that VOI.

In this equation, k represents the multiplication factor.
CBV lesion volumes were calculated by using 5 k-values (k = 1.0, 1.5, 2.0, 2.5, and 3.0), and resulting volumes were compared with lesion volumes measured with histology and ADC by a linear regression analysis. ADC, FPD-CBCT CBV, and histology processing and analysis were performed independently and blinded to results of concurrent analyses and location of stroke. All experiments were conducted according to the Stroke Therapy Academic Industry Roundtable criteria.22
Results
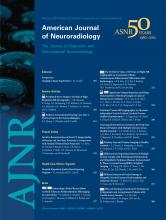
After injection, DSA was used to confirm that emboli were located in the distal ICA with extension into the MCA. Figure 1 shows representative DSA prior to (Fig 1A) and after (Fig 1B, -C) autologous clot injection, resulting in occlusion of the distal left ICA and proximal left MCA. All 7 animals had unilateral strokes. Persistent occlusion was confirmed by 3D TOF imaging (Fig 1D). The ischemic and infarcted regions were evaluated by perfusion/diffusion MR imaging (Figs 2A, -B) and by TTC- and Fluoro-Jade C staining (Fig 3). Lesion volumes derived from ADC maps varied from 0.12 to 12.53 mL. Ischemic regions for all subjects were visualized and identified by FPD-CBCT CBV. Figure 2C gives representative FPD-CBCT-assessed CBV data overlaid on the non-contrast-enhanced CBCT data. Here, CBV values are visualized by a color scale, in which red and blue indicate high and low CBV, respectively. Mean healthy and ischemic CBV values for all subjects measured in the VOIs were 4.23 mL/100 g (range, 3.60–6.28 mL/100 g) and 1.13 mL/100 g (range, 0.63–3.40 mL/100 g), respectively. Locations of the manually selected bilateral VOIs in CBV are indicated by the square boxes in Fig 2C. Mean CBV values and SDs of healthy and ischemic VOIs are given per subject in Table 1.

Representative of DSA and TOF imaging canine stroke modeling: angiographic data of a single subject obtained during embolic stroke induction. A, DSA of the left ICA before introducing the autologous clot (ventral projection). B, The injected blood clot is seen on radiography due to the presence of barium sulfate (arrow). C and D, DSA (C, ventral projection) and 3D time-of-flight image (D, ventral projection) of the right ICA confirm occlusion of the distal left ICA and proximal MCA (arrows).

Representative ADC, MTT, and CBV for canine stroke: example of image data for a single subject. DWI (A), MR perfusion (MTT map) (B), and FPD-CBCT–assessed CBV (C) all show abnormality of the left hemisphere due to the ischemic insult. Squares on the CBV maps (C) indicate the VOIs that were used to calculate CBV values used in equation 3.

Representative histologic results: An example of histology by TTC (A) and Fluoro-Jade C staining (B) of the same subject and approximate section as shown in Fig 1. Ischemic regions observed with MR and CBCT imaging are confirmed by absence of TTC staining and by fluorescent green−stained degenerated neurons (magnification, ×20).
Mean CBV (C̅B̅V̅) values and SD of healthy (C̅B̅V̅h) and ischemic (C̅B̅V̅i) tissue for each subjecta
The results of the regression analysis of lesion volumes measured with various lesion thresholds are summarized in Fig 4. CBV lesion volumes determined by using various thresholds (ie, k-values) are plotted as a function of infarct volumes determined by histology (Fig 4). R2 and RMSE are indicated in Table 2 for the corresponding k-values. The largest coefficient of determination (R2 = 0.72) was observed with k = 2.5. Regression analysis of ADC lesion volumes versus histology-measured lesion volumes is depicted in Fig 4F. For these lesion volumes, linear regression was obtained with R2 = 0.99.

Linear regression analysis. Lesion volumes in FPD-CBCT−assessed CBV data were measured by using various lesion thresholds with tlesion=C̅B̅V̅h−kσ. A−E, An optimal threshold was established by linear regression analysis of the CBV lesion volumes by using various k-values in relation to lesion volumes obtained with histology. F, The results were compared with the regression analysis of lesion volumes assessed with ADC versus lesion volumes measured with histology. The qualities of the linear fits are summarized in Table 2.
Summary of the linear regression analysis for various k-values that were used to establish a CBV lesion threshold (tlesion): tlesion=C̅B̅V̅h−kσ1a
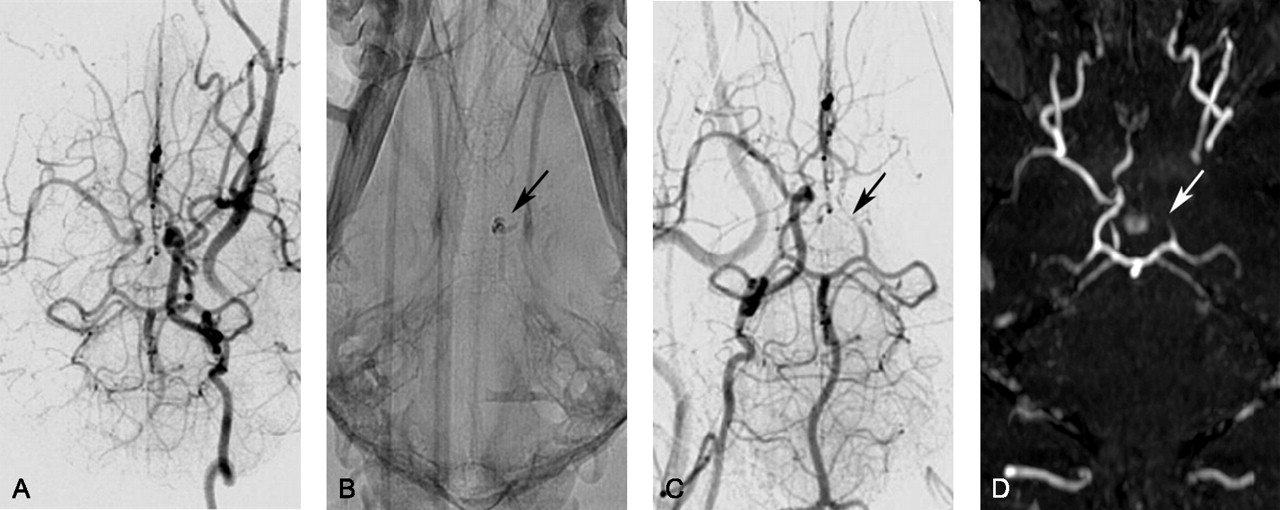
The agreement of lesion measurements with criterion standard histology data was determined by a Bland-Altman analysis, shown in Fig 5. The results for lesion measurement performed in CBV (with k = 2.5) and ADC data are shown in the left and right graphs, respectively. Mean difference (SD) for CBV-histology and ADC-histology agreement were 2.18 (2.94) and 0.02 (0.64) mL, respectively.

Results of Bland-Altman analysis performed to evaluate the agreement of lesion volumes assessed with FPD-CBCT CBV (A) and ADC (B) with histologically measured infarct volumes. Mean differences and 1.96 × SD are indicated by the solid and dashed lines, respectively.
Discussion
Recently performed research has made great advances in the assessment of qualitative CBV measurements in the angiography suite.
In this study, we have investigated the feasibility of using an FPD-CBCT system for the quantitative assessment of CBV with the objective of measuring lesion volume after stroke. Calculation of CBV values with FPD-CBCT required high-resolution pre- and postcontrast FPD-CBCT scans. Each of these acquisitions produces a patient radiation dose of approximately 50 mGy, which corresponds to that in a conventional head CT. To establish complete steady-state saturation with contrast through all brain parenchyma, we used a relatively high contrast load. Optimization of the infusion rate and total contrast volume is required before this technique can be implemented in clinical routine.13 CBV was assessed in a canine model of ischemic stroke. Mean CBV values were measured in bilateral VOIs in ischemic and healthy tissue. Overall mean normal CBV was 4.23 ± 1.01 mL/100 g, which is higher than the values reported by Ahmed et al,11 who found a mean CBV of 2.30 mL/100 g.
For all subjects, CBV measured in the ischemic regions was significantly lower than CBV in healthy regions. Lesion volumes were determined by 5 thresholds, which were chosen to be k × the SDs below the mean normal CBV, where k varied between 1.0 and 3.0. Subsequently, lesion volumes calculated with CBV and ADC were compared with volumes measured with histology. The experiments showed that the best agreement (R2 = 0.72) was obtained when a lesion threshold of 2.5σ was used. In a previously reported study, a lesion threshold of 55% of the normal CBV value was proposed for humans.5 In our experiments, this would correspond to a k-value of 1.8. The results imply that on the basis of FPD-CBCT CBV, lesion volumes can be predicted with moderate reliability. The correlation was inferior to that obtained with ADC lesion volume measurements (R2 = 0.99). The Bland-Altman analysis showed that the CBV lesion volume measurements contain a positive bias of 2.18 mL, which implies that on average, lesion volumes by CBV are underestimated and the SD (2.94 mL) of CBV lesion measurements is relatively large. Lesion volumes obtained with ADC showed excellent agreement with histology, a mean difference and SD of 0.02 mL and 0.64 mL, respectively.
The differences in healthy CBV values compared with those reported by Peterson et al,23 who found CBV of 2.9 ± 1.4 and 2.5 ± 1.5 mL/100 g in gray and white matter by using CTP, respectively,23 may be a result of nonlinearities of the FPD-CBCT system. In a study previously presented, we have characterized the noise of a FPD-CBCT system by using a water phantom.24 The root-mean-square deviation from the theoretic value of water was 9.4 HU with a mean SD of 19.1 HU. These results show that in order for FPD-CBCT CBV to be used quantitatively, CBCT image quality should be improved by reducing detector noise and photon scatter.
The results show that though an ischemic lesion can be identified qualitatively with FPD-CBCT CBV, quantitative lesion volume measurements in FPD-CBCT CBV are currently inferior to measurements performed with ADC, which showed better agreement with histology. The reliability of FPD-CBCT CBV is mainly limited by imaging physics.
Conclusions
We can conclude that FPD-CBCT CBV has great potential for in situ assessment of cerebral hemodynamic changes, which may benefit patient triage. Although healthy and infarcted tissue were qualitatively distinguishable by intrasubject analysis of FPD-CBCT, imaging quality should be further improved to generate quantitative CBV maps. Reliability of FPD-CBCT CBV could be improved by reducing image noise and photon scatter.
Footnotes
-
This work was supported by the National Institute of Biomedical Imaging and Bioengineering grant 1R21EB007767.
-
Paper previously presented at: International Stroke Conference, February 9–11, 2011; Los Angeles, California; and Annual Meeting of the Society of Neurointerventional Surgery, July 26–29, 2010; Carlsbad, California.
-
The contents are solely the responsibility of the authors and do not necessarily represent the official views of the National Institutes of Health.
-
Disclosures: Matthew Gounis—UNRELATED: Consultancy: Codman Neurovascular, Micrus Endovascular, Soteira, Grants/Grants Pending: Boston Scientific, Concentric, Codman Neurovascular, Guerbet, ev3, Micrus Endovascular, Neurointerventional Therapeutics, Neuravi, Stryker Neurovascular, Senofi-aventis, and Thrombolytic Scientific.
Indicates open access to non-subscribers at www.ajnr.org
References
- Received April 25, 2011.
- Accepted after revision June 15, 2011.
- © 2012 by American Journal of Neuroradiology
In this issue


Jump to section
Related Articles
Cited By...
- Active drug-coated flow diverter in a preclinical model of intracranial stenting
- A canine model of mechanical thrombectomy in stroke
- C-Arm CT Measurement of Cerebral Blood Volume and Cerebral Blood Flow Using a Novel High-Speed Acquisition and a Single Intravenous Contrast Injection
- Preclinical Investigations for Thrombectomy Devices--Does it Translate to Humans?
- Preclinical acute ischemic stroke modeling