
Abstract
SUMMARY: Neurotransmitters are chemical substances that, by definition, allow communication between neurons and permit most neuronal-glial interactions in the CNS. Approximately 80% of all neurons use glutamate, and almost all interneurons use GABA. A third neurotransmitter, NAAG, modulates glutamatergic neurotransmission. Concentration changes in these molecules due to defective synthetic machinery, receptor expression, or errors in their degradation and metabolism are accepted causes of several neurologic disorders. Knowledge of changes in neurotransmitter concentrations in the brain can add useful information in making a diagnosis, helping to pick the right drug of treatment, and monitoring patient response to drugs in a more objective manner. Recent advances in 1H-MR spectroscopy hold promise in providing a more reliable in vivo detection of these neurotransmitters. In this article, we summarize the essential biology of 3 major neurotransmitters: glutamate, GABA, and NAAG. Finally we illustrate possible applications of 1H-MR spectroscopy in neuroscience research.
ABBREVIATIONS:
- AD
- Alzheimer disease
- ALS
- amyotrophic lateral sclerosis
- AMPAR
- α-amino-3-hydroxyl-5-methyl-4-isoxazole-propionate receptors
- ATP
- adenosine triphosphate
- CNS
- central nervous system
- Cr
- creatine
- EAAT
- excitatory amino acid transporter
- EEG
- electroencephalography
- 18FDG-PET
- [18F]fluorodeoxyglucose–positron-emission tomography
- GABA
- γ-aminobutyric acid
- GLAST
- glutamate/aspartate transporter
- 1H-MR
- proton MR
- NAA
- N-acetylaspartate
- NAAG
- N-acetyl aspartylglutamate
- NMDAR
- N-methyl D-aspartate
- PAG
- phosphate-activated glutaminase
- PD
- Parkinson disease
MRS is a rapidly developing noninvasive technique that allows the clinician to assess the intact brain for neurochemical changes in a given brain region of interest. In the past 25 years, MRS has been an important clinically productive diagnostic tool. The detection of these molecules has been valuable in understanding the presence of neuronal elements (NAA), cell proliferation and degradation (choline), glial disease (myo-inositol), and energy states (Cr); but most changes in metabolite concentrations tend to be rather nonspecific.
The 2 most abundant neurotransmitters in the human brain are glutamate and GABA. More recently, there is emerging scientific interest in understanding the role of NAAG in neurologic diseases. A variety of pathologic alterations may arise from changes in the concentration of these neurotransmitters. These may occur due to alterations at several levels, including their synthesis, metabolism, and interaction with receptors. At present, neurologists have access to a vast repertoire of drugs that modulate neurotransmitter activity in the brain for the treatment of diseases such as epilepsy, motor neuron diseases, and several chronic neurodegenerative disorders. However, complete remission of signs and symptoms is not consistently achieved.
Glutamate, GABA, and NAAG are “visible” in 1H-MR spectroscopy. However, routine 1H-MR spectroscopy sequences do not allow the unequivocal detection of these neurotransmitters for several reasons: low spectral resolution, relatively low concentrations, and spectral contamination from other more dominant metabolites. To overcome these hurdles, specific “editing” methods at high magnetic fields (>1.5T) are being developed and applied in clinical research, which provide a more reliable way for quantifying neurotransmitter levels in pathologic conditions. Because most acute and chronic neurologic disorders are associated with an imbalance of excitatory and inhibitory neurotransmission, it is exciting to consider a future role of 1H-MR spectroscopy in providing a possible “biomarker” of disease and response to treatment.
The aim of this review is the following: 1) to highlight the essential biology of 3 major neurotransmitters: glutamate, GABA, and NAAG; and 2) to illustrate possible applications of editing 1H-MR spectroscopy techniques in neurologic diseases, which can aid clinical practice, clinical trials, and neuroscience research.
Neurotransmitters
Glutamate
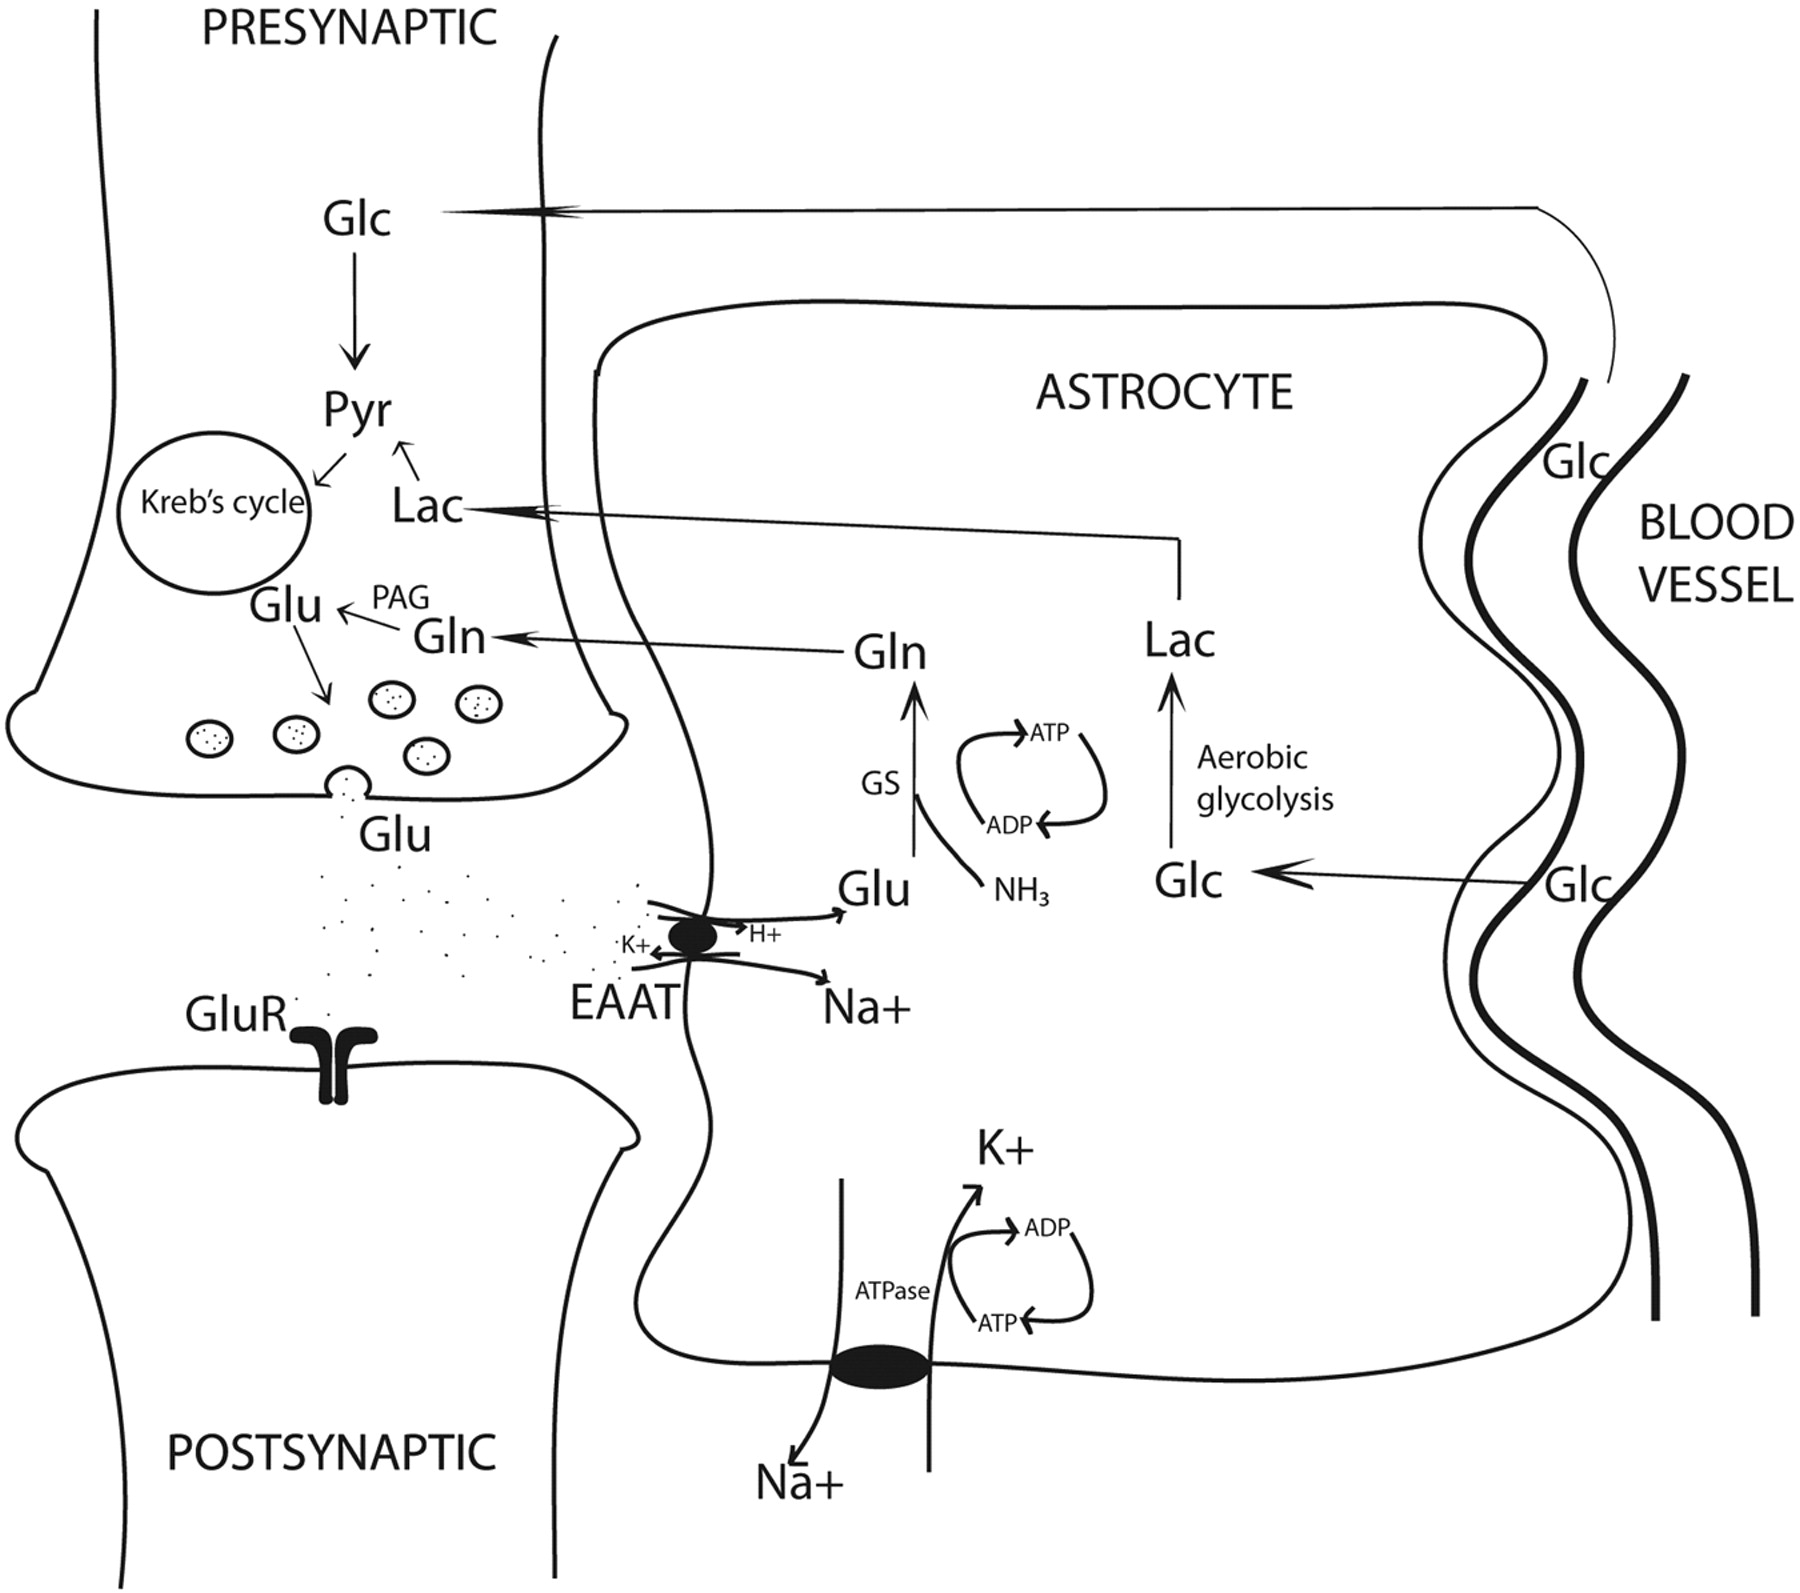
Almost 85% of all synapses in the brain are glutamatergic, making glutamate a central molecule in the brain.1 Besides its role in neurotransmission, glutamate is a key molecule in synapse formation, dendrite pruning, cell migration, differentiation, and death. In addition, glutamate acts as a precursor for GABA in neurons and glutamine in astrocytes (Fig 1). Because the blood-brain barrier prevents entry of peripheral glutamate in the CNS, it is largely synthesized de novo in the neurons and astrocytes through 2 separate Krebs cycles, resulting in 2 glutamate pools (Fig 1). The larger neuronal pool of glutamate is characterized by a slow metabolic turnover, while the smaller astrocytic pool is characterized by a faster metabolic turnover. Glutamate released into the synaptic cleft is avidly taken up by the specific sodium-dependent receptor, EAAT, on astrocyte processes.

Glutamatergic synapse: Glutamate determines neurotransmission by acting on postsynaptic receptors. EAATs, localized on the astrocytic membrane, rapidly terminate glutamatergic activity. EAAT activity is tightly coupled to glucose consumption, causing transient increase in lactate levels. Increased lactate may be an important immediate source of energy to firing neurons. Note the tight neuronal-astrocytic interaction, which is fundamental for the glutamate/glutamine coupling and the compartmentalization of glutamate. Glutamine synthesis in astrocytes is an important mechanism of ammonia detoxification. Note:—Pyr indicates pyruvate; Lac = lactate; GS = glutamine synthetase.
Astrocytic glutamate undergoes 2 metabolic steps. First, it is rapidly converted to glutamine by a glial-specific ATP-dependent enzyme, glutamine synthetase.2 This glutamine is released into the extracellular space and is taken up by neurons where neuron-specific PAG converts it back to glutamate. This forms the basis of the glutamate/glutamine cycling. Thus, opposite fluxes connect neurons and astrocytes, one transferring glutamate toward the smaller astrocytic pool and the other transferring glutamine toward the large neuronal pool, determining the directionality of glutamate transmission and rapid removal of excessive glutamate. Some of the major determinants of energy consumption by glutamatergic neurons in the cerebral cortex are linked to the glutamate/glutamine cycling.3 Any pathologic condition with energy synthesis failure such as a mitochondrial dysfunction is also likely to affect glutamatergic neurotransmission.
Second, glutamate uptake triggers glycolysis in astrocytes (aerobic glycolysis) and stimulates synthesis of lactate.4 The cerebral metabolic rate of glucose oxidation and glutamate neurotransmitter cycling measured by using labeled carbon 13-MRS follows a stoichiometry of 1:1, suggesting a tight relationship between glutamatergic neurotransmission and energy metabolism.5 In fact, glutamatergic activity is energetically expensive, resulting in approximately 70%–80% of total glucose consumption.6 Higher rates of neuronal firing and rising concentrations of extracellular glutamate will cause more astrocytic glutamate to convert to lactate. In the astrocyte-neuron-lactate shuttle hypothesis, the astrocyte-generated lactate is shuttled into the neurons, providing a fast and preferential oxidative substrate during neuronal activity.7
Glutamate-mediated neurotransmission occurs largely through 2 major receptor subtypes: ionotropic NMDAR and AMPAR and metabotropic glutamate receptors. The NMDAR is the most intensely studied glutamate receptor. Important properties of clinical interest include the following: large single-channel conductance, high calcium permeability, voltage-dependent block by magnesium, and an obligatory glycine coactivation. NMDAR has several subunits determined by different gene families (NR1, NR2A, NR2B, NR2C, NR2D, NR3A, and NR3B). The NR1 with 1 of 4 possible NR2 subtypes and, in some cases, NR3 subtypes constitute the final functional NMDAR. Glutamate binds with high affinity to the NR2 subunit. Of great interest are second-messenger-linked metabotropic glutamate receptors. There are 3 groups of metabotropic glutamate receptors: I, II, and III. Groups II– and III–type metabotropic glutamate receptors act as autoreceptors on glutamatergic neurons and have received maximum attention. Their activation causes decreased glutamate release from neurons through mechanisms still largely unknown.8 Indeed, agonists of group II metabotropic glutamate receptors are considered neuroprotective agents in knock-out mice.9
The term “excitotoxicity” refers to a multifaceted pathway initiated by massive extracellular glutamate levels causing excessive calcium influx primarily through NMDAR, accounting for neuronal cell death in several neurologic diseases. Glutamate is largely intracellular (5–10 mmol/kg wet weight depending on the brain region), and only a tiny fraction is present in the extracellular space (3–4 μmol/L).10 The enormous quantity of glutamate in the human brain and the dangers of excessive extracellular glutamate, for powerful protective mechanisms such as rapid uptake of glutamate by astrocytes are key for brain tissue vitality. High-affinity EAATs are transmembrane sodium-dependent receptors that involve a cotransport of 3Na+ ions for each molecule of glutamate uptake. This activity is linked to a Na+-K+ adenosine triphosphatase to maintain transmembrane concentration gradients. EAAT1 (also called GLAST) and EAAT2 (glutamate transporter 1) are subtypes found on glial cells, whereas EAAT3 (also called EAAC) is found on neuronal cells.11 EAATs play a key role in maintaining excitatory glutamatergic neurotransmission by the following: 1) avidly removing glutamate from the synapse, 2) initiating glutamate/glutamine cycle, and 3) increasing astrocytic glucose consumption and production of lactate. In several neurodegenerative states, astrocytic control of glutamate homeostasis is profoundly affected due to diminished EAAT activity or abnormal genetic splicing of their genes.11
GABA
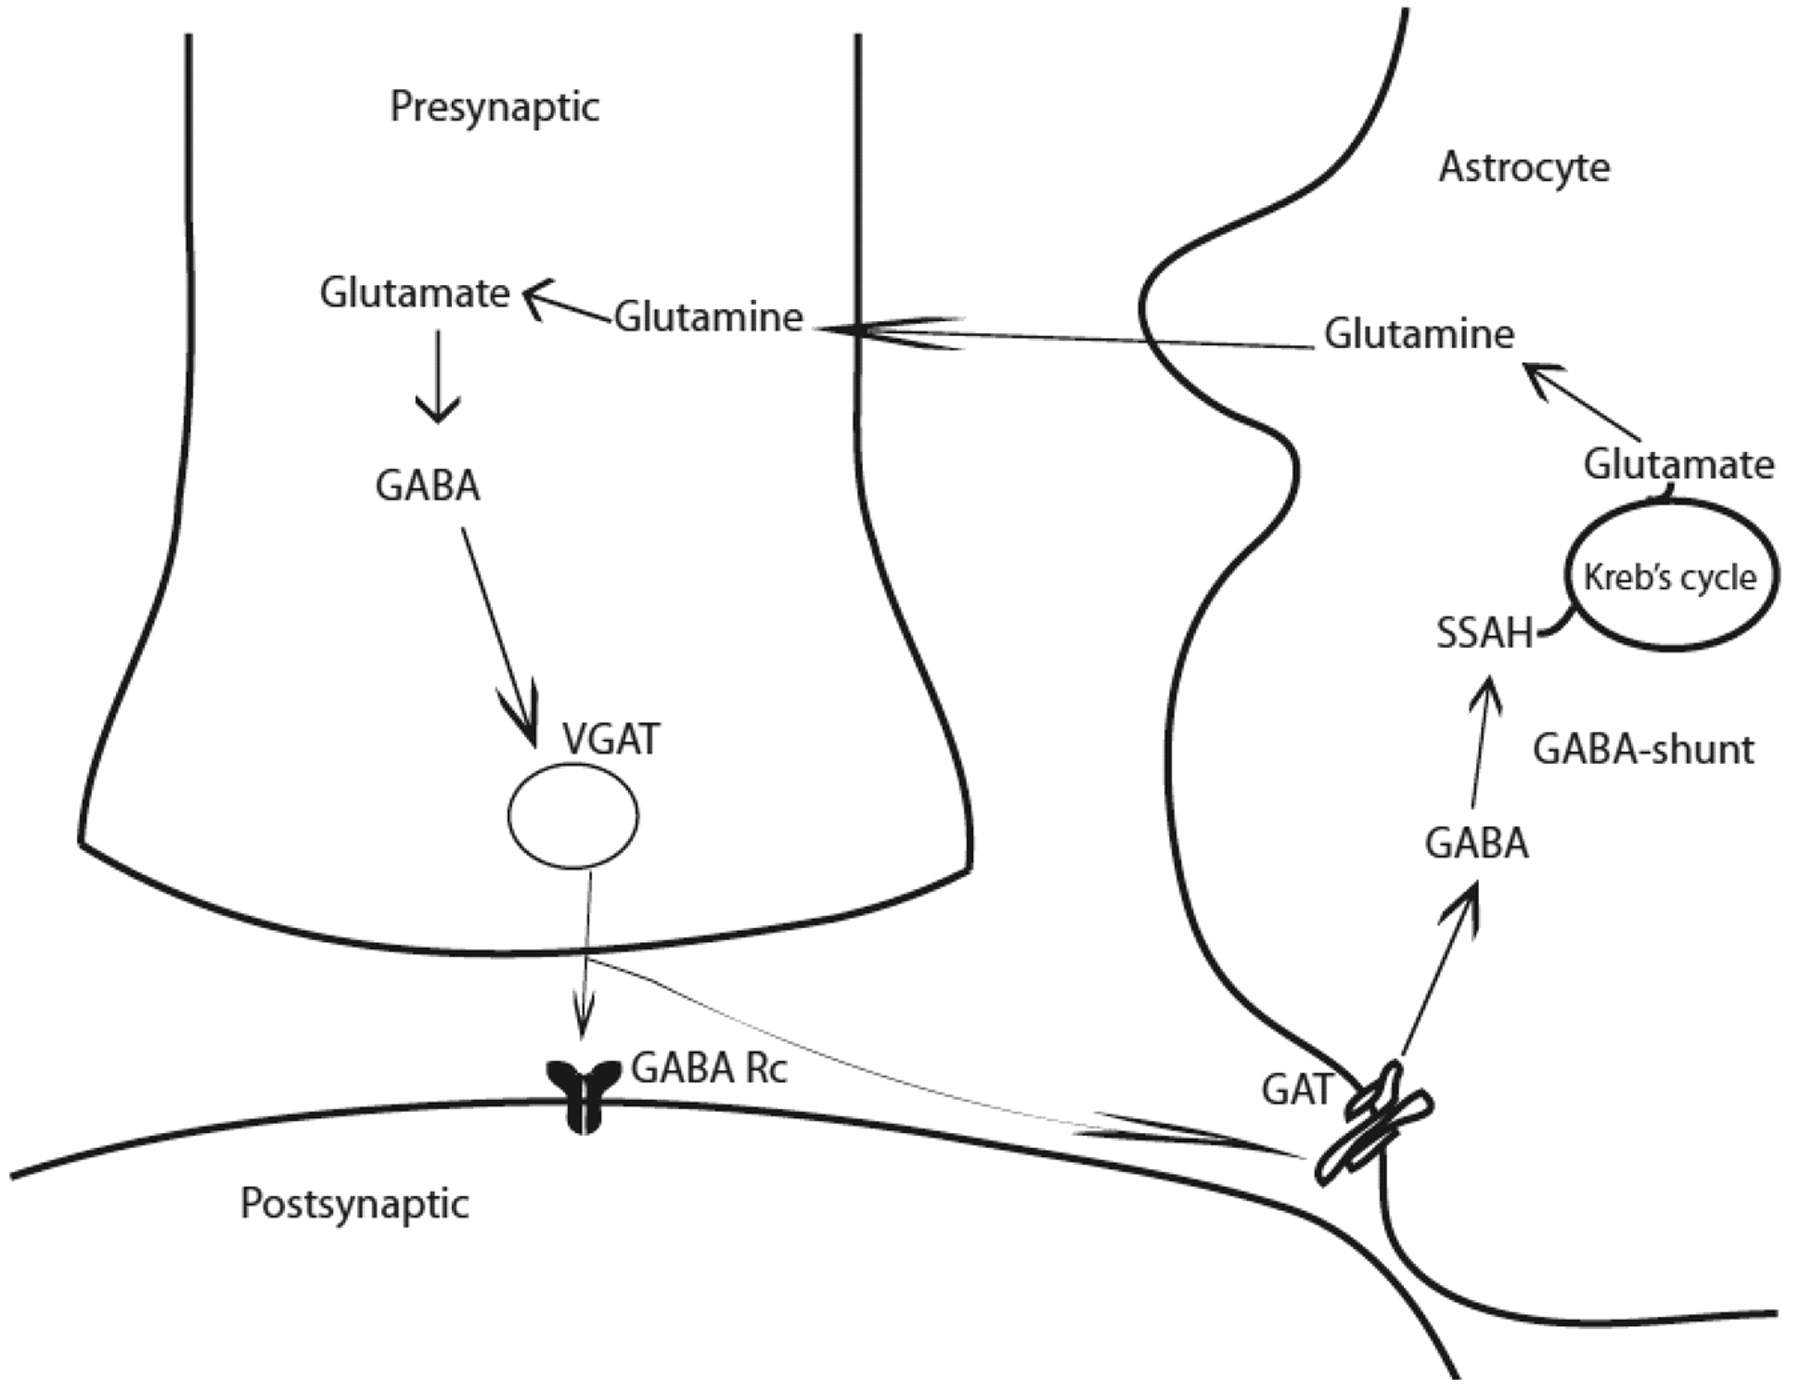
GABA in mature mammalian brain acts primarily as an inhibitory neurotransmitter. GABA is synthesized in a single step from its precursor glutamate by GAD, an enzyme found only in GABAergic neurons (Fig 2). An alternative metabolic pathway operating in these neurons is called the GABA shunt. In an initial step, α-ketoglutarate formed from glucose metabolism via the Krebs cycle, is transaminated by α-oxoglutarate transaminase to form glutamate. GABA is metabolized by successive transamination and oxidation to yield succinic semialdehyde and succinic acid, respectively.

GABAergic synapse. GABA is synthesized from glutamate by the action of GAD and is stored in vesicles by a vesicular neurotransmitter transporter. Once released in the synapse, GABA acts on its receptors (GABA Rc) and shapes the inhibitory action potential. GABA activity is terminated by its uptake through GABA transporters by surrounding neurons and astrocytes. GABA is metabolized through transamination into succinic semialdehyde catalyzed by GABA-transaminase (GABA shunt). Note:—GABA Rc = GABA receptors.
The generation of GABA is unique because 2 isoforms of rate determining GAD, GAD65, and GAD67, have been shown to regulate its synthesis and contribute to GABA metabolic or cytosolic and neurotransmitter or vesicular pools, respectively. These enzymes are products of separate genes. GABA produced from GAD67 is largely cytoplasmic and acts as a trophic factor for synaptogenesis and protects from neuronal injury, whereas GABA produced from GAD65 is used for neurotransmission and is more ubiquitously found in the mammalian brain.12 GAD65 also assists in the vesicular transport of GABA, ensuring efficient coupling between GABA synthesis and packaging into synaptic vesicles.13 GAD65 in its inactive form is bound to a cofactor, pyridoxal-phosphate, and can be converted to its active form immediately, during neurotransmission when additional GABA is required.14 As with glutamate, both inotropic (GABAA and GABAC) and metabotropic (GABAB) receptors for GABA neurotransmission have been identified. These receptors are composed of several subunits, and their diverse combination determines channel kinetics, affinity for GABA and drug binding, and the rate of desensitization. GABAA and GABAC respond to GABA binding by enhancing inward Cl− current, causing neurons to hyperpolarize. GABAB receptors are G-protein-coupled and mediate both presynaptic and postsynaptic inhibition by suppressing Ca+ influx (thus reducing neurotransmitter release) and by activating K+ currents respectively.
GABA uptake is carried out by high-affinity Na+/Cl−–dependent transporters. Four GABA transporters have been indentified: GAT1, GAT2, GAT3, and low-affinity BGT1. These transporters exhibit different inhibitor sensitivities and are differentially distributed within the CNS in both astrocytic processes and in the neurons.15 GABA uptake is not associated with ATP or glucose consumption in contrast to glutamate recycling, which makes cortical inhibition less energy demanding.16 GABA transporters are fundamental in terminating GABA activity and contribute to shaping the inhibitory postsynaptic potential.17 GATs may, in certain conditions, release GABA into the synapse. Because GABA release through GABA transporters is ATP-independent, in physiologic conditions of burst firing, GABA-transporters–mediated release of GABA is more advantageous than ATP-dependent vesicular GABA release.
NAAG
Because NAAG is a peptide and is not able to alter membrane potential, at first it was considered to have only a metabolic function. There is now substantial data showing that NAAG is an important neurotransmitter that also serves as a neuroprotector by regulating glutamate concentration in the synapse (Fig. 3). Absolute quantification of NAAG by using 1H-MR spectroscopy has shown that NAAG concentrations in the brain approximate to around 1.5–2.7 mmol/L (white matter) and 0.6–1.5 mmol/L (gray matter), making NAAG the most abundant peptide in the brain.18 It is co-localized in most neurons, and in particular glutamatergic but also GABAergic neurons. The biosynthesis of NAAG has not yet been well-characterized. Data available support the finding that NAAG synthesis is enzyme-mediated rather than posttranslational and occurs between NAA and glutamate.19 NAAG is co-released with glutmate during neuronal depolarization.

NAAG neurotransmission and neuromodulation. NAAG is synthesized in neurons via NAAG synthase. NAAG is co-released with glutamate from actively firing neurons. Intrasynaptic NAAG binds as a weak antagonist on NMDAR and also to mGlu3 receptors inhibiting further release of glutamate (inhibitory feedback loop). NAAG is hydrolyzed to NAA and Glu by GCPII enzyme on astrocytes.
NAAG has several functions. First, it is known to activate group II metabotropic glutamate 3 receptors on presynaptic neurons. Activation of these metabotropic glutamate 3 receptors by NAAG dampens glutamate release during intense neuronal firing.20 Second, a mixed agonist/antagonist action of NAAG on NMDAR has been advocated.21 This negative modulatory effect of NAAG on NMDAR is likely to be important in synaptic plasticity and in conferring neuroprotection against excessive glutamatergic activity. Third, although not widely documented, NAAG initiates astrocytic metabotropic glutamate 3-receptor-mediated Ca2+ oscillations in the astrocytes. This calcium wave results in a secondary astrocytic signal intensity to smooth muscle cells of nearby blood vessels, triggering vasodilation and consequent hyperemia in locally activated neurons.22 Thus induced local hyperemia is evidence in favor of the housekeeping role of NAAG in satisfying metabolic demands in areas of neuronal firing and its direct relationship between energy metabolism (vasodilation) and cognition (neuronal activity).23
NAAG is hydrolyzed to NAA and glutamate by an astrocyte receptor complex made up of an astrocytic metabotropic glutamate 3 receptor to which is bound glutamate carboxypeptidase II.22 Glutamate carboxypeptidase II inhibitors have been shown to depress hyperemic responses in in vivo animal functional MR imaging studies.24 Glutamate carboxypeptidase II inhibitors represent molecules of considerable interest due to their potential to increase local NAAG levels.
Clinical and Research Applications
Epilepsy.
In the early 1950s, it was shown that glutamate applied directly to the cerebral cortex induced seizures.25 Several factors may contribute to increased glutamate in epilepsy. Decreased expression of GLT-1 and GLAST (such as in epileptic syndromes); increased NMDAR, AMPAR, and kainate receptor activity; and altered metabotropic glutamate receptor function have all been described as enhancing glutamatergic activity in epilepsy.26 Astrocytes may also play an important role in increasing local glutamate levels.27 Downregulation of glutamine synthetase in sclerotic epileptic tissue may reduce the glutamate/glutamine cycling, affecting glutamate clearance. Abnormal Ca2+ oscillations in astrocytes may contribute to glutamate release from astrocytes. These oscillations have been related to synchronous EEG activity. Pathologic reversal of glutamate transport through EAATs can contribute to increased glutamate.
A vast body of 18FDG-PET studies has shown interictal hypometabolism centered in the seizure focus.28 If astrocytic glutamate uptake concomitantly stimulates glucose consumption, then 18FDG-PET–measured hypometabolic areas may be interpreted in terms of glutamate dysregulation due to energy failure and resultant inadequate glutamate/glutamine cycling.29
Potentiation of GABAergic neurotransmission is the main mechanism of modern antiepileptic drugs.30 GABA interneurons in the hippocampal cortex terminate sustained burst firing and limit lateral spread of electrical activity by creating inhibitory surround. Besides classic benzodiazepines, several compounds have been designed to specifically increase disposition of GABA so as to increase its inhibitory activity. New antiepileptic drugs such as Vigabatrin inhibits GABA transaminase, and tiagabine competes with GABA transporter, thereby increasing local GABA levels.
A significant reduction of NAAGergic neurons has been found in area CA1 and in the subiculum of chronic epileptic rats with respect to controls.31 Increased activity of glutamate carboxypeptidase II has also been shown in genetically epileptic-prone rats, which leads one to believe that NAAG may be degraded and may contribute to electrical instability in the epileptic brain.32
GABA is reduced in patients with poor seizure control as shown by using 1H-MR spectroscopy,33 and treatment with vigabatrin has increased GABA levels and has improved seizure control.34 Significant increases in total glutamate levels have been found in the hippocampus in patients with negative MR imaging findings with respect to those with hippocampal sclerosis.35,36 Other 1H-MR spectroscopy and epilepsy studies are summarized in the Table. Histopathologic study of a large group of focal cortical dysplastic tissues from patients treated surgically for medically intractable epilepsy revealed a significant paucity of EAAT1 and EAAT2 receptors with respect to control tissues, suggesting a decreased clearance of glutamate.37 It is exciting to envision that neurotransmitters may one day be quantified from spectra obtained from EEG-guided specific voxels and that this quantification would be useful in understanding the chemical underpinnings of medically intractable epilepsy. It would be of particular interest in patients with epilepsy and negative MR imaging findings and would guide antiepileptic adjunctive therapy.
Selected studies reporting 1H-MR spectroscopy-detected glutamate and GABA changes in the in vivo brains of patients with neurologic disorders
ALS.
In ALS, one of the most accredited theories of neuronal death is glutamate-induced excitotoxicity.38 Of note, the only effective and US Food and Drug Administration–approved drug available to reduce disease progression in ALS is a glutamate modulating drug, riluzole.39 1H-MR spectroscopy studies in animal models of familial ALS suggest changes in glutamate concentrations in the motor cortex.40 One recent study used a TE-averaged editing technique in 1H-MR spectroscopy and demonstrated that there is an increase in total glutamate in the primary motor cortex of patients with ALS, which correlated with disease severity in addition to low levels of NAA/Cr.41 Astrocytes have a neuroprotective role and maintain intrasynaptic low glutamate levels; however, pathologic astrocytes in patients with ALS may be responsible for rapid disease progression.42
Upregulation of glutamate carboxypeptidase II in the motor cortex of postmortem ALS tissue, increased levels of NAAG and glutamate in the CSF, and decreased concentrations of NAAG in the ventral horns of the spinal cord of patients with ALS have all been reported.43,44 Low levels of NAAG have been found in the primary motor cortex of patients with ALS in a recent 1H-MR spectroscopy study (Agarwal et al, unpublished data).
Other Neurologic Diseases.
There is some evidence by using in vivo 1H-MR spectroscopy that glutamate levels are reduced in the hippocampus of patients with AD, which may be responsible for memory and cognitive impairment in addition to altered cholinergic neurotransmission.45 As disease progresses, glutamate levels determined by 1H-MR spectroscopy decrease in the hippocampus of animal models of AD.46 Glutamate levels have been monitored by using 1H-MR spectroscopy after specific therapy with memantine (glutamate modulating drug) and galantamine (cholinesterase inhibitor).47,48 In PD, glutamate levels are lower than in AD, and low glutamate levels have been suggested as likely biomarkers of PD.49
Longitudinal monitoring of metabolites by using in vivo 1H-MR spectroscopy in animal models of Huntington disease demonstrates a gradual increase in striatal glutamate.50 Increased glutamate has also been reported in the basal ganglia and striatum of patients with juvenile onset Huntington disease.51
There is evidence of some success in applying 1H-MR spectroscopy techniques in neurodegenerative diseases to understand the neurochemical underpinnings of the disease and to provide a means of monitoring disease outcome with therapy (Table).
Discussion
1H-MR spectroscopy has been widely used in neurology to assess changes in common metabolites such as NAA, choline, Cr, myo-inositol, lipids, and lactate. However, such information represents only part of the complex chemical change that occurs in neurologic diseases, and more often than not, such findings are nonspecific. Because chemical neurotransmission is key in neural communication, detecting changes in neurotransmitter levels is of special interest in basic and clinical neuroscience research. Knowledge of alterations in neurotransmitters and their in vivo detection could provide added information of the pathophysiology of neurologic diseases, guide therapeutic interventions, monitor disease progression, and evaluate changes with therapy. 1H-MR spectroscopy may be the only imaging technique to identify progressive neurochemical and neurotransmitter changes in degenerative disease that may require different therapeutic options in patients during the early and later phases of the disease. Such attempts have been applied in psychiatric diseases to better understand the neurotransmitter alterations that are involved and how these may be modified with therapy.52,53
In the past 20 years, significant development in 1H-MR spectroscopy techniques has revolutionized our understanding of the biologic behavior of neurotransmitters in the in vivo human brain. However, the application of such methods in clinical neurologic practice is still relatively novel. Only a handful of studies exist, and a comparison among these remains challenging in the face of small sample sizes and variable medication effects, illness durations, sex effects, different spectral acquisition protocols, and methods for quantification of neurochemicals.54 1H-MR spectroscopy is particularly sensitive to magnetic field strength, and a high-resolution spectrum requires a field strength of the ≥1.5T. In addition, a growing concern is the validity of reported findings that use Cr as a denominator because Cr has been reported to change in several diseases.55,56 This heterogeneity of methodology used has unfortunately done little to provide formal evidence-based medicine reports that could support the utility of 1H-MR spectroscopy for the detection of neurotransmitter levels.
Detection of neurotransmitters in the intact brain may provide invaluable information to neurologists. While neurotransmitter imaging is attractive in daily practice, it is wise to be aware that clinical application in single patients is not yet possible. A certain degree of inter- and intrasubject variability has been shown, and scanning the same subject twice could reveal a coefficient of variation of 10%–12%, even when using the same method.57 It is important to recognize the existence of regional differences in neurotransmitter distribution as well as variation between tissue types (gray matter, white matter, and cerebrospinal fluid). Even the smallest voxel (8 mL) would include signal intensity from different tissue types in the brain; and without appropriate segmentation of the voxel into tissue types, spurious changes in the quantification of metabolites may occur. Furthermore, some regions of the brain may not be accessible to spectroscopic techniques due to the close proximity of the voxel to scalp lipids or to an air-tissue interface. Standardization of software used for “fitting” 1H-MR spectroscopy data must be established to provide normalized concentrations of neurotransmitters in the gray and the white matter that can be compared with patient data. So far, the Linear Combination LC Model (Steven Provencher, Oakville, Ontario, Canada) has been considered a standard fitting program for 1-dimensional 1H-MR spectroscopy data.58 Therefore, to improve confidence in 1H-MR spectroscopy, to make it a financially reimbursable diagnostic tool, and to meet the criteria of evidence-based medicine, development and standardization of methods are essential. Most MR imaging vendors are now sensitive to the promise held by editing methods, and high-field magnetic scanners are rapidly becoming more widely available. In short, it is important when attempting to “read” a spectrum, either in a clinical setting or when evaluating spectroscopic literature, to know the field strength, the kind of 1H-MR spectroscopy sequence, and the fitting method used to obtain the spectrum.
Conclusions
The development and availability of noninvasive clinical and research tools to assess the intact brain is an important quest. Advancements in the application of 1H-MR spectroscopy in selectively identifying neurotransmitters in neurologic disorders will shed some light on the neurochemical changes associated with disease progression and on mechanisms by which selective drugs work and will provide new treatment targets for drug development.
Footnotes
-
This work was supported in part by a grant from DAO15116 (N.A., P.F.R.) and in part by funding from the Utah Science Technology and Research Initiative of the University of Utah.
-
Disclosures: Perry Renshaw, Research Support (including provision of equipment and materials): Roche and GSK. Details: Prior support for clinical/imaging trials. Consultant: Kyowa Hakko Kirin, Ridge Diagnostics, Novartis. Details: Kyowa Hakko Kirin, payment at a standard rate for work done on the use of citicoline as a nutritional supplement. Ridge Diagnostics, payment for services and equity holder for a privately held company that is working on the development of a blood test for major depression. Novartis, formerly a consultant on the use of imaging in drug development. Ownership Interest: Ridge Diagnostics. Details: See above. Less than 5% owner. Other Financial Relationships: Repligen Corporation. Details: Royalty payments for a patent on the use of uridine as a treatment for bipolar disorder.
Indicates open access to non-subscribers at www.ajnr.org
References
- 1.↵
- 2.↵
- 3.↵
- 4.↵
- 5.↵
- 6.↵
- 7.↵
- 8.↵
- 9.↵
- 10.↵
- 11.↵
- 12.↵
- 13.↵
- 14.↵
- 15.↵
- 16.↵
- 17.↵
- 18.↵
- 19.↵
- 20.↵
- 21.↵
- 22.↵
- 23.↵
- 24.↵
- 25.↵
- 26.↵
- 27.↵
- 28.↵
- 29.↵
- 30.↵
- 31.↵
- 32.↵
- 33.↵
- 34.↵
- 35.↵
- 36.↵
- 37.↵
- 38.↵
- 39.↵
- 40.↵
- 41.↵
- 42.↵
- 43.↵
- 44.↵
- 45.↵
- 46.↵
- 47.↵
- 48.↵
- 49.↵
- 50.↵
- 51.↵
- 52.↵
- 53.↵
- 54.↵
- 55.↵
- 56.↵
- 57.↵
- 58.↵
- 59.
- 60.
- 61.
- 62.
- 63.
- 64.
- 65.
- 66.
- 67.
- 68.
- 69.
- 70.
- 71.
- 72.
- © 2012 by American Journal of Neuroradiology


