
Abstract
BACKGROUND AND PURPOSE: Identifying MRI biomarkers that can differentiate multiple sclerosis patients from other neurological disorders is a subject of intense research. Our aim was to investigate phase WM signal abnormalities for their presence, prevalence, location, and diagnostic value among patients with clinically isolated syndrome and other neurologic disorders and age-, sex-, and group-matched healthy controls.
MATERIALS AND METHODS: Forty-eight patients with clinically isolated syndrome and 30 patients with other neurologic diseases and a healthy control group (n = 47) were included in the study. Subjects were scanned at 3T by using SWI-filtered phase and T2WI, with WM signal abnormalities ≥3 mm being classified.
RESULTS: Patients with clinically isolated syndrome had significantly more phase and T2 WM signal abnormalities than healthy controls (P < .001). Phase WM signal abnormalities were more prevalent among patients with clinically isolated syndrome compared with patients with other neurologic disorders (4:1 ratio), whereas T2 WM signal abnormalities were more ubiquitous with a 2:1 ratio. The presence of phase WM signal abnormalities was sensitive for clinically isolated syndrome (70.8%) and achieved a moderate-to-high specificity for differentiating patients with clinically isolated syndrome and healthy controls, patients with other neurologic disorders, and patients with other neurologic disorders of other autoimmune origin (specificity, 70%–76.7%). Combining the presence of ≥2 phase lesions with the McDonald 2005 and 2010 criteria for dissemination in space improved the specificity (90%), but not the accuracy, in differentiating patients with clinically isolated syndrome from those with other neurologic disorders. In subanalyses among patients with clinically isolated syndrome who converted to clinically definite multiple sclerosis versus those who did not within a 3-year follow-up period, converters had significantly more phase (P = .008) but not T2 or T1 WM signal abnormalities.
CONCLUSIONS: Phase WM signal abnormalities are prevalent among patients with clinically isolated syndrome. The presence of (multiple) phase WM signal abnormalities tended to be more predictive of conversion to clinically definite multiple sclerosis and was specific in differentiating patients with clinically isolated syndrome and other neurologic disorders, compared with T2 WM signal abnormalities; however, the accuracy remains similar to that of the current McDonald criteria.
ABBREVIATIONS:
- CDMS
- clinically definite MS
- CIS
- clinically isolated syndrome
- DIS
- dissemination in space
- HC
- healthy control
- OND
- other neurologic disorders
- ROC
- receiver operating characteristic
- SA
- signal abnormality
The occurrence of WM signal abnormalities (SAs) is a hallmark feature of multiple sclerosis, yet the clinical relevance of the pathologic substrate of WM-SAs is disappointing.1⇓⇓–4 WM-SAs observed on T2WI and T1WI represent focal pathology and are thought to be caused by inflammation, edema, demyelination, or gliosis.2 They are usually secondary to active inflammation, imaged by using postcontrast T1WI gadolinium-enhanced scanning.5 Even though T2 WM-SAs are present at the first demyelinating episode, the poor specificity of conventional MR imaging1,6 and comparable MR imaging features at disease onset compared with ischemic, autoimmune diseases or aging limits their predictive value.
Previously, differential diagnosis between MS and other conditions was considered by using brain and spinal cord MR imaging and incorporating number, location, and morphology of T2 WM-SAs in the diagnostic criteria of MS7 or by using different nonconventional MR imaging techniques.6,8⇓–10 It is important to further investigate the value of nonconventional MR imaging techniques in the MS differential diagnosis, for example by using SWI-filtered phase to identify early focal brain pathology indicative of MS, especially in patients with clinically isolated syndrome (CIS).
Recent studies have confirmed histologically that WM-SAs visible on MR imaging phase and R2* correspond to focal iron deposits, whereas T2 and T1 WM-SAs are influenced by water content.11 A substantial subset of MS WM-SAs has phase shifts11,12 and morphologic differences.11⇓⇓⇓–15 However, factors other than nonheme iron may influence the observed WM-SA signal, such as changes in myelin, deoxyhemoglobin, and inflammation.11,16⇓⇓–19 Therefore, because there are a multitude of effects, it is not fully known to what extent they each individually influence SWI-filtered phase changes.
Phase changes may signal early WM-SA development17,20 in that these phase WM-SAs may appear initially but then disappear as the pathology advances.17 Considering that the distinct pathologies influencing phase shift (eg, cellular/myelin destruction, iron levels, microstructural changes) in WM-SAs are most likely intricately related and are observed in MS and related disorders,12,14,15,21⇓–23 the inquiry into pathology visible on SWI-filtered phase remains important regardless of the causative factors.
SWI-filtered phase work has mostly focused on patients with MS,11,13⇓–15,24 high-field-strength imaging,11,13,24 or histologically validating phase WM-SAs.11,25 Regardless of what pathology phase WM-SAs represent, it is imperative to identify whether their presence has diagnostic value. In the present study, we assessed WM-SAs visible on T2WI and SWI-filtered phase among patients with CIS and patients with other neurologic disorders (OND) to investigate their prevalence, location, and ability to differentiate disease groups.
Materials and Methods
Subjects
This study used data from an ongoing prospective study of genetic and environmental risk factors in MS.26,27 One-hundred twenty-five subjects satisfied the inclusion criteria: CIS, OND, or healthy control (HC) and having an MR imaging scan obtained with an SWI sequence. Forty-eight patients were diagnosed with CIS (disease duration = 2.8 ± 3.9 years), while 47 HCs were age- and sex- matched to the patients with CIS and OND. From the 48 patients with CIS, subanalyses were performed on 20 patients who underwent a second clinical attack within a 3-year follow-up period (clinically definite multiple sclerosis [CDMS]), 12 remained clinically stable (non-CDMS), while no follow-up was available for 16 patients with CIS. Presented analyses are based on baseline data because the follow-up MR imaging protocols were not standardized. In addition, 30 patients with OND were also included. HCs were recruited from volunteers who had normal neurologic examination findings without a history of any neurologic or psychiatric disorders. Patients with CIS were recruited from the MS clinic if they had no relapse and were not treated with steroids within the month preceding study entry. The OND group was recruited from the Department of Neurology specialized clinics and consisted of a heterogeneous assortment of neurologic patients that included degenerative (n = 10, 33.3%), autoimmune (n = 10, 33.3%), and vascular (n = 10, 33.3%) disorders. Participants underwent full neurologic assessment and were excluded if they had pre-existing medical conditions or were pregnant. Written informed consent was obtained, and the study protocol was approved by our institutional review board.
MR Imaging Acquisition
Scans were acquired on a 3T Signa Excite HD 12.0 (GE Healthcare, Milwaukee, Wisconsin) by using a multichannel head and neck coil. We acquired the following sequences: 3D flow-compensated gradient-echo for SWI, T2WI and proton attenuation, FLAIR, and T1WI spoiled gradient-echo with magnetization-prepared inversion recovery pulse. Imaging parameters are presented in On-line Table 1.
Image Analysis and White Matter Signal-Abnormality Classification
SWI-filtered phase images were reconstructed, processed, and analyzed as described previously.12,15 Each subject's images and WM-SA maps were coregistered into a subject-specific upsampled FLAIR image space (576 × 768 × 64) with 0.33 × 0.33 × 2 mm voxels. The FMRIB Linear Image Registration Tool software28 (http://www.fmrib.ox.ac.uk/) was used to determine the optimal 6 df (rigid-body) registration. Images were resampled by using trilinear interpolation, and WM-SA maps were resampled with nearest neighbor interpolation by using the registration matrix of their associated images. Identification of WM-SAs was done by using a semiautomated edge-detection contouring/thresholding technique.29
The classification of phase WM-SAs was previously determined to be reproducible by using the same methodology and rater.12 Image analyses were performed by a single operator blinded to the clinical status. The operator had 4 years of experience in phase WM-SA identification. WM-SAs were identified separately on T2/proton-attenuation/FLAIR and SWI-filtered phase maps in a blinded manner without a priori knowledge of where the WM-SAs were located with respect to the other technique. Round/oval WM-SAs ≥3 mm were included in the study (Fig 1). In addition, a subset of WM-SAs was visible on both SWI-filtered phase and T2/proton-attenuation/FLAIR; these were identified a posteriori as overlapping when ≥1 voxel overlapped, after unblinding was performed. Location of both T2 and phase WM-SAs was determined and divided into periventricular, juxtacortical, infratentorial, and deep WM regions according to anatomic location. T2 WM-SAs were classified according to the McDonald 200530 and 20107 criteria for dissemination in space (DIS).

Phase (top) and FLAIR imaging (bottom) WM signal abnormalities in patients with clinically isolated syndrome, other neurologic diseases, and healthy controls. Red arrows indicate a hypointense ring on nodular-phase WM-SAs on SWI. Note the presence of phase WM-SA in the right periventricular region in the patient with CIS, which is not present on FLAIR.
Global and tissue-specific brain volumes were acquired on 3D T1WI by using SIENAX, Version 2.6, in FMRIB.15 Normalized volume measures of the whole brain, gray matter, white matter, and lateral ventricles were calculated.
Statistical Analysis
Analyses were conducted by using the Statistical Package for the Social Sciences 20.0 (IBM, Armonk, New York) and R for Windows 2.15.2 (R-project; http://www.r-project.org/). Demographic characteristics were compared by using the t test and χ2 test. WM-SA characteristics were compared between groups by using the Mann-Whitney U test.
Receiver operating characteristic (ROC) analysis curves were computed to calculate the area under the ROC curve for distinguishing CIS, OND, and HC groups on the basis of the frequency of both phase and T2 WM-SAs. To investigate whether the presence of phase-, T2, and overlapping phase T2 WM-SAs can aid in the differential diagnosis of patients with CIS from HCs and patients with OND, we conducted sensitivity, specificity, and accuracy analysis. We also examined whether the use of dichotomized variables (the presence of multiple phase lesions and a combination of multiple phase lesions with fulfillment of the McDonald 200530 and 20107 criteria for DIS) may further improve sensitivity and specificity in differentiating patients with CIS from those with OND. Analyses were repeated between patients with CIS who remained stable and those who progressed to CDMS after a 3-year follow-up. All P values were adjusted by using the false discovery rate at the P < .05 level.31
Results
Demographic Characteristics
HC subject groups were age- and sex-matched to patients with CIS and OND (Table 1). Patients with CIS and OND had a mean disease duration of 2.8 ± 3.9 years and 12.3 ±11.2 years, respectively, and patients with CIS had a median Expanded Disability Status Scale score of 1.5 (interquartile range = 1). Patients with CIS had a significantly higher T2 WM-SA volume compared with HCs. Global and tissue-specific brain volumes were consistently smaller in the CIS and OND groups compared with the HC groups but did not reach statistical significance, with the exception of normalized WM volume, which was smaller in patients with CIS. Patients with CIS who converted to CDMS at follow-up did not differ significantly on demographic characteristics from those who did not (P > .05).
Demographic characteristics of patients with clinically isolated syndrome and other neurologic disorders and healthy controlsa
Presence, Prevalence, and Location of White Matter Signal Abnormalities
Table 2 reports the prevalence of WM-SAs visible on SWI-filtered phase and T2WI and WM-SAs overlapping between these 2 modalities. In total, 186 phase and 770 T2 WM-SAs (92 overlapping) were observed among patients with CIS, whereas HCs only showed 19 phase, 46 T2 WM-SAs, and zero overlapping WM-SAs (all P < .001). This yielded a ratio of phase WM-SAs and T2 WM-SAs between CIS and HCs of 10:1 and 16:1, respectively. Most interesting, phase WM-SAs were, on average, more prevalent (4.7:1 ratio) among patients with CIS than among those with OND (CIS mean = 3.88 ± 5.2, OND mean = 0.83 ± 2.15, P < .001), whereas T2 WM-SAs were more prevalent at a 2:1 ratio for CIS versus OND (CIS mean = 16.04 ± 14.27 versus OND mean = 8.1 ± 11.99, P < .001). In subanalyses among patients with CIS who converted to CDMS versus those who did not within a 3-year follow-up period, converters had significantly more phase (CIS mean = 1.6 ± 1.8 versus CDMS mean = 6.2 ± 6.8, P < .01) but not T2 or T1 WM-SAs (P > .05).
Location of white matter signal abnormalities visible on SWI-filtered phase, T2WI, and their overlaps between patients with clinically isolated syndrome, other neurologic disorders, and healthy controlsa
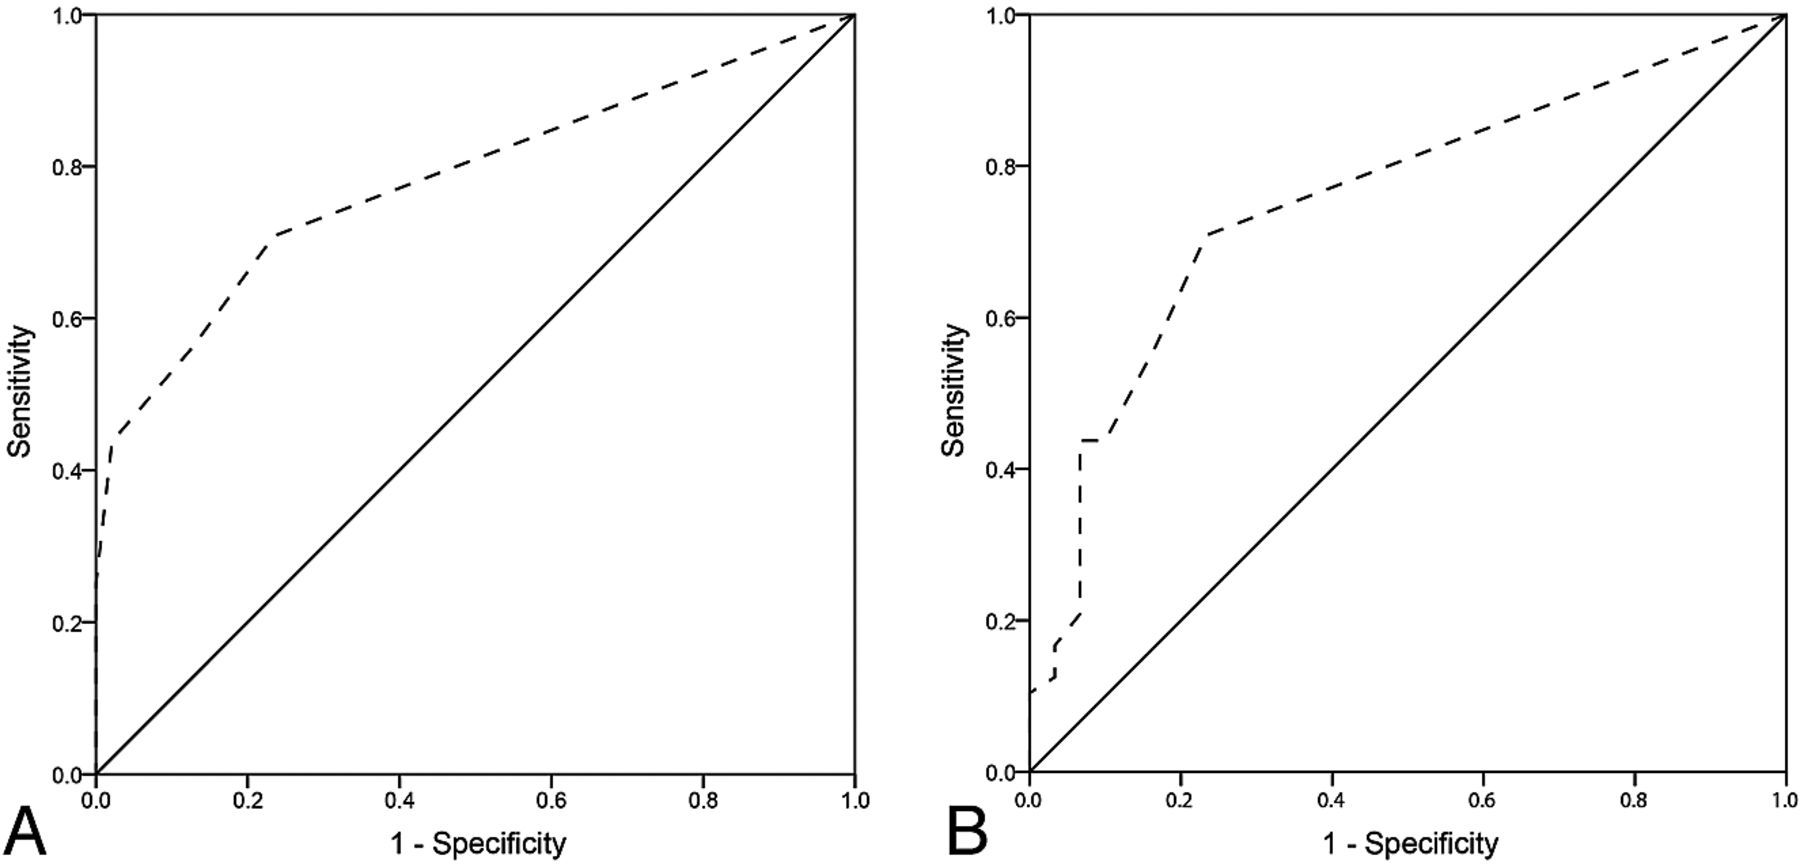
In ROC curve analysis by using the frequency of phase, T2, and overlapping WM-SAs, the areas under the ROC curve for CIS versus HC were 0.782 (Fig 2A), 0.818, and 0.781, respectively. Phase WM-SAs had a moderate-to-high area under the curve in distinguishing CIS from OND (area under the curve = 0.755, Fig 2B). T2 WM-SAs and overlapping WM-SAs had respective areas under the curve of 0.739 and 0.725.

ROC curves for the number of phase white matter signal abnormalities in differentiating patients with clinically isolated syndrome versus healthy controls (A) and patients with CIS versus those with other neurologic diseases (B).
The most common location of phase WM-SAs across all study groups was the periventricular region (56%–84%), followed by the deep WM (16%–28%) and juxtacortical regions (0%–16%) (Table 2). No phase WM-SAs were observed infratentorially. While phase WM-SAs were relatively confined to the periventricular region, the occurrence of T2 WM-SAs was divided between the periventricular and deep WM areas. Of the 19 phase and 46 T2 WM-SAs observed in the HC group, no WM-SAs were visible on both sequences. Ninety-two of the 770 T2 WM-SAs (12%) in patients with CIS were also visible on SWI-filtered phase, while among patients with OND, 12 of the 243 T2 WM-SAs (5%) overlapped the SWI-filtered phase.
Sensitivity and Specificity Analysis
Sensitivity and specificity analysis of phase, T2, and overlapping phase T2 WM-SAs is shown in Table 3. The presence of phase WM-SAs was both a sensitive (70.8%) and specific (76.6%) method of differentiating patients with CIS from HCs. Because of the relatively high prevalence of T2 WM-SAs, the sensitivity was 93.9% but the specificity was lower at 68.8%. A high specificity (100%) but medium sensitivity (55.1%) was observed for WM-SAs visible on both T2 and SWI-filtered phase. Most interesting, the presence of phase (sensitivity, 70.8%; specificity, 76.7%) and overlapping WM-SAs (sensitivity, 56.3%; specificity, 90%) differentiated relatively well patients with CIS and those with OND (P < .001), whereas the presence of T2 WM-SAs yielded high sensitivity (95.8%) but low specificity (13.3%). Additional analyses revealed that patients with OND with autoimmune origin other than CIS (a subset of the OND group, n = 10) could be accurately differentiated from patients with CIS when considering the presence of phase (sensitivity, 70.8%; specificity, 70%; accuracy, 70.7%) or overlapping phase T2 (sensitivity, 56.3%; specificity, 80%; accuracy, 60.3%), but not with T2 WM-SAs (sensitivity, 93.9%; specificity, 0%; accuracy, 77.9%).
Sensitivity and specificity for the presence of SWI-filtered phase, T2, and their overlapping white matter signal abnormalities among patients with clinically isolated syndrome, other neurologic disorders, and age- and sex-matched healthy controlsa
The presence of ≥1 phase WM-SA was more sensitive and similarly specific (Table 3) compared with both the McDonald 2005 (Table 4) and the 2010 (Table 4) criteria for DIS when differentiating patients with CIS and those with OND. When we took into account the presence of multiple phase WM-SAs, the specificity of differentiating patients with CIS from those with OND improved up to 93.3% (Table 4), at the cost of lower sensitivity and accuracy. Combining the presence of multiple phase WM-SAs with the McDonald 2005 and 2010 criteria resulted in high specificity (90%) but lower sensitivity and accuracy.
Similar sensitivity, specificity, and accuracy were calculated between patients with CDMS and non-CDMS when taking into account the combination of McDonald 2005 and 2010 criteria and the presence of multiple phase WM-SAs (On-line Table 2).
Discussion
In this study, the presence, prevalence, and location of phase WM-SAs were investigated in a sample of patients with CIS and OND. There are several important observations from our findings: 1) phase WM-SAs were more prevalent among patients with CIS than in HCs and patients with OND; 2) compared with T2 WM-SAs, phase WM-SAs were specific to patients with CIS and had high overall accuracy compared with individuals with OND and even individuals with OND of autoimmune origin; 3) the presence of >1 phase WM-SA increased the specificity in differentiating CIS from OND but was similar to the 2005 and 2010 McDonald criteria for DIS by using T2 WM-SAs; 4) the presence of multiple phase WM-SAs was associated with progression to CDMS from CIS; 5) approximately half of phase WM-SAs were not detected by T2WI and may represent unique pathology; and 6) the presence of multiple phase WM SAs was associated with higher conversion to CDMS.
To our knowledge, this is the first study quantifying the occurrence of phase WM-SAs in an early disease course suggestive of MS, as well as OND, including those of autoimmune origin. Approximately three-quarters of phase WM-SAs were observed in the periventricular region, regardless of disease type, whereas T2 WM-SAs were commonly observed in both the periventricular and deep WM areas. This observation, coupled with there being no infratentorial phase WM-SAs, suggests that phase WM-SAs are either mostly present near the ventricles or are most readily detected periventricularly. No juxtacortical phase WM-SAs were observed in any of the HC subjects, yet 8% of patients with CIS and 7% of those with OND had phase WM-SAs near the neocortex. This finding suggests that the presence of juxtacortical phase WM-SAs may be specific to CNS disease, though confirmation is needed in a larger, healthy sample. In addition, zero WM-SAs were visible on both SWI-filtered phase and T2WI in the total sample of 47 HCs, making the presence of overlapping phase T2 WM-SAs another potential biomarker for CNS disease. The number of phase WM-SAs was significantly higher in patients with CIS versus HCs, as well as in patients with CIS versus those with OND. Evidently, the amount of phase WM-SAs was the highest among patients with CIS, with a ratio of 10:1 compared with the HC group. Similar results were observed for T2 WM-SAs. Approximately 50% of phase WM-SAs in patients with CIS were not visible on T2WI and might represent different pathology or WM-SAs at different development stages.17,32 Inversely, 12% of T2 WM-SAs overlapped with phase WM-SAs, a number in line with but slightly lower than that previously observed (16%–18%) at higher field strengths and in patients at a more advanced disease stage.24,33
Even though this study demonstrates that the presence of phase WM-SAs is both sensitive (70.8%) and specific (76.6%) in distinguishing CIS and HCs, the benefit is not substantial compared with T2 WM-SAs. However, the presence of phase WM-SAs had a high sensitivity and specificity in differentiating patients with CIS and OND, an observation that was even extended to differentiating patients with CIS from those with OND with autoimmune origin. These 2 findings were specific to phase WM-SAs because the presence of T2 WM-SAs had low specificity, limiting its usefulness. Accuracy, a combined measure of sensitivity and specificity, was also higher for phase WM-SAs. This result can be interpreted as the mere presence of phase WM-SAs being suggestive of CIS, whereas T2 WM-SAs can also be observed in other CNS disorders. Indeed, all subjects with OND of autoimmune origin had at least 1 T2 WM-SA.
A recent study showed marked phase shifts in WM-SAs of patients with MS before they appear on conventional MR imaging.20 Yablonskiy et al17 reported that the phase contrast observed in MS WM-SAs is dynamic and may be visible at early disease onset. However, others have reported that ringlike phase WM-SAs remained unchanged for several years.13 Results from the present study indicate that the specificity in differentiating patients with CIS versus those with OND is increased by the presence of multiple phase WM-SAs, even exceeding the specificity of using McDonald 200530 and 20107 criteria for DIS. In fact, in subanalyses among patients with CIS who converted to CDMS versus those who did not within a 3-year follow-up, converters had significantly more phase, but not T2 or T1 WM-SAs. These results indicate that phase WM-SA, in addition to T2 WM-SAs, may be a valuable additional tool for diagnosis and conversion to CDMS of early patients with a single demyelinating episode. Compared with the McDonald 2005 and 2010 criteria, the presence of ≥3 phase WM-SAs was more specific in distinguishing CDMS and non-CDMS; and combining the presence of ≥2 phase WM-SAs with the McDonald criteria increased the specificity of identifying CDMS to >90%.
Previously, researchers have investigated other nonconventional MR imaging techniques8,9 (eg, magnetization transfer,6 diffusion tensor,34 perfusion,10 and MR spectroscopy35) to potentially increase the level of confidence in the differential diagnosis between MS and other conditions. However, there is no consensus at this time regarding their advantage in the differential diagnosis at first clinical onset. It is currently not entirely understood what phase shifts in WM-SAs constitute. Several properties have been proposed, all of which might have differing levels of effect on phase: iron, demyelination, deoxyhemoglobin, and inflammation, as well as tissue microstructure and fiber orientation.11 In a recent autoimmune encephalomyelitis mouse-model study, phase WM-SAs correlated with all of these factors independently.25 A majority of MS WM-SAs have a central vein as seen on MR venography,36,37 and it stands to reason that some WM-SAs visible on SWI-filtered phase are the result of deoxygenated blood in those veins.
The current study included a group of patients with neurologic disorders other than CIS. Drawing conclusions from such a heterogeneous group is challenging. However, the group was included nonetheless to investigate whether there were any contrasting findings compared to patients with CIS. A subset of patients with OND with autoimmune origin confirmed our findings obtained in the whole sample, and even though the sample size was limited, the presence of phase WM-SAs could differentiate this group and patients with CIS, whereas the T2 WM-SAs could not. Similarly, subanalyses of CDMS versus non-CDMS were also conducted on a limited sample size. Another limitation of the present study is that subtypes of phase WM-SAs based on their appearance were not investigated.12⇓–14 Furthermore, the subjects with CIS in the present study were not imaged at clinical onset and may, therefore, represent slightly more advanced patients, potentially influencing the findings. Longitudinal studies are needed to evaluate the value of phase lesions in diagnosing and monitoring patients with CIS and CDMS by dissemination in time and the potential effect of disease-modifying therapy.
Conclusions
This study showed that WM-SAs visible on SWI-filtered phase are relatively specific to patients with CIS, even compared with individuals with OND of autoimmune origin. This finding could render the imaging of phase WM-SAs a potential biomarker aiding in the differential diagnosis. Future longitudinal studies should reveal the source of phase contrast (iron, demyelination, deoxyhemoglobin, inflammation, and so forth) and thoroughly investigate its clinical significance in CNS disorders.
Footnotes
Disclosures: Thomas Guttuso Jr—UNRELATED: Received personal compensation from Teva Pharmaceuticals for speaking and consulting services and from Duchesnay, Inc for consulting services. Nicholas Silvestri—UNRELATED: Received personal compensation for consulting from Biogen Idec. David Lichter—UNRELATED: Received personal compensation for speaking from Teva Neuroscience and UCB Pharma. Jeroen J.G. Geurts—UNRELATED: Has served as a consultant for Merck Serono, Biogen Idec, Teva Pharmaceuticals, Genzyme, and Novartis; received personal compensation for speaking from Novartis, Teva, and Merck Serono and research support from Biogen, the Dutch MS Research Foundation, Merck Serono, and Multiple Sclerosis Society of Canada. Bianca Weinstock-Guttman—UNRELATED: Received honoraria for serving in advisory boards and educational programs from Teva Pharmaceuticals, Biogen Idec, Novartis, Accorda, EMD Serono, and Genzyme. She received speaker honoraria from Biogen Idec, Teva Neuroscience, EMD Serono, Novartis, Pfizer, Genzyme, and Acorda. She also received support for research activities from the National Institutes of Health, National Multiple Sclerosis Society, National Science Foundation, Department of Defense, EMD Serono, Biogen Idec, Teva Neuroscience, Cyberonics, Novartis, Acorda, Pfizer, Genzyme, and the Jog for the Jake Foundation. Robert Zivadinov—UNRELATED: Received consulting fees from Teva Pharmaceuticals, Biogen Idec, Genzyme-Sanofi, Novartis, Claret, and EMD Serono and speaker honoraria from Teva Pharmaceuticals, Biogen Idec, Genzyme-Sanofi, Novartis, and EMD Serono. He has received research support from Biogen Idec, Teva Pharmaceuticals, EMD Serono, Genzyme-Sanofi, Novartis, and Claret.
Indicates open access to non-subscribers at www.ajnr.org
REFERENCES
- Received December 4, 2013.
- Accepted after revision February 24, 2014.
- © 2014 by American Journal of Neuroradiology


