
Abstract
BACKGROUND AND PURPOSE: Pulsed arterial spin-labeling, DTI, and MR spectroscopy provide useful data for tumor evaluation. We evaluated multiple parameters by using these pulse sequences and the Ki-67 labeling index in newly diagnosed supratentorial gliomas.
MATERIALS AND METHODS: All 32 patients, with grade II (3 each of diffuse astrocytoma, oligodendroglioma, and oligoastrocytoma), grade III (3 anaplastic astrocytomas, 4 anaplastic oligodendrogliomas, and 1 anaplastic oligoastrocytoma), and grade IV (14 glioblastomas and 1 glioblastoma with an oligodendroglioma component) cases underwent pulsed arterial spin-labeling, DTI, and MR spectroscopy studies by using 3T MR imaging. The following variables were used to compare the tumors: relative cerebral blood flow, fractional anisotropy; ADC tumor/normal ratios; and the Cho/Cr, NAA/Cho, NAA/Cr, and lactate/Cr ratios. A logistic regression and receiver operating characteristic analysis were used to assess parameters with a high sensitivity and specificity to identify the threshold values for separate grading. We compared the Ki-67 index with various MR imaging parameters in tumor specimens.
RESULTS: Significant correlations were observed between the Ki-67 index and the mean, maximum, and minimum ADC, Cho/Cr, and lactate/Cr ratios. The receiver operating characteristic analysis showed that the combination of the minimum ADC and Cho/Cr ratios could differentiate low-grade and high-grade gliomas, with a sensitivity and specificity of 87.0% and 88.9%, respectively. The mean and maximum relative cerebral blood flow ratios were used to classify glioblastomas from other-grade astrocytomas, with a sensitivity and specificity of 92.9% and 83.3%, respectively.
CONCLUSIONS: Our findings indicate that pulsed arterial spin-labeling, DTI, and MR spectroscopy are useful for predicting glioma grade. Additionally, the parameters obtained on DTI and MR spectroscopy closely correlated with the proliferative potential of gliomas.
ABBREVIATIONS:
- ASL
- arterial spin-labeling
- C1 error
- average observed sensitivity and specificity
- C2 error
- observed number of instances of tumor-grade misclassification
- FA
- fractional anisotropy
- Lac
- lactate
- NPV
- negative predictive value
- PASL
- pulsed arterial spin-labeling
- PPV
- positive predictive value
- rCBF
- relative cerebral blood flow
- ROC
- receiver operating characteristic
Grading gliomas is necessary to determine the appropriate treatment strategy and assess prognosis. Classifying lesions into 4 grades based on histologic analyses requires tumor specimens obtained via biopsy or surgical resection.1
On conventional MR imaging with gadolinium contrast, the presence of FLAIR abnormalities or gadolinium enhancement reveals the appearance of new lesions. Advanced MR imaging, pulsed arterial spin-labeling (PASL), DTI, and MR spectroscopy provide useful data for evaluating tumors preoperatively. The PASL technique allows cerebral blood flow to be measured noninvasively without exogenous contrast agents. The usefulness of perfusion MR imaging with arterial spin-labeling (ASL) for assessing brain tumor angiogenesis and grading gliomas has been evaluated.2⇓⇓⇓⇓–7 DTI provides information on anisotropy, including fractional anisotropy (FA), and ADC. A recent study investigating DTI of gliomas showed that the FA and ADC tumor/normal tissue ratios are possible indicators of glioma proliferation and/or grading.8⇓–10 MR spectroscopy is also a noninvasive method that allows the measurement of various metabolites in vivo, such as Cho, Cr, NAA, and the pathologic levels of lactate (Lac), and has been reported useful for investigating gliomas.11⇓–13 The use of a combination of these noninvasive parameters has been reported to increase the diagnostic accuracy of glioma grading.7,9,11,12,14⇓⇓⇓–18 Very few reports describe comparisons of multiple parameters, including the relative cerebral blood flow (rCBF)-measured PASL sequence on 3T MR imaging, and glioma grading. Immunohistologically, the Ki-67 labeling index on histologic examinations is known to correlate with malignancy, and it also functions as a marker of proliferation in gliomas.19 According to the previous literature, this index is correlated with various advanced MR imaging parameters.8,20,21
In this study, we performed a comparative review of multiple parameters obtained with pulse sequences evaluated by using 3T MR imaging and glioma grading in newly diagnosed patients with glioma. Our purpose was to evaluate whether the parameters provide useful, complementary information and whether this combination of parameters shows the best performance for grading cerebral gliomas. The results of the present study are clinically valuable for evaluating sensitivity, specificity, positive predictive value (PPV), and negative predictive value (NPV) and determining the threshold values by analyzing receiver operating characteristic (ROC) curves. Under the same conditions, we evaluated the correlations between various MR imaging parameters and the proliferation marker, the Ki-67 labeling index.
Materials and Methods
Patients
Thirty-two patients ranging in age from 16 to 82 years with newly diagnosed supratentorial glioma, to avoid confounding findings related to posttherapeutic effects, were entered into this study. All patients underwent PASL, DTI, and MR spectroscopy studies by using 3T MR imaging. We reviewed all PASL, FA, ADC, and MR spectroscopy studies of supratentorial cerebral gliomas performed between March 2010 and October 2012. No patients had a clinical history of previous surgery, chemotherapy, or radiation therapy.
The histologic analysis was performed, according to the World Health Organization brain tumor classification revised in 2007, of tissue samples obtained at the time of either surgical resection or image-guided biopsies.1
All patients provided their informed consent to participate in this study, which was conducted in accordance with the ethical principles of the Declaration of Helsinki. The study protocol was approved by the Ethics Committee of the Oita University Faculty of Medicine.
MR Imaging Protocol
Conventional MR imaging included T1-weighted spin-echo, T2-weighted fast spin-echo, fluid-attenuated inversion recovery, and contrast-enhanced T1-weighted axial imaging (0.1-mmol/kg meglumine gadoterate, Magnescope; Guerbet Japan, Tokyo, Japan) performed at a field strength of 1.5T. After 2–5 days, we performed the advanced MR imaging examination. All participating patients underwent an advanced MR imaging protocol that included PASL, DTI, MR spectroscopy, and SWI by using a superconducting magnet at a field strength of 3T (Magnetom Verio; Siemens, Erlangen, Germany). T1-weighted structural images were acquired with a 3D MPRAGE device in the sagittal plane. The imaging parameters were as follows: TR/TE = 1900/2.53 ms, TI = 900 ms, flip angle = 9°, FOV = 21.0 cm, section thickness = 1 mm, section gap = 0.5 mm, number of sections collected = 176, matrix = 192 × 192 × 256. An SWI sequence was performed to detect calcification and hemorrhagic areas. On the basis of advanced MR imaging, rCBF, FA, ADC, and MR spectra were calculated by the MR imaging console software program (syngo MR B17; Siemens).
Pulsed Arterial Spin-Labeling
We performed pulsed arterial spin-labeling perfusion MR imaging by using QUIPSS II with thin-slice TI1 periodic saturation (Q2TIPS).22 The Q2TIPS technique is a pulsed arterial spin-labeling method that enables the acquisition of multiple sections. The inversion and saturation pulse parameters of Q2TIPS were set as follows: TI1 = 700 ms, TI1S = 1600 ms, and TI2 = 1800 ms. The other imaging parameters were as follows: TR/TE = 2800/13 ms, flip angle = 90°, FOV = 25.6 cm, section thickness = 8 mm, voxel size = 4 × 4 × 8 mm, section number = 9. Crusher gradients were not used. The total acquisition time was 4 minutes 19 seconds. Motion correction was interpolated according to the 3D k-space method, with a spatial filter setting of 2.0.
Diffusion Tensor Imaging
Axial DTI was performed by using single-shot spin-echo echo-planar imaging sequences. The parameters were as follows: TR/TE = 9200/96 ms, FOV = 23.0 cm, matrix = 128 × 128, b=0 s/mm2 as reference imaging and b=1000 s/mm2, diffusion-sensitive dimensions = 12, average = 3, scanning time = 6 minutes 28 seconds.
PASL and Diffusion Tensor Images
After reconstruction, the PASL, FA, and ADC images were converted into the DICOM format and inserted into the data base. To minimize confounding factors in the analysis, we kept the size of the ROIs in the lesion and contralateral normal brain constant (diameter = 8.0 mm) on both the PASL and diffusion tensor images. Two observers placed 5 ROIs each within the solid tumor component and 1 region of interest each in the contralateral normal brain.6 Whenever possible, the ROIs were placed in mirrored white matter regions; when this placement was not possible, the ROIs were positioned in representative normal white matter in the same transaxial plane.14 Care was taken to ensure that the ROIs were entirely within the solid part of the lesion to avoid contamination of the region of interest from normal tissue, areas of necrosis, cysts, hemorrhage, or intratumoral mineralization. We placed the ROIs at the site of the enhanced lesions on the contrast-enhanced T1-weighted MR images. In patients with nonenhancing tumors, the tumor parenchyma was identified as the area of hyperintensity on T2-weighted and FLAIR images. The ROIs were evaluated for eligibility independently by 2 authors (H.F. and T.S.), and any disagreements were resolved by consensus.
The rCBF, FA, and ADC ratios were calculated as follows: rCBF (FA or ADC) ratio = rCBF (FA or ADC) [tumor] / rCBF (FA or ADC) [contralateral normal tissue]. The average values of the minimum, maximum, and mean of the rCBF, FA, and ADC ratios were then selected for the analysis.
MR Spectroscopy
A single-voxel water-suppressed point-resolved spectroscopy sequence and multivoxel chemical shift imaging were performed. The single-voxel water-suppressed point-resolved spectroscopy sequence was performed by using the following parameters: TR/TE = 2000/270 ms, flip angle = 90°, voxel size = 20 × 20 × 20 mm (normal-sized lesion) or 15 × 15 × 15 mm (small lesion: lesions measuring less than approximately 20 mm in diameter), acquisition average = 192 (normal-sized lesion) or 256 (small lesion). The total acquisition time was 6 minutes 32 seconds (normal-sized lesion) or 8 minutes 40 seconds (small lesion). Multivoxel chemical shift imaging was performed by using the following parameters: TR/TE = 1700/270 ms, flip angle = 90°, FOV = 16.0 cm, section thickness = 8 mm, voxel size = 10 × 10 × 8 mm, acquisition average = 5. The total acquisition time was 9 minutes 26 seconds. The single-voxel water-suppressed point-resolved spectroscopy sequence was primarily performed; however, multivoxel chemical shift imaging was performed in cases of deep and centrally located tumors measuring >3 cm in diameter because for some temporal lobe and inferior frontal lobe tumors, adequate shimming can be problematic, while for intraventricular tumors and/or very peripheral tumors, CSF or scalp fat contamination may adversely affect MR spectroscopy acquisition. We selected the region of interest of the multivoxel area in the center region to prevent the influence of magnetic susceptibility and to optimize the shimming procedure. To the extent possible, we selected the multivoxel technique because the previous literature suggests that multivoxel MR spectroscopy is more useful for distinguishing glioma recurrence from posttreatment effects than single-voxel MR spectroscopy.23
The spectra were automatically analyzed for the relative signal intensity (area under the fitted peaks in the time domain) of the following metabolites: Cho, Cr, NAA, and Lac. The ratios of Cho/Cr, NAA/Cho, NAA/Cr, and Lac/Cr at TE 270 ms were calculated. The postprocessing steps, including the frequency shift, baseline correction, phase correction, and peak fitting/analysis, were performed first automatically and then manually. All spectral analyses were conducted within a window from 0.50 to 4.30 ppm (by using the standard method of assigning a shift value of 4.7 ppm to the measured unsuppressed water peak). The metabolite peak areas were assigned as follows: Cho, 3.20 ppm; Cr, 3.02 ppm; NAA, 2.00 ppm; Lac, 1.29 ppm. To avoid contamination of the voxel from normal tissue or areas of necrosis or cysts based on conventional MR imaging, we obtained the metabolite ratios within the solid portion of the lesion by consensus without knowledge of the final histologic tumor diagnosis.
Immunohistologic Assay
For Ki-67 immunostaining, the specimens were sliced from formalin-fixed, paraffin-embedded tissues. We stained the sections with a mouse anti-Ki-67 monoclonal antibody (MIB-1; Dako Cytomation, Carpinteria, California; 1:50 dilution). The Ki-67 labeling index, defined as the number of positive tumor cells / the total number of tumor cells × 100%, was calculated for at least 10 fields selected at random under a magnification ×400.
Statistical Analysis
We compared the MR imaging parameters and the Ki-67 labeling index in each of 3 groups (grade II versus grade III versus grade IV) by using the Tukey-Kramer test. The sensitivity, specificity, PPV, and NPV were calculated by using an ROC analysis to correctly identify high-grade gliomas (grade III and IV) and glioblastomas (grade IV), to differentiate the 2 groups, such as patients with high- and low-grade gliomas and those with glioblastomas and other-grade gliomas (grade II and III). Because oligodendroglial tumors tend to demonstrate hyperperfusion relative to astrocytic tumors, we also analyzed the CBF data only for purely astrocytic tumors that did not contain oligodendroglial regions, such as diffuse astrocytomas, anaplastic astrocytomas, and glioblastomas. The optimal threshold values were those that did the following: 1) minimized the observed number of instances of tumor-grade misclassification (C2 error = fraction of misclassified tumors), and 2) maximized the average observed sensitivity and specificity (C1 error) resulting in C1 = 1 − (sensitivity + specificity) / 2. To determine the combination of the most discriminative parameters, we used a stepwise multiple logistic backwards regression. The logistic regression was selected by using a cutoff level of .05 for significance. The correlations between the MR imaging parameters and the Ki-67 labeling index were analyzed statistically by using a Spearman correlation coefficient analysis.
Results
Among 32 patients, 9 tumors were grade II (3 each of diffuse astrocytoma, oligodendroglioma, and oligoastrocytoma), 8 tumors grade III (3 anaplastic astrocytomas, 4 anaplastic oligodendrogliomas, and 1 anaplastic oligoastrocytoma), and 15 tumors grade IV (14 glioblastomas and 1 glioblastoma with an oligodendroglioma component). The patients included 13 men and 19 women, with a mean age of 59.8 ± 16.8 years. The conventional MR imaging characteristics of the tumors are shown in the On-line Table. Patient 27 was unable to undergo an examination by using contrast agent due to her current treatment with dialysis. We performed multivoxel MR spectroscopy in 9 cases and single-voxel MR spectroscopy in 23 cases. Examples of low-grade and high-grade glial neoplasms are provided in Figs 1 and 2, respectively.

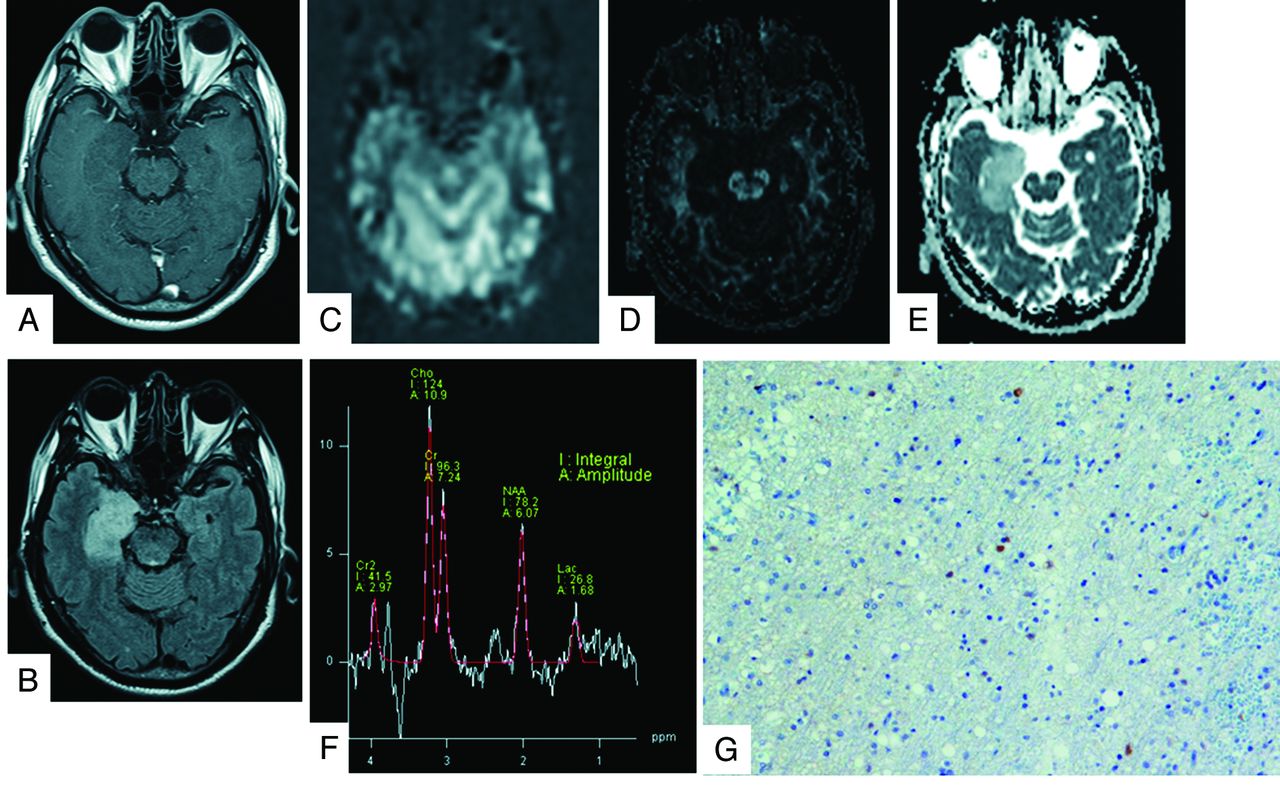
A 62-year-old man with a grade II oligoastrocytoma. The contrast-enhanced T1-weighted image shows a nonenhancing mass in the right hippocampus (A). The lesions presented high-intensity signals on FLAIR images (B). The rCBF map on PASL shows no areas of hyperperfusion (C). The FA map shows low FA values (D). The ADC map shows increased tumor diffusion values (E). The tumor MR spectrum shows decreased NAA and slightly increased Cho and Lac (F). The Ki-67 labeling index is 5.0% (original magnification × 400) (G).

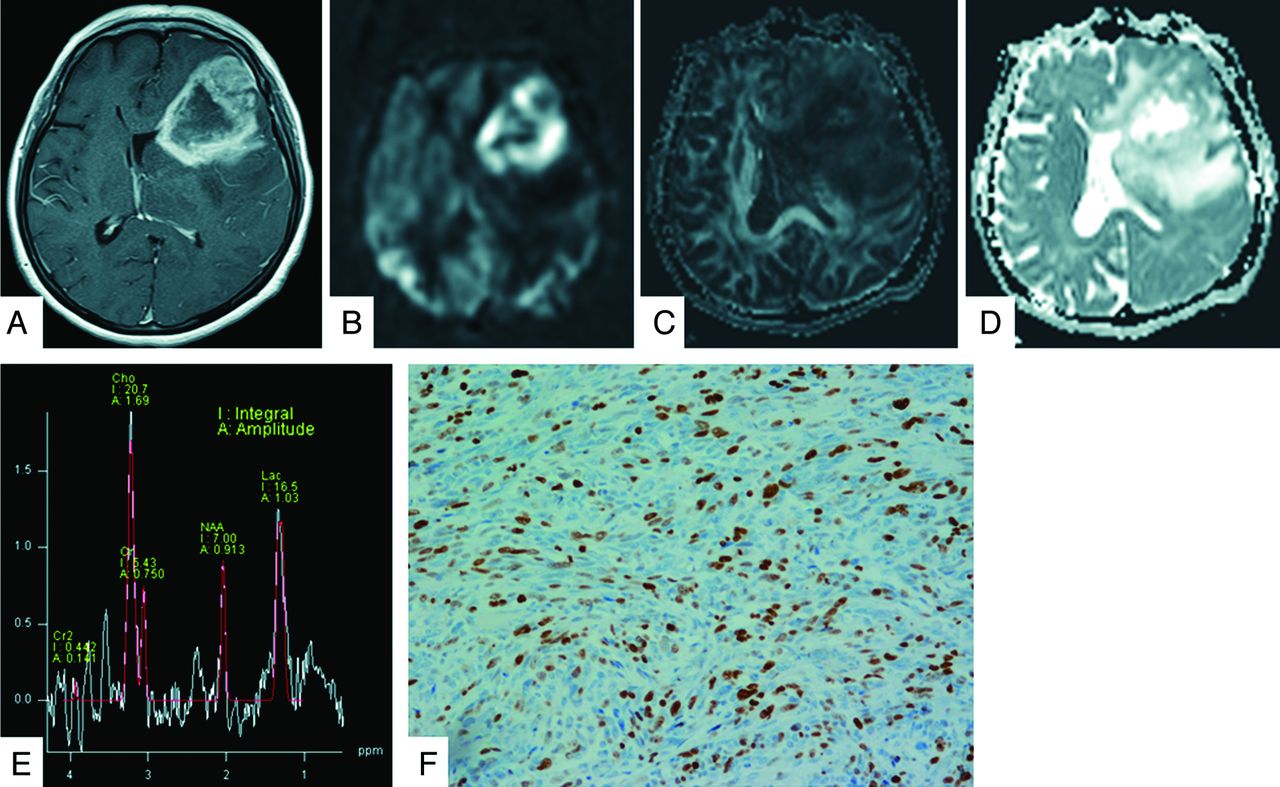
A 60-year-old woman with a grade IV glioblastoma. The lesion on the left frontotemporal lobe exhibits strong enhancement on gadolinium T1-weighted image (A). The neoplasm is clearly hyperperfused compared with the healthy parenchyma on the PASL image (B). The FA map shows slightly low FA values (C). The ADC map shows heterogeneous tumor diffusion values (D). The tumor MR spectrum shows decreased NAA with a marked increase in Cho and Lac (E). The Ki-67 labeling index is 27.0% (original magnification × 400) (F).
Both the mean ADC ratio (r = −0.455, P = .0113) and maximum ADC ratio (r = −0.352, P = .0497) exhibited a negative correlation with the Ki-67 index. In particular, there was a significant negative correlation between the minimum ADC ratio and the Ki-67 index (r = −0.470, P = .0089). A positive correlation was also observed between the Cho/Cr ratio and the Ki-67 index (r = 0.461, P = .0103) and between the Lac/Cr ratio and the Ki-67 index (r = 0.418, P = .0199). In contrast, no significant correlations were noted between the other parameters and the Ki-67 index.
The maximum rCBF ratio of the grade IV gliomas was higher than that of the grade III gliomas, while the Ki-67 labeling index of the grade II gliomas was lower than that of the grade III and grade IV gliomas (P < .05). The maximum FA ratio associated with grade II gliomas was lower than that associated with the grade IV gliomas, while the mean and minimum ADC ratios of grade II gliomas were higher than those of grade IV gliomas (P < .05). Other comparisons did not reveal any statistically significant differences.
Regarding the parameters calculated from PASL, DTI, and MR spectroscopy, the threshold values were obtained separately for the minimum C1 and C2 errors, as shown in Tables 1 and 2. With respect to individual parameters for separating high-grade from low-grade gliomas, a threshold value of 1.789 for the Lac/Cr ratio, which exhibited the best performance for a minimum C1 error, provided sensitivity, specificity, PPV, and NPV of 73.9%, 100.0%, 100.0%, and 60.0%, respectively. Meanwhile, a threshold value of 1.789 for the Cho/Cr ratio, which exhibited the best performance for a minimum C2 error, provided sensitivity, specificity, PPV, and NPV of 91.3%, 77.8%, 91.3%, and 77.8%, respectively. Regarding individual parameters for separating glioblastomas from other-grade gliomas, a threshold value of 2.845 for the maximum rCBF ratio, which exhibited the best performance for minimum C1 and C2 errors, provided sensitivity, specificity, PPV, and NPV of 86.7%, 82.4%, 81.3%, and 87.5%, respectively. In particular, for evaluating purely astrocytic tumors, both the mean and maximum rCBF ratios demonstrated sensitivity, specificity, PPV, and NPV of 92.9%, 83.3%, 92.8%, and 83.4%, respectively.
Threshold values for multiple parameters for differentiating high- and low-grade gliomas
Threshold values for multiple parameters for differentiating glioblastomas and other-grade gliomas
According to multivariate logistic regression analysis, the combinations of parameters for differentiating high- and low-grade gliomas included the minimum ADC and Cho/Cr ratios, while those for differentiating glioblastomas and other-grade gliomas included the maximum rCBF and mean ADC ratios. The results of the ROC analyses by using these combinations are shown in Tables 3 and 4. The combination of the minimum ADC ratio and the Cho/Cr ratio provided sensitivity, specificity, PPV, and NPV of 87.0%, 88.9%, 95.2%, and 72.7%, respectively, for minimum C1 and C2 errors for differentiating high- and low-grade gliomas. Meanwhile, the combination of the maximum rCBF ratio and the mean ADC ratio provided sensitivity, specificity, PPV, and NPV of 73.3%, 94.1%, 91.7%, and 80.0%, respectively, for minimum C1 and C2 errors for differentiating glioblastomas and other-grade gliomas. This combination appears to be inferior compared with the minimum C1 and C2 errors of the maximum rCBF ratio; however, its accuracy was 84.4%, which is as high as that observed for the maximum rCBF ratio.
Combination of the minimum ADC ratio and Cho/Cr for differentiating high- and low-grade gliomas
Combination of the maximum rCBF ratio and mean ADC ratio for differentiating glioblastomas and other-grade gliomas
Discussion
Cerebral gliomas are important and the most common primary brain tumors. MR imaging plays a critical role in the preoperative assessment and grading of gliomas. The classification and grading of gliomas on conventional MR imaging are sometimes unreliable. The sensitivity, specificity, PPV, and NPV for identifying high-grade gliomas on conventional MR imaging are 72.5%, 65.0%, 86.1%, and 44.1%, respectively.15 The current study demonstrated contrast enhancement in 66.7%, 75.0%, and 100% of grade II, III, and IV gliomas, respectively, which suggests that it is difficult to perform glioma grading by only using structural gadolinium-enhanced MR imaging.17 Physicians must perform a biopsy or surgical resection to make a pathologic diagnosis and evaluate the need for postoperative chemoradiotherapy. However, lesions for which the risks of biopsy are high cannot be accurately diagnosed and graded. The noninvasive evaluation of gliomas results in a more precise assessment for selecting the surgical approach or chemoradiotherapy.
In the present study, the combination of the minimum ADC ratio and the Cho/Cr ratio exhibited a high sensitivity and specificity for distinguishing high- and low-grade gliomas. The mean ADC and minimal ADC values have been reported to be correlated with the tumor cell attenuation and thus used to grade astrocytomas.10,14 In addition, the ADC ratio has been reported to be useful for grading gliomas.18 Past studies have revealed that the Cho/Cr ratio tends to increase as glioma malignancy progresses.13,18 Furthermore, Server et al18 reported a minimum ADC ratio threshold value of 1.41 and a Cho/Cr threshold value of 1.35 for dividing high- and low-grade gliomas, similar to the results of our analysis. Published data regarding intracranial tumors indicate that a high ADC is attributable to a low level of cellularity, necrosis, or cysts, while a lower ADC is attributable to the presence of an attenuated, highly cellular tumor. The typical spectrum corresponding to a tumor shows an increased Cho peak, which corresponds to increased cell attenuation and membrane turnover in neoplastic tissue. With respect to glioma grading, our results consistently reflect the mitotic activity and presence of microvascular proliferation.
On the other hand, the maximum rCBF ratio, in addition to being helpful in combination with the mean ADC ratio, is most useful for differentiating glioblastomas and other-grade gliomas. The minimum ADC ratio was excluded in the logistic analysis, though the minimum ADC ratio of the glioblastomas was significantly lower than that of the other-grade lesions (P < .05). Perhaps, this is due to the inclusion of oligodendroglial tumors and astrocytic tumors in the assessment. It is surprising that the parameters obtained on MR spectroscopy did not demonstrate a high utility in differentiating glioblastomas from the remaining tumors. In particular, we did not expect that the sensitivity and specificity of the NAA/Cho ratio would be so low because prior studies have suggested that a prominent elevation of the Cho/NAA ratio is a hallmark of glioblastomas.13,24 In the present study, we only evaluated astrocytomas, except for oligodendroglial tumors, and found that the maximum and mean rCBF ratios can be used to discriminate glioblastomas and other lesions, with C1 and C2 errors of 11.9% and 3.3%, respectively. Perfusion MR imaging is one of the most effective noninvasive methods for quantifying the grade of neoplastic neovascularization.5,25⇓⇓⇓–29 Furthermore, neovascularization is one of the most important criteria of malignancy for glioma grading. There has been extensive perfusion research related to predicting the glioma grade, much of it by using the DSC MR imaging technique.27,28 On the other hand, ASL is a promising tool for assessing tumor angiogenesis and glioma grading.2⇓⇓⇓⇓–7,26,29 ASL has several advantages, including being a nonionizing and completely noninvasive MR imaging technique that uses magnetically labeled arterial blood water protons as an endogenous tracer. For this reason, ASL is very suitable for diagnosing individuals with renal insufficiency and providing repeat follow-up.
Histologically, glioblastomas statistically have a larger microvessel attenuation than grade III lesions.30 Previous studies have reported a positive correlation between rCBF-derived continuous ASL and vascular attenuation in gliomas.3,5 Weber et al16 attempted to elucidate the relationships between the rCBF on PASL and histopathologic findings, including the cell proliferation index and vessel attenuation, as defined by the number of microvessels. Our results indicated a high level of vascularity in glioblastomas and suggest that rCBF is a potential indicator of malignancy in gliomas based on vascular attenuation.
A multiparametric MR imaging approach has been attempted in past reports. Roy et al17 studied 56 patients by using conventional MR imaging, DTI, dynamic contrast-enhanced perfusion imaging, and volumetric whole-brain MR spectroscopy and concluded that relative cerebral blood volume can be used to individually classify gliomas as low- or high-grade, with a sensitivity and specificity of 100% and 88%, respectively. On combining this parameter with the maximum relative cerebral blood volume, FA, ADC, and minimal NAA + Cr, classification was achieved with a 2% error and a sensitivity and specificity of 100% and 96%, respectively.17 Unfortunately, the findings of the present study do not reach these levels of sensitivity and specificity; however, we used the ASL technique, which can measure the rCBF without a contrast agent. Weber et al16 investigated the functional MR imaging methods DSC and PASL, dynamic contrast-enhanced MR imaging, and MR spectroscopy at 1.5T and suggested that the rCBF derived by using the PASL technique offers superior diagnostic performance in predicting the grade of gliomas. In another study of 1.5T, the combination of PASL and ADC significantly improved the sensitivity and predictive value of the preoperative grading of gliomas compared with conventional imaging.4 Only 1 study of the multiparametric MR imaging technique in combination with the ASL perfusion technique at 3T has been reported. Chawla et al7 showed that the rCBF evaluated by using continuous ASL cannot be used to differentiate low-grade from high-grade gliomas, though the rCBF-guided voxel assessed by using a voxel analysis of multivoxel MR spectroscopy is useful for grading such tumors.
Histologically, we examined the Ki-67 labeling index as a marker of proliferation. Previous studies have shown that a higher rate of Ki-67-positive cells corresponds to greater malignancy and a worse survival rate in patients with gliomas.19 Our studies demonstrated that the Ki-67 labeling index is correlated with MR imaging parameters, such as the ADC ratio, Cho/Cr ratio, and Lac/Cr ratio, consistent with the findings of previous literature.20,21,31 These noninvasive imaging modalities can be used to reliably assess the potential for proliferation among brain tumors without a surgical procedure.
This study has several limitations. For example, the design included a relatively small population. In addition, when using diagnostic methods based on histologic biopsies, sampling bias should be considered. Although we used the same size region of interest for the multiple parameters of PASL, FA, and ADC, the region-of-interest diameter was relatively larger than that used in past reports and the effects of tumoral heterogeneity and regional differences were difficult to assess. Our method is based on the findings of an article by Hirai et al6; however, the placement of 5 ROIs on the ipsilesional side with only 1 region of interest on the contralateral side appears to be problematic for determining the ideal ratio. Regarding the limitation of the PASL sequence, a section thickness of 8 mm is relatively thick compared with that used in previous literature. We carefully placed the region of interest and minimized the potential for such errors. In the present study, we evaluated the data obtained by using both single-voxel and multivoxel techniques to secure the patients, though there may be a potential weaknesses in analyzing the combined single- and multivoxel MR spectroscopy data. Furthermore, the same TE conditions were used in each MR spectroscopy study to reduce the potential for error.
Conclusions
Our findings indicate that PASL, DTI, and MR spectroscopy provide useful parameters for predicting malignant grades of cerebral gliomas. In particular, the rCBF ratio calculated by using PASL at a high field strength is useful for distinguishing glioblastomas from grade II or III gliomas. The ADC, Cho/Cr, and Lac/Cr ratios have the potential to predict glioma proliferation.
Footnotes
This work was supported by a grant from the Japan Science and Technology Agency and the Ministry of Education, Culture, Sports, Science and Technology.
Indicates open access to non-subscribers at www.ajnr.org
References
- Received February 20, 2014.
- Accepted after revision April 25, 2014.
- © 2014 by American Journal of Neuroradiology


Jump to section
Related Articles
Cited By...
- Application of 7T MRS to High-Grade Gliomas
- Addition of Amide Proton Transfer Imaging to FDG-PET/CT Improves Diagnostic Accuracy in Glioma Grading: A Preliminary Study Using the Continuous Net Reclassification Analysis
- 3D Pseudocontinuous Arterial Spin-Labeling MR Imaging in the Preoperative Evaluation of Gliomas
- Improving the Grading Accuracy of Astrocytic Neoplasms Noninvasively by Combining Timing Information with Cerebral Blood Flow: A Multi-TI Arterial Spin-Labeling MR Imaging Study